Autor Cointelegraph By William Suberg

Markets pivot to September Fed rate hike: Five things to know in Bitcoin this week

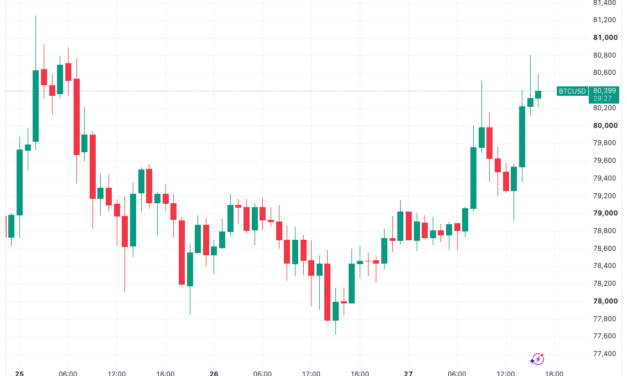
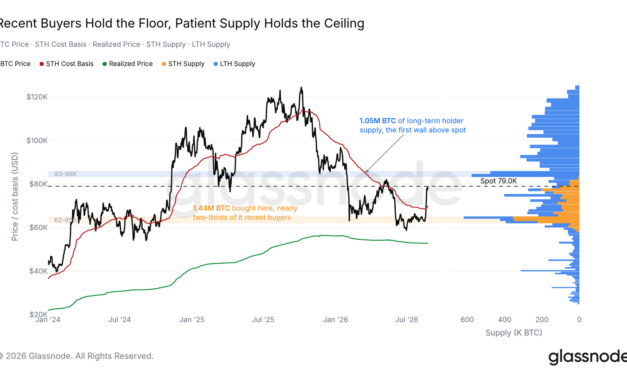
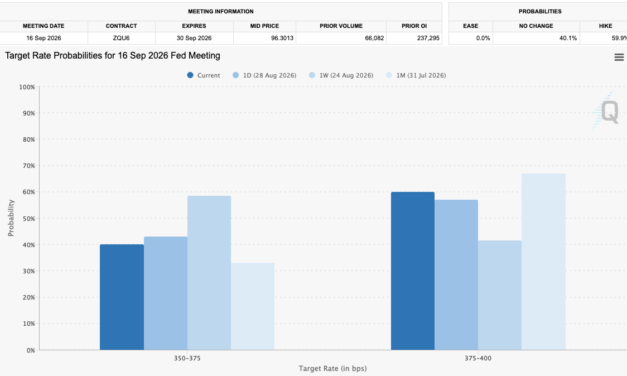
Bitcoin (BTC) heads into September still battling key resistance as markets flip hawkish on Federal Reserve policy.Key points:Markets see a 60% chance of the Fed hiking interest rates in September, with jobs data due this week.Oil has experienced renewed volatility amid fresh US strikes on Iran and an unprecedented US-Venezuela oil-supply deal.Bitcoin remains under a crucial patch of resistance below $86,000 heading into the August monthly candle close.September rate hike bets return after Jackson HoleThe coming week will bring the release of multiple US employment indexes, each likely to shape expectations for policy changes from the Federal Reserve.The Fed is already in the spotlight after last week’s Jackson Hole economic symposium, which featured its first keynote speech from new chair Kevin Warsh. Warsh remained characteristically tight-lipped on policy cues, describing forward guidance — a fixture of Fed PR for decades — as having “overstayed its welcome.”On inflation, Warsh described current data as too high, despite July’s lower-than-expected results for the Consumer Price Index (CPI) and Personal Consumption Expenditures (PCE) index.“Each of these broad inflation measures have fallen significantly from their highs of a few years ago, but progress through the past couple of years has been more modest, and while this summer’s PCE and CPI readings were better than expected, they do not tell me that underlying trends have meaningfully improved,” he said.Markets responded with increased expectations of interest-rate hikes, reverting to majority odds for a 0.25% hike at the Fed’s September meeting, per data from CME Group’s FedWatch Tool. At the time of writing, these odds stand at just below 60%, up from 41.4% last week.Fed target-rate probability comparison for September FOMC meeting (screenshot). Source: CME GroupRates expectations could be tempered, however, by labor-market numbers. Friday will see August nonfarm payrolls data released. The economy is expected to have added 50,000 jobs last month, compared to a loss of 23,000 in June.Private-sector employment numbers will precede nonfarm payrolls on Wednesday, followed by initial jobless claims on Thursday. “All eyes are on the labor market,” trading resource The Kobeissi Letter summarized in commentary on X, noting that this would form the last slew of jobs data before the September rate decision.Kobeissi flagged major downward revisions to employment numbers, with weak labor-market conditions forming a potential hurdle to Fed policy tightening. Citing data from the Bureau of Labor Statistics (BLS), it reported another 79,000 jobs removed in the 12 months through March this year.“This follows last year’s record -911,000 revision and marks the 4th consecutive annual downward adjustment, matching the streak that ended in 2010 after the 2008 Financial Crisis,” it added, describing the labor market as being “weaker than initially reported for years.”US employment data revisions. Source: The Kobeissi Letter on X.comOil spikes on US-Iran escalationOil markets are at the forefront of macro volatility as the week begins thanks to a combination of geopolitical catalysts.Renewed US strikes on Iran sent Brent crude back above $90 per barrel on Monday, nearing its highest levels in a week. US WTI crude passed $85 per barrel, and was up 2.5% on the day at the time of writing.CFDs on Brent crude oil one-day chart. Source: Cointelegraph/TradingViewEuropean stocks came under pressure as a result of the events, with Germany’s DAX down 0.7%. US president Donald Trump implied that Iran’s Kharg Island oil hub was once more a target. In a post on Truth Social, Trump uploaded an AI-generated video that appeared to show the bombing of oil infrastructure, describing the island as “being blown to smithereens.”DAX one-day chart. Source: Cointelegraph/TradingViewThe strikes followed news of a major energy deal granting the US significant control of Venezuela’s oil reserves. Numbers from Venezuela’s interim president Delcy Rodriguez quoted by CNBC and others referenced a daily oil-output target of 1.5 million barrels, with total reserves involved at 65 billion barrels, currently worth around $5.4 trillion.In a Truth Social post, Trump described the takeover as the “biggest oil deal in history.”Bitcoin battles multiple 50-week trend linesBitcoin saw late sell pressure into Sunday’s weekly close, with a brief trip below its 50-week exponential moving average (EMA) at $77,269, per data from TradingView. Price defended the trend line, which we had previously flagged as important support, for a second consecutive week. In the wake of its recent rally, BTC had managed to reclaim the moving average with a weekly close for the first time since November 2025.BTC/USD one-week chart with 50 EMA. Source: Cointelegraph/TradingViewIn his latest market observations on X, Rafael Schultze-Kraft, cofounder of crypto analytics platform Glassnode, drew attention to the equivalent simple moving average (SMA) at $80,307. Here, BTC/USD still lacks a reclaim on the weekly time frame — something which has preceded additional price upside in the past, he showed.BTC/USD chart with periods above and below 50-week SMA. Source: Rafael Schultze-Kraft on X.comMonthly close faces stiff resistanceHeading into the August monthly close, Bitcoin bulls face a key test as monthly gains for BTC/USD hover near 25%.BTC/USD monthly returns (screenshot). Source: CoinGlassDespite the biggest crypto short liquidation event ever recorded, buyers have so far failed to reclaim key resistance above $80,000, analysis warns. “Bitcoin is still hovering beneath the Macro Downtrending resistance, having upside wicked briefly beyond it,” trader and analyst Rekt Capital summarized about the current status quo in his latest analysis on X. “Still the pivotal resistance and by staying below it, Bitcoin continues its series of Macro Lower Highs.”BTC/USD one-month chart. Source: Rekt Capital on X.comRekt Capital argued that a breakout above this resistance would have major implications for the four-year BTC price cycle, as it would mean that its latest bear market would be shorter than those before it.Beyond the trend line, however, additional resistance has already formed thanks to thickening ask liquidity on exchange order books. As Cointelegraph reported, this extends to $86,000, thus requiring even more buy-side momentum to effect a lasting breakout.“Every overhead structure we track now sits between $81K and $86K; that band is where the recovery’s demand meets its test,” Glassnode wrote in research last week.Larger buyers seen as pivotal to BTC price upside Glassnode calculated that 1.05 million BTC owned by long-term holders have a cost basis between $83,000 and $86,000. Long-term holders refer to wallets holding a given amount of BTC without selling for six months or more.Related: Supply absorption ‘key question’ as Bitcoin fails to reclaim $80K: AnalysisBTC supply distribution by wallet cohort. Source: GlassnodeIn additional findings this week, onchain analytics platform CryptoQuant drew attention to the potential impact of large-volume investors going into September. These entities, its data showed, were behind buyer appetite this month, while smaller investors took profit or exited the market after their holdings returned to breakeven.“From 1–30 August, wallets with 100+ BTC added about 60,000 BTC. Wallets with 1–100 BTC sold about 33,000. Wallets under 1 BTC sold about 14,000,” it wrote in a blog post on Monday. “That split is the month. Large holders absorbed the breakout. Smaller holders used the rally as an exit.”Bitcoin accumulation data by wallet cohort (screenshot). Source: CryptoQuantCryptoQuant added that the view of large-investor accumulation would require reassessment should those entities start selling recently acquired supply below $80,000.

Čítaj viac
Bitcoin dips to $78.4K as Fed’s Warsh downplays softer inflation prints

Bitcoin (BTC) saw volatility after Friday’s Wall Street open as markets reacted to US Federal Reserve chair Kevin Warsh’s comments on future monetary policy.Key points:Bitcoin initially fell during Fed chair Kevin Warsh’s Jackson Hole keynote speech before circling $79,500.Warsh said he sees no trend change in inflation despite recent lower PCE and CPI prints.BTC price action sustaining above $83,000 hinges on Bitcoin derivatives traders, analysis says.Warsh: Inflation trends have not “meaningfully improved”Data from TradingView showed BTC/USD dipping to $78,442 on Bitstamp in volatile trading conditions, down around 1% at the time of writing.BTC/USD one-hour chart. Source: Cointelegraph/TradingViewIn his first keynote speech at the annual Jackson Hole Symposium, Warsh delivered a cautionary tone on inflation, committing to the Fed’s 2% target. The Fed chair doubled down on an earlier pledge to reduce the scope of hints over future policy that the Fed offers to markets, avoiding forward guidance altogether and stating that it would not make a reappearance in the future.“Forward guidance as a regular practice was adopted by my colleagues and me during the Global Financial Crisis. It was essential at the time, and we introduced it with much fanfare. But, as with other legacies of crises past, I believe that the practice has overstayed its welcome,” he stated.Warsh further dismissed recent lower-than-expected inflation prints in the Consumer Price Index (CPI) and Personal Consumption Expenditures (PCE) index as a sign of a downtrend being in progress.“Each of these broad inflation measures have fallen significantly from their highs of a few years ago, but progress through the past couple of years has been more modest, and while this summer’s PCE and CPI readings were better than expected, they do not tell me that underlying trends have meaningfully improved,” he continued.US stocks avoided losses on the back of Warsh’s words, which also included a complimentary view of business performance and AI sector growth. Both the S&P 500 and the tech-heavy Nasdaq Composite Index were up around 0.5% at the time of writing.Analysis stresses derivatives’ role in further BTC price gainsBTC price action thus continued to gyrate around the $80,000 mark, acting in a narrow intraday range ahead of the August monthly close.Previously, Cointelegraph reported on expectations for the monthly close, with analysis demanding that BTC/USD break above a downward-sloping trend line and defend the 50-week exponential moving average near $77,250 to sustain the uptrend.BTC/USD one-day chart with 50-month EMA. Source: Cointelegraph/TradingViewRelated: Bitcoin bear market ‘over’ as price metric copies 2023 recovery: CryptoQuant CEOOnchain data additionally revealed a thick patch of resistance between the current spot price and $86,000, slowing upside momentum.Commenting in its latest analysis, trading company QCP Capital argued that even if price were to break higher, derivatives markets would need to provide the necessary support by keeping both funding rates and open interest growth in check.“If price continues higher while funding remains contained and open interest rebuilds gradually, that would indicate a different market structure from one where leverage accelerates rapidly alongside price,” QCP Capital wrote, adding:“The key distinction is therefore not simply whether BTC trades above or below $83.3k, but whether subsequent price action continues to be supported by spot participation or becomes increasingly driven by leveraged positioning.”At the time of writing, BTC/USD was up 26.35% month-to-date, per data from CoinGlass, marking its best August performance since 2017.BTC/USD monthly returns (screenshot). Source: CoinGlass

Čítaj viac

Bitcoin bear market ‘over’ as price metric copies 2023 recovery: CryptoQuant CEO

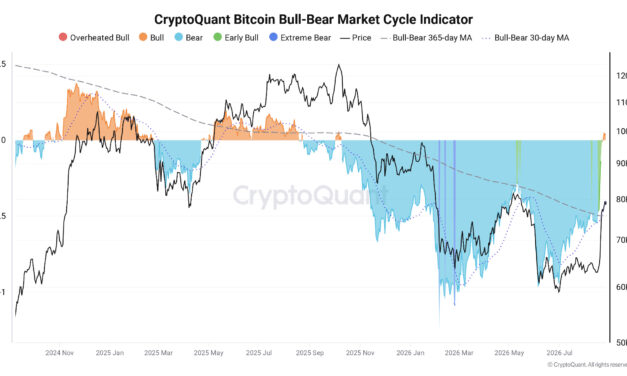
According to some metrics, Bitcoin (BTC) has ended its bear market as a composite BTC price indicator flips bullish for the first time since October 2025.Key points:Bitcoin has exited its 2026 bear market, Ki Young Ju says as a profitability metric prints a positive reading of 0.042.The breakout from negative to positive numbers repeats a bull-market recovery signal also visible in early 2023.Concerns remain over insufficient market liquidity to support a macro BTC price trend change.Bitcoin profit metric offers first bull signal in ten monthsThe latest data from onchain analytics platform CryptoQuant has led its CEO, Ki Young Ju, to call time on Bitcoin’s 2026 bear market.In an X post on Wednesday, Ki flagged the first positive reading on CryptoQuant’s Bull/Bear Market Cycle Indicator since early October.“The Bitcoin bear cycle is over,” he wrote in accompanying commentary.The indicator is derived from the P&L Index — initially devised by CryptoQuant’s head of research — and measures the P&L Index’s distance from its 365-day moving average. The P&L Index itself is composed of several onchain profitability metrics: the market value to realized value (MVRV) ratio, net unrealized profit/loss (NUPL) and the spent output profit ratio (SOPR). Together they provide an overall picture of Bitcoin investors’ realized and unrealized profits and losses. Values above zero for the Bull/Bear indicator point to bullish phases in the BTC price cycle as profitability improves. Current cycle lows came on Feb. 5 as BTC/USD fell to $60,000, with a reading of -1.244 corresponding to “extreme bear” conditions. As of Aug. 26, the most recent date for which full data is available, Bull/Bear displayed a positive reading of 0.042, placing it in its “bull” bracket.Bitcoin Bull/Bear Market Cycle Indicator. Source: CryptoQuantThe combination of P&L metrics and their 365-day moving averages has proven accurate at confirming macro BTC price trend changes. Ki notes that Bull/Bear likewise called the end of the previous bear market as upside returned in early 2023.Bitcoin Bull/Bear Market Cycle Indicator historical data. Source: CryptoQuantMisgivings over BTC price strength continue to mountBitcoin has seen the slow return of bull signals from various indicators in recent weeks, including the relative strength index (RSI), a recovery for which was also present at the end of 2022.Related: Supply absorption ‘key question’ as Bitcoin fails to reclaim $80K: AnalysisConsensus among market participants over Bitcoin’s recent upside marking the end of its macro downtrend is by no means unanimous. Previously, Cointelegraph reported on concerns that a lack of demand could see BTC/USD revert to downside, with multiple liquidity hurdles lined up immediately above spot price. In ongoing market commentary, trader and analyst Rekt Capital argued that the August monthly close would be “pivotal” for the fate of the recovery, referring to a potential breakout from a downward-sloping resistance trend line in place since October last year.

Čítaj viac

Bitcoin eyes $81K as Nvidia earnings beat boosts risk assets

Bitcoin (BTC) rebounded toward $81,000 around Thursday’s Wall Street open as Nvidia earnings boosted US stocks.Key points:Bitcoin reclaims $80,000 as $96.2 billion Nvidia earnings provide a boost to crypto and US equities.Expectations are running high ahead of Fed chair Kevin Warsh’s keynote speech at the Jackson Hole economic symposium on Friday.Bitcoin analysis sees sell-side pressure lessening above $82,000 ahead of the $6.6 billion August options expiry.Nvidia earnings beat sends stocks, crypto higherData from TradingView showed new local highs of $80,808 for BTC/USD, with bulls again seeking to cement the $80,000 mark as support.BTC/USD one-hour chart. Source: Cointelegraph/TradingViewNvidia surprised to the upside after Wednesday trading, posting Q2 earnings of $96.2 billion — nearly $4 billion more than expected. On Thursday, its stock surged more than 9% and its market cap gained over $400 billion, with the tech-heavy Nasdaq Composite Index 1% higher at the time of writing.“Nvidia is now on track to post the 3rd largest single-day market cap gain by a stock in history,” trading resource The Kobeissi Letter wrote in a reaction on X.Nvidia stock one-day chart. Source: Cointelegraph/TradingViewMarkets are now turning to the US Federal Reserve’s Jackson Hole economic symposium, already underway, ahead of chair Kevin Warsh’s keynote speech on Friday. Hopes are that Warsh, known for being tight-lipped on future policy shifts, will nonetheless tame market uncertainty amid mixed US inflation data and volatile government bond yields.“Chairman Warsh’s address is poised to be extremely key given the jump in long-term interest rates and high uncertainty over the path of inflation and Fed’s reaction function going forward,” Nationwide chief US economist Kathy Bostjancic said, quoted by CNBC.  Analyst sees Bitcoin sell wall thinning ahead of options expiryCrypto liquidations edged higher at around $417 million over 24 hours, per data from CoinGlass, after Bitcoin buyers chipped away at an area of significant ask liquidity.Related: BTC RSI bullish divergence draws 2022 comparisons as analysis weighs new price trendPreviously, Cointelegraph reported that this zone extended up to $86,000, creating friction for further price upside.Crypto liquidation history (screenshot). Source: CoinGlassCommenting, analyst David Eng described this liquidity wall as “weakening” ahead of Friday’s $6.58 billion (81,700 BTC) August options expiry event on crypto exchange Deribit.“BTC is compressed under resistance just as the derivatives structure holding it there is about to weaken. Break $82K and the path to $85K+ gets much cleaner,” he told X followers.Bitcoin options open interest by expiry date. Source: DeribitBitcoin options expiry events are when options contracts end, allowing traders to buy or sell BTC for a specific price. This can spark increased market volatility, with price gravitating toward a particular strike price.

Čítaj viac

Bitcoin faces true demand test above $83K as liquidity thickens: Glassnode

Bitcoin (BTC) has struggled to flip $80,000 into support in recent days, but bulls’ real challenge is still to come, new research says.Key points:Bitcoin long-term holders add to BTC price resistance below $86,000, Glassnode reveals.Buyer demand must overcome this area as Bitcoin struggles to advance beyond $80,000.Multiple key trend lines sit around spot price, increasing the implications of an eventual loss or reclaim.Glassnode: Key overhead liquidity structures sit between $81,000 and $86,000In the latest edition of its regular newsletter, The Week Onchain, crypto analytics platform Glassnode flagged multiple pools of coins that could be released into the market below $86,000.Of particular interest are long-term holders (LTHs) — wallets holding BTC without selling for at least six months. “Above, the first heavy structure is $83K-86K, and effectively all of it is long-term holder supply that has sat through the entire drawdown,” it wrote, predicting that reaching $83,000 would test the resolve of the LTH cohort not to sell at breakeven.BTC supply distribution by wallet cohort. Source: GlassnodeIn the same zone, new ask liquidity has appeared on exchange order books. Its owners, Glassnode notes, may not intend for their orders to be filled, instead aiming to stay above spot price should it rise further.“The re-laddered asks join a stack of independent structure pointing at one zone. The first self-custody cost-basis shelf begins at $80.8K, dealer gamma flips negative at $82.3K, the surviving liquidation shelf runs to $86K, and the patient-supply wall fills $83K-86K,” it continued. “Every overhead structure we track now sits between $81K and $86K; that band is where the recovery’s demand meets its test.”BTC spot order-book heatmap. Source: GlassnodeTrend lines converge on a narrow BTC price corridorThe area around $80,000 has also seen multiple price trend lines converge, strengthening its status as a resistance hurdle.Related: BTC RSI bullish divergence draws 2022 comparisons as analysis weighs new price trendBitcoin’s 50-week and 100-week exponential moving averages (EMAs) currently sit at $77,353 and $78,485, respectively, per data from TradingView. Additionally, Bitcoin’s 365-day volume-weighted average price (VWAP), a moving average that factors in volume, sits around $82,600.BTC/USD one-day chart with 50-week, 100-week EMA; 365-day rolling VWAP. Source: Cointelegraph/TradingViewPreviously, Cointelegraph reported on the skepticism of market participants over whether Bitcoin’s rapid rebound would endure. With regular bear market timing due to continue until the end of 2026, trader and analyst Rekt Capital stressed that price needs to hold the 50-week EMA for longer before a meaningful trend change can be considered.  

Čítaj viac

Získaj BONUS 8 € v Bitcoinoch

nakup bitcoin z karty

Registrácia Binance

Burza Binance

Aktuálne kurzy