Autor Cointelegraph By William Suberg

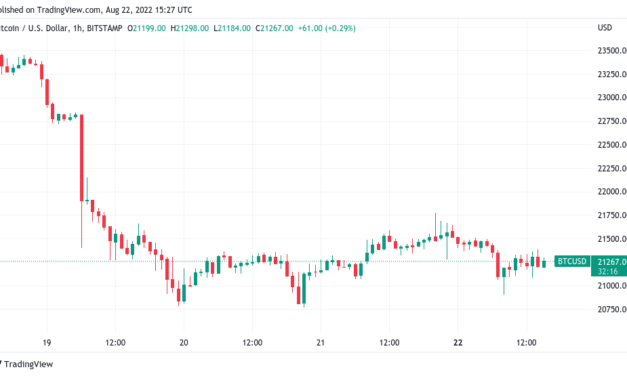
Bitcoin whales attack sellers at $22.3K as euro drops below USD parity

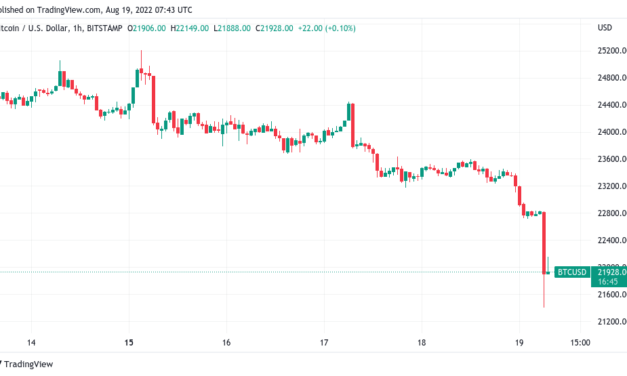
Bitcoin (BTC) drifted near $21,000 on the Aug. 22 Wall Street open as the new week began without a rebound.BTC/USD 1-hour candle chart (Bitstamp). Source: TradingViewEuropean commodity surge hammers euroData from Cointelegraph Markets Pro and TradingView showed BTC/USD failing to summon a comeback after last week’s 11.6% losses.The pair put in fresh multi-week lows under $20,800 over the weekend, subsequently staging a modest relief bounce to circle $21,200 at the time of writing.Anxiousness over European markets and the upcoming United States Federal Reserve Jackson Hole symposium contributed to a downbeat mood on risk assets. The S&P 500 lost 1.8% within two hours of opening, while the Nasdaq Composite Index shed 2.2%.In Europe, gas and electricity prices surged again over fears that supplies from Russia could be throttled harder and sooner than expected.OOPS! German benchmark electricity price jumped >25% on Monday to pass €700 per megawatt-hour for the first time. The level is about 14 times the seasonal average over the past five years. pic.twitter.com/gMQZkk7ncB— Holger Zschaepitz (@Schuldensuehner) August 22, 2022As a result, the euro fell below parity with the U.S. dollar for the first time since July.“The end of summer sees the euro back under pressure, partly because the dollar is bid and partly because the Damoclean sword hanging over the European economy isn’t going away,” Kit Juckes, a foreign exchange strategist at Societe Generale, wrote in a note quoted by Bloomberg.As Cointelegraph reported, the euro was already facing multiple headwinds, with inflation in the Eurozone still climbing in July in contrast to the United States.Below 200-week moving average “bad for bulls”Analyzing the situation, on-chain analytics resource Material Indicators nonetheless had a silver lining for traders on shorter timeframes.Related: BTC to lose $21K despite miners’ capitulation exit? 5 things to know in Bitcoin this weekThe weekend dip had still seen the market preserve lows from July, it noted, meaning that the 2022 “bear market rally,” which had taken BTC/USD above $25,000, could still make a return.Nonetheless, as long as Bitcoin traded below its critical 200-week moving average (WMA) near $23,000, the situation favored bears.Defending the LL means the Bear Market Rally could regain momentum if we get some good economic data this week, but a look at the #BTC weekly chart shows signs that any potential rally will be short lived. Losing the 200 WMA is bad for bulls. If 50 and 100 WMAs cross it’s worse. pic.twitter.com/j19Vp7SkiS— Material Indicators (@MI_Algos) August 22, 2022

A further post showed data from the order book of major exchange Binance, with some of the largest-volume whales attempting to clear a sell wall immediately above spot price.BTC/USD order book chart (Binance). Source: Material Indicators/ TwitterAdopting a similarly upbeat view on the long term, trader and analyst Rekt Capital meanwhile argued that buying BTC below $35,000 still represented a “bargain.”The area around that price level represents a zone of major exchange volume, one which will figure as a major hurdle should spot price action head higher.In 2015, #BTC bottomed 547 days before the HalvingIn 2018, $BTC bottomed 517 days before the Halving (discount March 2020 crash)If Bitcoin is going to bottom 517-547 days before the upcoming April 2024 Halving…Then the bottom will occur in Q4 this year#Crypto #Bitcoin— Rekt Capital (@rektcapital) August 22, 2022

Additional research from Rekt Capital nonetheless predicted a macro cycle low coming in Q4 if BTC/USD were to repeat the timing of previous macro lows from 2015 and 2018.The views and opinions expressed here are solely those of the author and do not necessarily reflect the views of Cointelegraph.com. Every investment and trading move involves risk, you should conduct your own research when making a decision.

Čítaj viac

BTC miners exit capitulation — 5 things to know in Bitcoin this week

Bitcoin (BTC) starts a new week fresh from a new multi-week low amid a return of highly nervous sentiment.After dipping below $21,000 over the weekend, the largest cryptocurrency is consolidating around 10% lower than a week ago, and the fear across crypto markets is clearly visible.As some call for new lows and others warns of a difficult few months ahead, there is plenty for bulls to contend with on both long and short timeframesThe United States Federal Reserve annual Jackson Hole symposium is due this week, while September is already due to form something of a showdown when it comes to inflation and associated macro price triggers.That could mean fresh volatility across risk assets both during and prior, something weary investors will no doubt not welcome after last week’s escapades on BTC/USD.Related: 3 reasons why the Bitcoin price bottom is not inAt the same time, miners are giving strong signals that the worst is over, with hash rate starting to rebound from a rare “capitulation” phase. With that in mind, Cointelegraph takes a closer look at five market moving topics pertinent to Bitcoin traders in the coming days and beyond.All eyes on Jackson HoleThe United States Federal Reserve is once again in the driving seat this week when it comes to potential macro price triggers for risk assets.Fresh from last week’s Federal Open Markets Committee (FOMC) meeting, Fed officials, together with banking figures from around the world, will meet for the annual Jackson Hole symposium on Aug. 25-27.This year’s gathering comes at a critical time for markets in the U.S. and further afield. Inflation under the Fed’s jurisdiction appears to have begun cooling, while elsewhere, the opposite story remains true.The latest U.S. inflation data is still weeks away, but that might not stop Fed Chair Jerome Powell from giving strong hints as to how the Fed will react, as well as positioning expectations regarding future economic policy.With that in mind, volatility could easily pick up both before and during the event, making Jackson Hole a key item to watch on traders’ radar.“They are so focused on doing this partly just because they screwed up last year with the whole ‘transitory’ thing, and they realize that the one thing they can do now is tighten policy, and that will slow inflation,” Kevin Cummins, chief U.S. economist at NatWest Markets in Stamford, Connecticut, told Bloomberg.With that, it remains to be seen whether the market will shift to favor another 75-basis-point funds rate hike in September or gravitate toward a lower 50-point raise.In a preview of its Jackson Hole comments circulating online, Bank of America said that it would “continue to look for 50bp rate hikes in September and November, plus an additional 25bp rate hike in December.”Rate hikes in themselves present headwinds for risk assets, and in turn provide a challenge for Bitcoin and its bid to escape strong correlation to asset classes such as U.S. equities.Fed funds rate chart (screenshot). Source: Federal ReserveBTC in for “ugly” six monthsBitcoin managed to stave off major volatility over the weekend, but still saw a new low for August as low-volume weekend trading conditions accentuated market moves.After the sudden drawdown on Aug. 19, BTC/USD spent subsequent days eking out a low in an overall consolidation pattern, this continuing at the time of writing.The low came in the form of a trip to $20,770 on Bitstamp, Bitcoin then adding $1,000 before returning to trade approximately in the middle of the two values.The weekly close at $21,500 was troublesome, marking the lowest since the week of July 18 after last week’s candle cost bulls almost $3,000 or 11.6%.Feels like $BTC preparing to head back below $20k soon.Don’t get caught off guard.— Ben Armstrong (@Bitboy_Crypto) August 21, 2022With fear of a new low palpable among commentators, others argued that conditions were not unequivocally pointing to further misery.For Cointelegraph contributor Michaël van de Poppe, BTC/USD may cap any dip at the CME futures close from Aug. 19, this lying at around $21,200. More difficult for the majority of the market, he implied, would be gains, given the overall bias for downside to enter.“Probably around CME open, we’ll be seeing markets drop to $21.2K as that’s the close of Friday, and then everything is fine,” he told Twitter followers at the weekend. “Still not inclined we’ll be seeing new lows. The overall period of accumulation and heavy correction on Friday causes panic. Pain is on the upside.”BTC/USD 1-hour candle chart (Bitstamp). Source: TradingViewZooming out, however, Brian Beamish, founder of education suite The Rational Trader, left social media with no illusions over how the rest of 2022 should shape up for Bitcoin.“Next 12-19 wks are gonna be ugly,” part of a tweet read. “Once done, the floor for this cycle ought to be in – then we shall start it all over again.”Beamish drew on experience of two prior crypto bear markets, with a comparative price action chart suggesting that the real macro low was far from in for BTC/USD.Equally confident in a recovery over a longer period, however, was analyst Matthew Hyland, who argued that traders should not lose faith.“The Bitcoin structure over the coming weeks/months shouldn’t scare you. Either a higher low, double bottom, or cycle low will be formed,” he summarized.“The end is near.”BTC/USD 1-week candle chart (Bitstamp). Source: TradingViewHash ribbons show miners out of capitulation phaseOne group of Bitcoin network participants for which an end to hard times seems demonstrably near is miners.Despite the latest price drop, on-chain data now shows that Bitcoin miners en masse have exited a “capitulation” period lasting over two months.According to the hash ribbons metric, which uses two moving averages of hash rate to determine miner participation trends, a rebound is now taking shape. The move has been long anticipated. Earlier in August, mining firm Blockware forecast the hash ribbons capitulation phase to end either this month or next.The latest shift was noted by Charles Edwards, CEO of asset manager Capriole, who compared this year’s capitulation with others in Bitcoin’s history.“The Bitcoin miner capitulation has officially ended today, making it the 3rd longest capitulation in history at 71 days,” he wrote in a Twitter thread. “This capitulation zone was longer than 2021, and just two days shorter than 2018’s where price touched $3.1K.”A look at hash rate estimates from monitoring resource MiningPoolStats shows that an uptick above 200 exahashes per second (EH/s) likely began in recent days.“Historically, Bitcoin’s miner capitulations have captured major price lows and been great buy-signals,” Edwards continued, echoing the classic Bitcoin market mantra, “price follows hash rate.” “Miner capitulations that occur late cycle (at least 2 years after halving) and after cycle tops have been the most profitable long-term signals (eg. 2012, 2015, 2018).”Bitcoin hash ribbons chart. Source: LookIntoBitcoinExchange balances hit new 4-year lowsPrice struggles on short timeframes have proven to be something of a non-issue for buyers this time around.Behind the scenes, investors, instead of fleeing BTC exposure, have been piling into the market at a noticeable pace in recent days.According to data from on-chain analytics platform CryptoQuant, from Aug. 18 available Bitcoin on 21 major exchanges dropped from 2,342,662 BTC to 2,309,727 BTC on Aug. 22.In four days, exchange users thus removed over 30,000 BTC from their accounts.Bitcoin exchange reserve chart. Source: CryptoQuantFellow data firm Glassnode meanwhile added that the current combined balance across the exchanges it monitors hit a fresh four-year low on Aug. 22.For comparison, in August 2018, BTC/USD was climbing towards $7,000, but still several months out from its bear market bottom of $3,100.Bitcoin exchange balance chart. Source: Glassnode/ TwitterSentiment gauge drops 40% in a weekCompared to before the price drop, meanwhile, sentiment is not what it was on crypto.Related: Here’s 5 cryptocurrencies with bullish setups that are on the verge of a breakoutEven as exchanges see an acceleration in BTC leaving their books, the overall picture is now firmly one of “fear” when it comes to Bitcoin and altcoin investors.According to the Crypto Fear & Greed Index, which uses a basket of factors to give a normalized score for market sentiment, “extreme fear” is just a step away.At 29/100, the Index is 4 points off a return to its extreme fear bracket, having hit 27/100 over the weekend.The latter represents a drop of 40% in a single week — seven days prior, the Index was at 45/100, recording its most optimistic levels since April.Crypto Fear & Greed Index (screenshot). Source: Alternative.meThe views and opinions expressed here are solely those of the author and do not necessarily reflect the views of Cointelegraph.com. Every investment and trading move involves risk, you should conduct your own research when making a decision.

Čítaj viac

Weak address growth points to Bitcoin price failing to sustain $25K

Bitcoin (BTC) is staging a repeat of price action from May with its latest drop, the latest data shows.As the dust settles on a 6% comedown for BTC/USD, analysis argues that its trip to $25,000 was never meant to last.Realized price comes back to haunt the BTC chartAfter taking some by surprise with its magnitude, the latest snap losses for BTC price action are still playing out.After falling from $23,800 to as low as $21,400 in a single hour, the largest cryptocurrency is now attempting to establish support near its realized price. At just below $22,000, realized price refers to the sum total at which the entire BTC supply last moved. The setup will be more than familiar to many market participants, as realized price formed an initial support line during Bitcoin’s descent in May, immediately following the Terra LUNA blowout.Bitcoin realized price chart. Source: GlassnodeWith history rhyming — at least on the chart — it remains to be seen whether other recent points of interest will continue to play their role. Among them is the 200-week moving average (MA), a hard-won support level in July now seemingly lost in one fell swoop.The 50-day MA, cleared in late July, is now also back above spot price at $22,260.#Bitcoin made a nice relief rally in the past 2 weeks, but the bearish #RSI divergence has always been in the background.$22k was June high and now the #50DMA, which seems to hold as support so farIf #BTC breaks below $22k again, I think it’s likely we see the $18k low again. pic.twitter.com/0xwArqUcUN— venturef◎undΞr (@venturefounder) August 19, 2022Going into the Wall Street open, United States equities futures showed that more downside was to come, implying more pressure on crypto markets.Active addresses fail to support breakoutA look at network activity growth during the August run to over $25,000 meanwhile produced bearish conclusions for analyst Philip Swift.Related: Bitcoin ‘liveliness’ lowest since 2021 amid new 5-year BTC hodl recordIn a fresh tweet on the day, the creator of analytics resource Look Into Bitcoin noted that address growth had not matched similar price appreciation phases this time around.”AASI (Active Address Sentiment Indicator) has been indicating that the current price move has not been supported by a sufficient increase in active addresses on the Bitcoin network,” he summarized.”Experienced local highs when this has happened previously.”Bitcoin AASI (Active Address Sentiment Indicator) annotated chart. Source: Philip Swift/ TwitterThis comes despite the total number of Bitcoin addresses ever created passing 1 billion this week, according to data from on-chain analytics firm Glassnode.The views and opinions expressed here are solely those of the author and do not necessarily reflect the views of Cointelegraph.com. Every investment and trading move involves risk, you should conduct your own research when making a decision.

Čítaj viac

Bitcoin 'very bearish' below $22.5K says trader as BTC price dives 6%

Bitcoin (BTC) fell rapidly on Aug. 19 as the culmination of a week’s sideways action ended in disappointment for bulls.BTC/USD 1-hour candle chart (Bitstamp). Source: TradingViewNew lows “just a matter of timeData from Cointelegraph Markets Pro and TradingView followed BTC/USD as it dropped 6.2% in a single hourly candle.Reacting, traders hoped that a rebound could allow for consolidation higher than current spot price levels, which were under $22,000 at the time of writing.“Well, hopefully that was liquidity seeking, otherwise it’s over,” a gloomy Crypto Chase told Twitter followers.Fellow account Il Capo of Crypto, who had long forecast a return to lower levels, was resigned to new lows being “just a matter of time.”Consolidation under $22,500, he warned in his latest update, would be “very bearish.”$BTCSecond option playing out. Any test of 23500 as resistance is a good sell opportunity.Consolidation below 22500 (clean break + use the level as resistance) would be very bearish = 21k or lowerNew lows are just a matter of time. https://t.co/MzxrDCZuiZ pic.twitter.com/I5PatYduNW— il Capo Of Crypto (@CryptoCapo_) August 19, 2022Prior to the drop, meanwhile, analyst Venturefounder said that any price below $23,000 would be a “decent price to buy in the long term,” adding that it was unlikely that Bitcoin had exited its bear market so far.Relative strength index (RSI) being still near all-time lows spoke to the extent to which BTC/USD was oversold, he argued.There were nonetheless signs of buying emerging below key bear market support levels including the 200-week moving average and key whale entry levels.BTC/USD 1-week candle chart (Bitstamp) with 200-week moving average. Source: TradingViewAccording to data from on-chain analytics firm CryptoQuant, exchange outflows for the first few hours of Aug. 19 already totaled 21,500 BTC.Bitcoin exchange outflows chart. Source: CryptoQuantEther retraces August gainsOn altcoins, the knock-on impact of Bitcoin’s return to three-week lows was predictably keenly felt.Related: Options data shows Bitcoin’s short-term uptrend is at risk if BTC falls below $23KEther (ETH), the largest altcoin by market cap, was down 5.2% on the day at the time of writing, trading near $1,750.ETH/USD 1-day candle chart (Binance). Source: TradingViewElsewhere, other major tokens lost in excess of 11%, with Dogecoin (DOGE) the worst performer in the top ten, down 13.6%.“Bear bias now unless $1790 is reclaimed/flipped to support,” Crypto Chase added about ETH in part of a separate tweet.The views and opinions expressed here are solely those of the author and do not necessarily reflect the views of Cointelegraph.com. Every investment and trading move involves risk, you should conduct your own research when making a decision.

Čítaj viac

Bitcoin 'liveliness' lowest since 2021 amid new 5-year BTC hodl record

Bitcoin (BTC) long-term holders are knuckling down as a record portion of the BTC supply stays dormant for years.Data from on-chain analytics firm Glassnode confirms that the percentage of the supply now stationary for at least five years is higher than ever.2017 BTC buyers not this year’s sellersBitcoin has recovered almost 40% from its macro lows of $17,600 just two months ago, but for the cryptocurrency’s diamond hands, it has been a non-event.Those who purchased BTC in 2017 or earlier continue to hodl their stake, and the trend points to more, not less, hodling in recent times.Not content with the reversion above the 2017 highs of $20,000, long-term holders remain committed to not selling, the Glassnode data shows.On Aug. 18, the percentage of the BTC supply staying untouched in its wallet for at least five years reached a new all-time high of 24.351%. Almost one quarter of the 19.12 million BTC circulating supply has thus been off the market since 2017 or earlier.Bitcoin 5-year hodled coins annotated chart. Source: Glassnode/ TwitterWhile recent months have been marked by major sell-offs, particularly among institutional investors, it would thus appear that hodlers really are unfazed by current narratives.Previously, Cointelegraph reported on Bitcoin’s HODL Waves metric showing a similar story for slightly “younger” coins hodled for one year or more.Not so liveA similar story, meanwhile, comes from Bitcoin’s “liveliness” — a calculation of hodler behavior that reached its lowest since the start of 2021 this week. Related: Bitcoin price heads above $23.5K after highest EU inflation in historyLiveliness, a term coined by Bitcoin developer Tamas Blummer, is plotted as a score between 0 and 1, which increases or decreases, depending on how much hodler selling is occurring. As Glassnode neatly summarizes, it is “the ratio of the sum of Coin Days Destroyed and the sum of all coin days ever created.” Coin Days Destroyed refers to the resetting of the counter when each Bitcoin moves, the “days” referring to days spent dormant, not moving around the network.“It is apparent that Liveliness increases (and HODL decreases) during time periods of Bitcoin price increases and investors accumulate to HODL during periods of range bound prices,” Blummer explained in a dedicated introduction to the Liveliness metric published in late 2018.Now at 19-month lows, Liveliness points to increasing desire to hodl across the Bitcoin network in general.Bitcoin Liveliness chart. Source: GlassnodeThe views and opinions expressed here are solely those of the author and do not necessarily reflect the views of Cointelegraph.com. Every investment and trading move involves risk, you should conduct your own research when making a decision.

Čítaj viac

Získaj BONUS 8 € v Bitcoinoch

nakup bitcoin z karty

Registrácia Binance

Burza Binance

Aktuálne kurzy