Autor Cointelegraph By William Suberg

Bitcoin sits at range high as realized price sparks BTC 'macro signal'

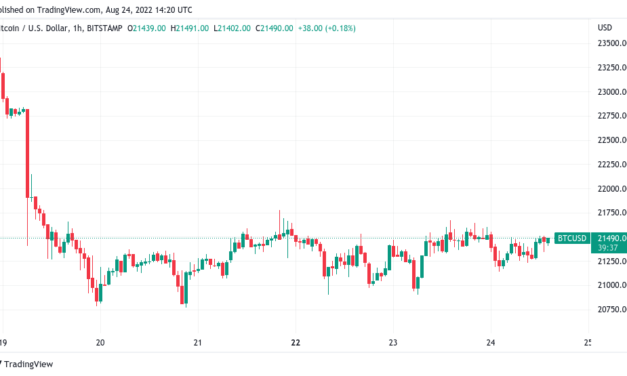
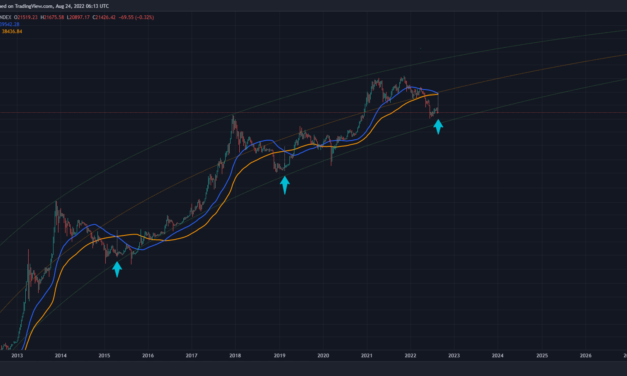
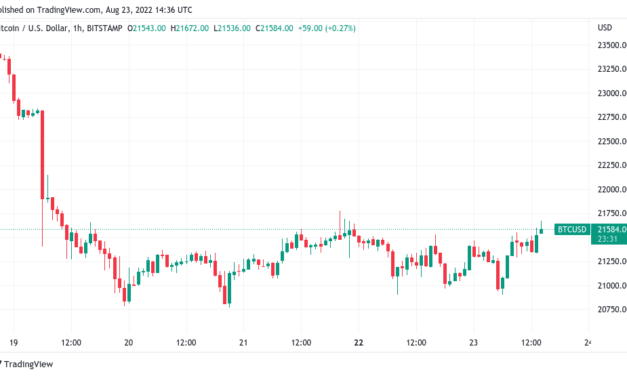
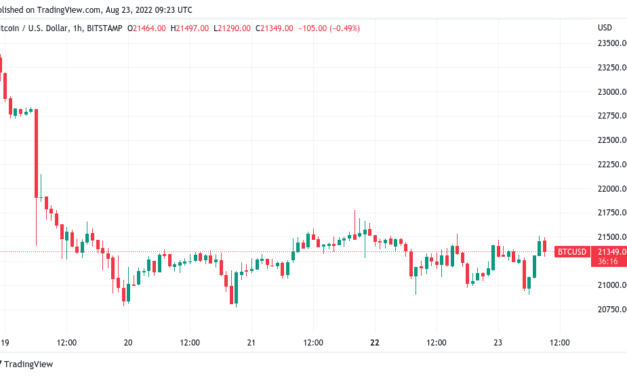
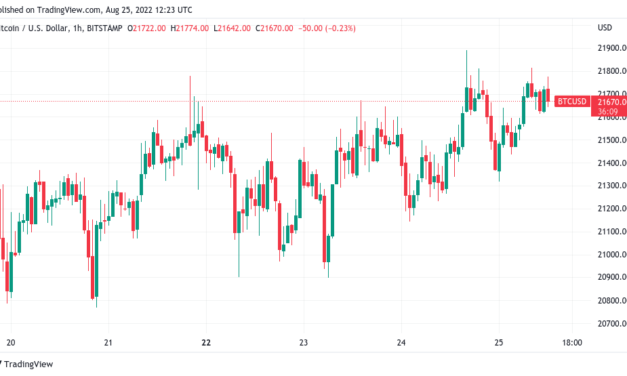
Bitcoin (BTC) inched closer to $22,000 on Aug. 25 as realized price provided the next major hurdle for bulls.BTC/USD 1-hour candle chart (Bitstamp). Source: TradingViewRealized price inspires confidenceData from Cointelegraph Markets Pro and TradingView showed BTC/USD grinding higher overnight to come face to face with $21,700.That level, coinciding with realized price, had marked the key flip zone to target for bullish continuation the day prior, but at the time of writing, Bitcoin had yet to push beyond it or convincingly turn it to support.“At realized price again,” analyst Root summarized alongside a chart showing interaction between realized price and spot price during prior bear markets.2022 had so far seen notably less time below realized price than either 2018 or 2014, Root noted.A subsequent post contained a more hopeful forecast, with the 90-day change in realized price now hitting levels historically preceding extended price upside. This, Root added, now constituted a “macro signal.”BTC/USD realized price chart. Source: GlassnodeAs Cointelegraph reported, several long-term trendlines involving the daily BTC/USD had already flashed bullish, leading some to believe that significant further losses may not materialize.Aurelien Ohayon, CEO of software firm XOR Strategy, additionally cited the relationship between spot and its 200-day simple moving average (SMA) on the day as a firm bull signal.As with Root’s realized price findings, the depth between the 200 SMA and spot was now echoing behavior at the 2018 and 2014 macro bottoms, he explained alongside a comparative chart from XOR Strategy.Ohayon had long called for a major bull run to begin for Bitcoin, a perspective which garnered him significant criticism on social media in recent months.BTC/USD annotated chart with 200 SMA. Source: Aurelien Ohayon/ TwitterMarkets gear up for Fed Jackson HolecommentsReturning to spot price in the short term, meanwhile, trader and analyst Il Capo of Crypto stuck by a prediction of $22,000 being regained before a significant downturn entered.Related: Bitcoin addresses in loss hit 1-month high as BTC price retests $21K$BTC pic.twitter.com/1sgiI3DIy0— il Capo Of Crypto (@CryptoCapo_) August 24, 2022Cointelegraph contributor Michaël van de Poppe, who previously had hoped that $21,500 would hold as support, now cautioned that upcoming macro events would be “crucial” for BTC.These came in the form of the United States Federal Reserve’s Jackson Hole annual symposium and associated comments from Chair Jerome Powell due Aug. 26.In addition, Personal Consumption Expenditures Price Index (PCE) data and flip-flopping around parity between the U.S. dollar and the euro were items to watch, he told Twitter followers on the day. The U.S. dollar index (DXY), enjoying a rebound the day prior, reversed its gains to put in a new local low.U.S. dollar index (DXY) 1-hour candle chart. Source: TradingViewThe views and opinions expressed here are solely those of the author and do not necessarily reflect the views of Cointelegraph.com. Every investment and trading move involves risk, you should conduct your own research when making a decision.

Čítaj viac

Bitcoin breakout possible as whales close in on sideways BTC price

Bitcoin (BTC) stayed strictly rangebound on Aug. 24 as buyers and sellers attempted to spark a breakout.BTC/USD 1-hour candle chart (Bitstamp). Source: TradingViewSpot price squeeze on the cardsData from Cointelegraph Markets Pro and TradingView showed BTC/USD hovering near $21,500 at the Wall Street open. The pair had seen little action in the 24 hours prior, entering the fifth day of sideways movement within an increasingly tight range.Data from the order book of major exchange Binance uploaded to social media by on-chain monitoring resource Material Indicators hinted that the status quo was frustrating exchange users, including whales. At the time of writing, bids were inching higher towards spot price, while seller interest was building at $21,600.The result could be volatility as liquidity reduces the range in which BTC/USD floats — either to the upside or downside, depending on whether buyers or seller win out.BTC/USD buy and sell levels (Binance). Source: Material Indicators/ Twitter“Really not much has changed since yesterday, I am still looking for that one leg down to take out the swing lows, followed by a relief wave,” popular trader Crypto Tony meanwhile told Twitter followers in an update on the day. Fellow trader Crypto Ed meanwhile said that he was “not convinced” about the strength of the bounce from the weekend lows around $20,800.In his latest YouTube video, he highlighted potential market entry levels between those lows and the current spot with an eye to seeing a retest. Before that, he added, Bitcoin could revisit the range highs at just above $22,000.Dollar creeps back towards two-decade peakStocks meanwhile added to the sense that a risk asset resurgence could characterize the day. Related: Bitcoin bulls may win big as two key moving averages prepare to crossThe S&P 500 and Nasdaq Composite Index both headed higher at the Wall Street open, leading Cointelegraph contributor Michaël van de Poppe to eye knock-on effects for BTC/USD.#Nasdaq bouncing upwards, while #Bitcoin looks primed for a break above $21.5K.— Michaël van de Poppe (@CryptoMichNL) August 24, 2022Popular Twitter account Game of Trades contributed a longer-term bullish view for U.S. equities, noting that 90% of S&P 500 stocks were now above their 50-day moving average.”This reading has presented investors with jaw dropping returns in a 6–12 month time frame. Load up,” he advised followers.A possible headwind came in the form of the U.S. dollar. After dropping swiftly on the back of U.S. manufacturing data, the U.S. dollar index (DXY) canceled out its losses on the day, heading back toward new twenty-year highs.U.S. dollar index (DXY) 1-hour candle chart. Source: TradingViewThe views and opinions expressed here are solely those of the author and do not necessarily reflect the views of Cointelegraph.com. Every investment and trading move involves risk, you should conduct your own research when making a decision.

Čítaj viac

Bitcoin bulls may win big as two key moving averages prepare to cross

Bitcoin (BTC) lost a key bear market trendline last week as it shed almost 12%, but other chart data offers a silver lining for bulls.As noted by popular Twitter user Dave the wave on Aug. 24, long-term moving averages (MAs) are about to repeat classic bullish behavior.Analyst: Bulls could be about to “do well”BTC/USD disappointed over the weekend as it put in lows not seen since the end of July. Since then, $21,000 has offered only weak support, and fears abound that new lows are coming.One of the casualties of the downturn was the 200-week MA, data from Cointelegraph Markets Pro and TradingView shows, a level which had flipped from resistance to support the month prior. Now back overhead and unchallenged by rebounds this week, the 200-week MA offers a verdict on the current lack of strength in Bitcoin.“The amount of FOMO we saw on CT in the past 2 weeks during the $25k rally is unprecedented. This bulltrap almost has to play out,” analyst Venturefounder summarized after the 200-week MA failed as support.Observing the behavior of the 50-week and 100-week MAs, however, suggests that all might not be lost.In his Twitter thread, Dave the wave showed that the former is about to cross over the latter — and in the past, this has been followed by sustained price growth.“Bitcoin 1 year moving average now crossing the 2 year moving average as per the corrective phase after a speculative run-up,” he wrote in accompanying comments. “Looking good from a technical perspective…. no matter the sentiment. Those buying these levels have previously done well.”BTC/USD annotated chart. Source: Dave the wave/ TwitterHe added that five months prior, the same pair of MAs had correctly assessed the incoming market downtrend which saw BTC/USD hit a macro bottom of $17,600 in June.BTC/USD 1-week candle chart (Bitstamp) with 50, 100, 200-week MA. Source: TradingViewFollowing on from Pi Cycle bottomAs Cointelegraph reported, there is more than one moving average-based chart mechanism flashing a bottom signal this summer.Related: Here’s why holding $20.8K will be critical in this week’s $1B Bitcoin options expiryThe classic Pi Cycle Top indicator, which has caught macro bottoms throughout Bitcoin’s history, was already turning green in July, lending weight to the idea that June’s $17,600 really was a multi-year floor.In an update on Pi this week, however, commentator Miles Johal acknowledged that bulls needed to clear higher levels to keep the status quo favorable. Big expansion on the pi cycle top MA’s.Getting back above the orange line is crucial for the bulls.$BTC pic.twitter.com/REiSHrLSqG— Miles J Creative (@JohalMiles) August 23, 2022The views and opinions expressed here are solely those of the author and do not necessarily reflect the views of Cointelegraph.com. Every investment and trading move involves risk, you should conduct your own research when making a decision.

Čítaj viac

Bitcoin price eyes $22K as US PMI data hits lowest since May 2020

Bitcoin (BTC) headed for multi-day highs after the Aug. 23 Wall Street open as United States economic data tripped up the dollar.BTC/USD 1-hour candle chart (Bitstamp). Source: TradingViewDollar suffers as data shows incomes “squeezed”Data from Cointelegraph Markets Pro and TradingView followed BTC/USD as it eyed $21,700 at the time of writing, near resistance in place since last week’s near-12% drop.The pair gained momentum as the U.S. Purchasing Managers Index (PMI) prints for August showed a drop versus the month prior, hitting the lowest levels since May 2020 at the height of the first round of COVID-19 lockdowns. “The S&P Global Flash US Services Business Activity Index posted at 44.1 in August, down from 47.3 in July, to indicate a further reduction in overall services activity,” a press release from curator S&P Global stated. “The decrease in business activity was sharp overall and the fastest since May 2020. Service providers noted that hikes in interest rates and inflation dampened customer spending as disposable incomes were squeezed.”Yikes! The US Composite #PMI just fell to 45.0! That is near #recession levels. The Services PMI is down to 44.1, where an increase to 49.8 was expected. pic.twitter.com/GwSKfnOXS3— jeroen blokland (@jsblokland) August 23, 2022The implied slowdown in demand caused an immediate knock-on effect for dollar strength, with the U.S. dollar index (DXY) falling from new twenty-year highs. U.S. dollar index (DXY) 1-hour candle chart. Source: TradingViewThe inversely-correlated DXY had conversely gained rapidly in the days prior, this coinciding with U.S. stocks facing resistance and Bitcoin seeing multiple trips below $21,000.“The Aug. PMI Composite Index fell to 45 from 47.7 in July. It was expected to rise to 49.2,” gold proponent Peter Schiff reacted.“The Services PMI tanked to 44.1, the lowest since May 2020 and Mfg. sank to 51.3, the lowest since July 2020. The U.S. PMI is weaker than any PMI in Europe or Asia.”S&P Global Flash US PMI Composite Output Index chart. Source: S&P Global/ TwitterThe S&P 500 and Nasdaq Composite Index were up a modest 0.25% and 0.45% at the time of writing, respectivelyBTC bulls face $21,700 challengeAnalyzing what could be next for risk assets, commentators hoped for a rally in stocks on the back of a declining dollar.Related: Bitcoin addresses in loss hit 1-month high as BTC price retests $21KPopular Twitter account Game of Trades called the S&P 500 “extremely oversold in the short-term” based on relative strength index (RSI) data.“Watch out for all the potential bullish RSI divergences it has picked up along the way,” part of a fresh update read.On Bitcoin, optimism from some likewise focused on a return to the range highs since June, with a “clean break” above $25,000 being the deal breaker for $28,000 or more to appear.#Bitcoin / $BTCAre you ready? pic.twitter.com/dZ0NI1JleS— K A L E O (@CryptoKaleo) August 23, 2022

For on-chain analytics resource Material Indicators, meanwhile, it was $21,700 that needed to be cracked as a first step.”If we don’t see more BTC bids coming in above $21k, the downside illiquidity (dark areas) will be exploited,” it warned alongside a chart of support and resistance levels on the Binance order book.The views and opinions expressed here are solely those of the author and do not necessarily reflect the views of Cointelegraph.com. Every investment and trading move involves risk, you should conduct your own research when making a decision.

Čítaj viac

Bitcoin addresses in loss hit 1-month high as BTC price retests $21K

Bitcoin (BTC) hodlers are feeling the squeeze this week as repeated tests of lower levels spark increasing losses.Data from on-chain analytics firm Glassnode shows more wallets are in the red as of Aug. 23 than at any time in the past month.Over 17.5 million wallets in the redBTC/USD has seen five trips below $21,000 since the end of Aug. 19, data from Cointelegraph Markets Pro and TradingView shows, and the quest for support is already making plenty of traders nervous.BTC/USD 1-hour candle chart (Bitstamp). Source: TradingViewMeanwhile, those who bought in recent weeks are underwater to varying degrees, as Bitcoin is at its lowest since the last week of July.The extent to which investors added or created positions on the way to this month’s $25,200 highs is now becoming clearer — more BTC addresses are at an overall loss than at any time since July 23.The increase in underwater addresses has been particularly pronounced since last week’s sudden price drop. At the time of writing, the seven-day moving average (MA) of wallets in the red sits at more than 17.5 million — an increase of 1.5 million over several days.Bitcoin addresses in loss chart (7-day MA). Source: Glassnode/ TwitterAdditional statistics from monitoring resource Coinglass covering liquidations of positions on derivatives exchanges, meanwhile, point to the vast majority of pain being inflicted on Aug. 1, with subsequent price movements across the $21,000 mark being of little importance.Aug. 19 sealed a total of $209.5 million in long position liquidations on exchanges — the most since June 13 — along with $30 million of short positions.BTC/USD liquidations chart. Source: CoinglassDollar rises to pressure outlookTurning to the immediate outlook, few were prepared to bet on a major renaissance in crypto markets.Related: BTC to lose $21K despite miners’ capitulation exit? 5 things to know in Bitcoin this weekPopular trader and analyst Rekt Capital highlighted Bitcoin’s first close below the key 200-week MA since July, and others noted risk assets faced resistance while the United States dollar broke higher.#SPX500 lost the 50-Week Moving Average last week, and on the first day of this week has lost the 100-Week Moving Average and the micro trend line. What do you think comes next? Trend Precognition has some clues highlighted in red. pic.twitter.com/W7wUkt4UBY— Keith Alan (@KAProductions) August 22, 2022The U.S. dollar index (DXY), with which Bitcoin has shown inverse correlation to varying degrees in recent years, hit its highest since July 14, passing 109 and up 4.4% from its August lows.U.S. dollar index (DXY) 1-day candle chart. Source: TradingViewThe views and opinions expressed here are solely those of the author and do not necessarily reflect the views of Cointelegraph.com. Every investment and trading move involves risk, you should conduct your own research when making a decision.

Čítaj viac

Získaj BONUS 8 € v Bitcoinoch

nakup bitcoin z karty

Registrácia Binance

Burza Binance

Aktuálne kurzy