Autor Cointelegraph By William Suberg

US dollar hits new 20-year high — 5 things to know in Bitcoin this week

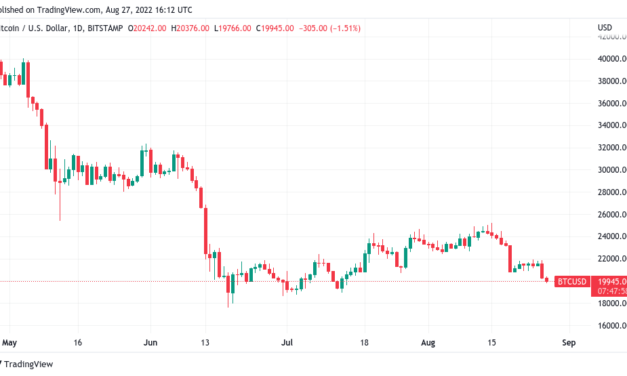
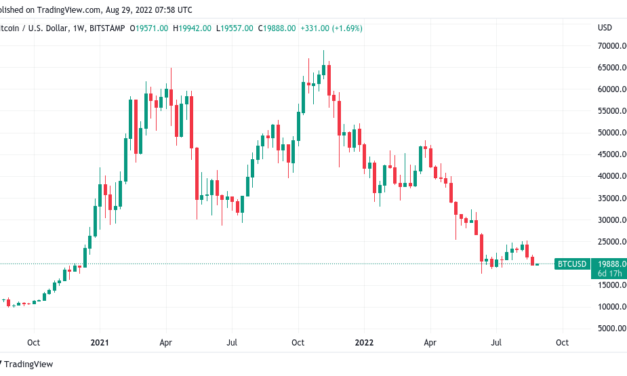
Bitcoin (BTC) heads into the first week of September on a rocky road downhill after United States markets’ Jackson Hole rout.After the U.S. Federal Reserve reinforced hawkish comments on the inflation outlook, risk assets sold off across the board, and crypto is still reeling from the aftermath.A fairly nonvolatile weekend did little to improve the mood, and BTC price action has returned to focus on areas below $20,000.In so doing, multiple weeks of upside have effectively disappeared, and in turn, traders and analysts expect a retest of the macro lows seen in June this year.While all is now quiet regarding the Fed until the September rate hike decision, there is still plenty of room for upset as geopolitical uncertainty and inflation persist, the latter still increasing in Europe. However, as last week, Bitcoin appears fundamentally resilient as a network, with on-chain data telling a different story to price charts.Cointelegraph takes a look at five factors to consider when wondering where BTC/USD may head in the coming days.Spot price triggers $18,000 targetData from Cointelegraph Markets Pro and TradingView confirms no surprises for guessing what happened to BTC/USD into the latest weekly close.After a comparatively uneventful weekend trading period, the pair sold off considerably at the end of Aug. 28, resulting in the lowest weekly close since early July.A $2,000 red weekly candle thus sealed a miserable August for bulls, this following an initial $3,000 of losses the week prior.BTC/USD 1-week candle chart (Bitstamp). Source: TradingViewWith days until the monthly candle completes, the mood among analysts was understandably less than optimistic in the short term.“Hoping we can see a recovery this week but the way equities closed Friday doesn’t look so hot,” trader Josh Rager summarized to Twitter followers in part of a weekend update.Popular trading account Il Capo of Crypto nonetheless eyed the possibility for a brief squeeze to the upside before continuation of the downtrend.Noting negative funding rates implying derivatives market bias towards straight losses, he predicted that $23,000 could reappear first.“Much more people expecting 19k than those expecting 23k. Funding says it all. Also, there’s a lot of juicy liquidity above 21k. Squeeze those shorts,” he tweeted.Responding, trader Mark Cullen noted that traders were “adding more BTC shorts in the area between 20.1 and 20.3k.” “There is a nice inefficiency above there and another at around 20.9-21.1k. If it can break up it’s likely to be a fast move higher,” he added.Amid various calls for $17,000 or lower, technical analyst Gert van Lagen gave a $17,500 floor target for the daily chart.$BTC[1D]White C-wave scenario I showed last Monday played out like clockwork. Double test of green box on daily.C-wave looks final, time to bounce Invalidation: 17.5k#BullMarket #Bitcoin https://t.co/acs6bFEl66 pic.twitter.com/DkhXmp3GDc— Gert van Lagen (@GertvanLagen) August 28, 2022In a slightly less cautious outlook, TMV Crypto meanwhile flagged $18,400 as a high-timeframe area of interest.Traders prepare for further U.S. stocks declinesLast week’s bombshell of a speech by Fed Chair Jerome Powell sent shockwaves through risk assets worldwide.According to one tally, Powell’s eight-minute address wiped over $2 trillion from global stocks, including $1.25 trillion in the U.S. alone.#Fed’s Powell has destroyed ~$2tn in global stock market cap with his 8-minute “Until the Job Is Done” Jackson Hole speech, makes $4.2bn loss per second. pic.twitter.com/05YE5yG693— Holger Zschaepitz (@Schuldensuehner) August 28, 2022

“At some point, as the stance of monetary policy tightens further, it likely will become appropriate to slow the pace of increases,” Powell said. “Restoring price stability will likely require maintaining a restrictive policy stance for some time. The historical record cautions strongly against prematurely loosening policy.”Bitcoin and altcoins alike felt the squeeze, with Aug. 29 set to be something of a make or break Wall Street trading session.Speaking on Bloomberg Television, Paul Christopher, head of global market strategy at Wells Fargo Investment Institute, warned that U.S. stocks would fall further, with the S&P 500 due for a trip below 4,000 next.On the flipside, crypto-focused Game of Trades argued that peak inflation from July had already signaled a macro low in stocks.Once again the peak in inflation has called the bottom is stocks for now.Let’s watch to see if this continues to play out. pic.twitter.com/HE2KfrjMVL— Game of Trades (@GameofTrades_) August 28, 2022

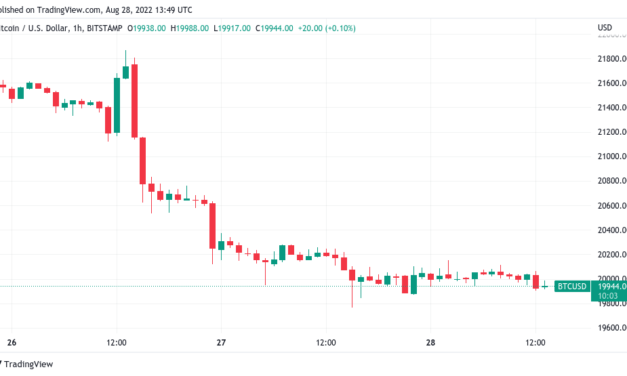
Flagging cumulative data for the S&P, Game of Trades continued to argue that all was in fact not as bad as it seemed.“SP500 is showing A LOT of underlying strength,” accompanying comments from the weekend read. “The cumulative advance/decline line speaks to the underlying strength in the market, which many investors are failing to notice. Despite the SP500 being double digits away from the ATH, the indicator has entered new highs.”Even a drop to 3,900, another insight stated, would preserve a “bullish formation.”U.S. dollar targets September 2002 levelsA key accompaniment to upheaval in equities remains the strength of the U.S. dollar this week.A classic inversely correlated relationship, dollar performance versus risk assets is in the spotlight thanks to the U.S. dollar index (DXY) making new twenty-year highs this week.At the time of writing on Aug. 29, those highs are still playing out, DXY having hit 109.47 in its highest spike since September 2002.U.S. dollar index (DXY) 1-hour candle chart. Source: TradingView“If the dollar keeps going, it’s going to really break things. It has literally done parabolic,” Raoul Pal, founder of Global Macro Investor, responded, warning that there was “literally nothing until 120” in terms of resistance on the DXY chart.Cointelegraph contributor Michaël van de Poppe was equally alarmed, including DXY as a factor creating a “moment of truth for the entire crypto market.”Moment of truth coming up for the entire #crypto market.Facing another test of the 200-Week MA, which ultimately could lead to a HL and retest. Sentiment is on an ultimate low.$DXY needs to reverse or top out soon, though. pic.twitter.com/qlvutKi9QG— Michaël van de Poppe (@CryptoMichNL) August 29, 2022

The dollar’s surge likewise spelled pain for major fiat currencies, notably the euro, which swiftly headed back below parity with the greenback into Aug. 29.The European Central Bank, along with the Bank of Japan, has been reluctant to instigate the same bill of rate hikes as the Fed, leading to inflation continuing to climb over the summer.EUR/USD 1-hour candle chart. Source: TradingViewMVRV-Z score retreats into the greenHeading back into its “buy” zone is a classic Bitcoin strength indicator which has caught macro bottoms throughout Bitcoin’s lifespan.The MVRV-Z score indicator, which began to prepare analysts for a price bottom in July, is now falling again, hitting its lowest in a month.Bitcoin MVRV-Z score chart. Source: LookIntoBitcoinMVRV-Z uses market cap and realized price to determine how close BTC/USD is to its “fair value.”In July, it printed a potential BTC price floor of $15,600, while briefly exiting its buy zone before returning during the second half of August.As Cointelegraph reported, realized price — the average at which the BTC supply last moved — now sits at around $21,600, data from on-chain analytics firm Glassnode confirms.Bitcoin realized price chart. Source: Glassnode”Extreme fear” makes a comebackPerhaps unsurprisingly, Bitcoin heading back below $20,000 has caused its key market sentiment gauge to return to its most bearish category.Related: Bitcoin mining difficulty set for 8-month record gains despite BTC price dipAs of Aug. 29, the Crypto Fear & Greed Index is back in “extreme fear” territory at 24/100.Having reached as high as 47/100 during the relief rally, the Index now resides in the bracket which has characterized several months of 2022.This year even saw its longest-ever spell in “extreme fear,” along with lows of just 6/100 as an overall market sentiment score.Crypto Fear & Greed Index (screenshot). Source: Alternative.meAnalyzing the mood across investors, however, on-chain research firm Santiment noted that large-volume investors were adding to their holdings rather than divesting.“As Bitcoin has danced around $20,000 this weekend, a positive sign is the growth in the amount of key whale addresses,” it commented on a chart for August. “There’s a correlation between $BTC’s price & the amount of addresses holding 100 to 10k $BTC, and they’re up 103 in the past 30 days.”Nonetheless, others felt that there was still some way to go before a genuine macro turning point was reached in crypto demand.“The true generational entry is not just when people are afraid to buy, but when they’re too broke to buy,” on-chain analytics firm Material Indicators acknowledged. “Not there yet.”Bitcoin whale address growth annotated chart. Source: Santiment/ TwitterThe views and opinions expressed here are solely those of the author and do not necessarily reflect the views of Cointelegraph.com. Every investment and trading move involves risk, you should conduct your own research when making a decision.

Čítaj viac

Bitcoin threatens 20-month low monthly close with BTC price under $20K

Bitcoin (BTC) looked set to equal its lowest monthly close since 2020 on Aug. 28 as bulls failed to take control.BTC/USD 1-hour candle chart (Bitstamp). Source: TradingViewOdds stack up for a deeper dive below $20,00Data from Cointelegraph Markets Pro and TradingView showed BTC/USD criss-crossing $20,000 with hours until the weekly candle completed.The pair had been unable to make up for lost ground over the weekend, and just days from the end of the month, even $20,000 appeared vulnerable as support.At the time of writing, Bitcoin traded near $19,900 — below June’s closing price.BTC/USD 1-month candle chart (Bitstamp). Source: TradingView“It didn’t matter what kind of lines or squiggles you had on your charts,” on-chain monitoring resource Material Indicators summarized over the weekend alongside bid and ask data from the Binance order book. “After JPow punched the market in the face on Friday, BTC lost the trend coming off the June low. Now the question is whether that local low holds. Currently not seeing enough bid liquidity to get excited.”BTC/USD buy and sell levels chart (Binance). Source: Material Indicators/ TwitterMaterial Indicators was referring to the Aug. 26 risk asset cascade which resulted from hawkish comments by Jerome Powell, Chair of the United States Federal Reserve. With no sign of a desire to curtail or reverse key rate hikes in future, Powell’s speech at the annual Jackson Hole economic symposium sent shockwaves through equities markets. U.S. stocks lost a combined $1.25 trillion on the day.Bitcoin suffered in step, and while some potential buyers came forward with plans to buy below $20,000, consensus favored deeper downside going forward.Popular trader Anbessa was eyeing two scenarios on the day, one involving a support/ resistance flip to continue higher and another targeting a breakdown to $16,000-$17,000.“We need to see a lot before this becomes bullish,” fellow trader Crypto Tony added in part of his latest update.BTC supply held at a loss nears 50%For analytics account On-Chain College, meanwhile, a sign of encouragement came from on-chain data covering hodler profitability.Related: Bitcoin risks worst August since 2015 as hodlers brace for ‘Septembear’The latest price drop decreased the proportion of the BTC supply in profit, and that proportion was now approaching levels only seen in previous macro market bottoms.“I’ve been waiting all bear market for the Bitcoin Percent of Supply in Profit to drop below 50%,” On-Chain College commented.“In June, it bounced just above at 50.28%. Currently, it’s at 51.76%. This metric dropped below 50% in every prior bear market + March 2020.”Bitcoin percent supply in profit chart. Source: On-Chain College/ TwitterAs Cointelegraph reported at the weekend, hodlers continue to cold-store the BTC supply with increasing conviction.The views and opinions expressed here are solely those of the author and do not necessarily reflect the views of Cointelegraph.com. Every investment and trading move involves risk, you should conduct your own research when making a decision.

Čítaj viac

Bitcoin risks worst August since 2015 as hodlers brace for 'Septembear'

BItcoin (BTC) is on track to see its worst August performance since the 2015 bear market — and next month may be even worse.Data from on-chain analytics resource Coinglass shows that BTC/USD has not had an August this bad for seven years.September means average 5.9% BTC price lossesAfter two major BTC price comedowns in recent weeks, Bitcoin hodlers are understandably fearful — but historically, September has delivered even worse performance than August.At $20,000, BTC/USD is down 14% this month, making this August the biggest loser since 2015, when the pair posted an 18.67% red monthly candle.Subsequent years have proven that August can be a mixed bag when it comes to BTC price performance — in 2017, for example, the largest cryptocurrency gained over 65% in a bullish record.One month which has left no one guessing when it comes to probable price direction, however, is September. Already famous as a “red” month for Bitcoin, average losses since Coinglass records began in 2013 have been almost 6%.Historically September Down Month’Septembear’— Trader_J (@Trader_Jibon) August 26, 2022This time around, macro instability is combining with tradition to deliver gloomy projections from analysts.”Equities market in general isn’t looking good right now so this dip on $BTC is a reflection on that,” trader Josh Rager summarized as Bitcoin threatened $20,000 support. “September in general isn’t historically a great month. Possibly dip here that ends up being buyers opportunity for following months. I’ll be a spot buyer for long term on sub $20k.”Rager was continuing a debate over the likelihood of bitcoins from the Mt. Gox rehabilitation process being sold en masse by creditors due to receive them after an eight-year wait. As Cointelegraph reported, many believe that such an event will not occur, with fears to the contrary unsubstantiated.BTC/USD monthly returns chart (screenshot). Source: CoinglassMonthly chart “looks really ugly”Turning to the monthly close, nervous commentators focused on whether Bitcoin could avoid a monthly candle finishing below the $20,000 mark.Related: Why September is shaping up to be a potentially ugly month for Bitcoin priceWere it to fail to do so, BTC/USD would rival June in terms of lows absent from the chart since the end of 2020.Worse still, such an event could spark a snowball sell-off, a concerned Galaxy Trading warned Twitter followers over the weekend. “On a monthly TF things look really ugly,” it wrote on the day.”If in 3 days monthly candle closes below 20k , this could trigger a big sell off to at least 14k where the next big support is located. The reason is close below 19900 means bearish engolfing candle which in a big TF is really bad.”A move substantially below $20,000 would violate a pivot zone in place since the first move above that level in 2020, as highlighted by Caleb Franzen, senior market analyst at Cubic Analytics.”Bitcoin looks poised for a deeper retest of the key pivot range, identified by using the December 2017 monthly wick & close. This range acted as perfect resistance in 2019, acted as a launchpad in 2020, and has been attempting to act as support in 2022,” he explained about the monthly chart.BTC/USD 1-month candle chart (screenshot). Source: Caleb Franzen/ TwitterThe views and opinions expressed here are solely those of the author and do not necessarily reflect the views of Cointelegraph.com. Every investment and trading move involves risk, you should conduct your own research when making a decision.

Čítaj viac

Bitcoin mining difficulty set for 8-month record gains despite BTC price dip

Bitcoin (BTC) may have hit six-week lows of under $20,000 but its network fundamentals are anything but bearish.The latest on-chain data shows that, far from capitulating, hash rate and difficulty are making snap gains.Data supports “doozy” difficulty jumpDespite being down around 7% in a week, BTC/USD is not putting off miners, who have recently exited their own multi-month capitulation phase.Now, with hardware and competition returning to the network, fundamental indicators are firmly in “up only” mode as August draws to a close.This is neatly captured by difficulty — an expression of, among other things, the scale of competition among miners for block subsidies — which is due to increase by an estimated 6.8% next week.According to data from on-chain monitoring resource BTC.com, this will be the highest upward difficulty adjustment since January this year.Not only that, but should the 6.8% increase materialize, difficulty will jump to new all-time highs.”We may see a difficulty jump doozy enough to set a new (or close to new) ATH in a few days,” Bitcoin mining consultancy firm Blocksbridge forecast in the latest edition of its regular newsletter, “Miner Weekly,” released on Aug. 27.Blocksbridge nonetheless noted that the current climate was not easy for all network participants. Those with older equipment, for example, were feeling the squeeze thanks to spot price losses and equivalent drop in value of block subsidies and fees versus costs such as electricity.”Long story short is that the bear market is really crashing those with inefficient mining fleets,” it continued.Bitcoin mining overview (screenshot). Source: BTC.comHash rate rebounds to target all-time highBack to more bullish numbers and Bitcoin’s hash rate looks to be copying difficulty in a fresh push for new record highs.Related: Still growing — Armenian mining operator increases power plant capacityAccording to estimated data from monitoring site MiningPoolStats, hash rate stood at up to 246 exahashes per second (EH/s) as of Aug. 22, inches from all-time highs of 251 EH/s measured in late April.Hash rate is always an estimate, and its value fluctuations do not imply direct increases or decreases in miner activity.Bitcoin estimated hash rate chart (screenshot). Source: MiningPoolStatsThe views and opinions expressed here are solely those of the author and do not necessarily reflect the views of Cointelegraph.com. Every investment and trading move involves risk, you should conduct your own research when making a decision.

Čítaj viac

Mt. Gox rumors panic Bitcoin Twitter as BTC price returns below $20K

Bitcoin (BTC) failed to keep $20,000 support on Aug. 27 as fears over a sell-off by users of defunct exchange Mt. Gox added to price pressures.BTC/USD 1-day candle chart (Bitstamp). Source: TradingViewMt. Gox rumors dismissed as “typical crypto”Data from Cointelegraph Markets Pro and TradingView followed BTC/USD as it headed to new six-week lows, reaching $19,766 on Bitstamp.Thin weekend liquidity appeared to exacerbate already jittery markets, which reacted badly to unconfirmed rumors that Mt. Gox funds were due for release to creditors on Aug. 28.Claims varied widely at the time of writing, with some believing that a tranche of 137,000 BTC was set for release in one go. Others said that funds would be sent piecemeal, but that payouts would nonetheless begin this weekend.A point of consensus came in the form of creditors allegedly wanting to sell BTC owed to them, this having been out of reach since 2014, when BTC/USD traded at under $500. The unrealized 40X returns, they feared, would prove too enticing for creditors to become willing hodlers.Mt. Gox imploded with hundreds of thousands of bitcoins almost ten years ago. Following a lengthy legal procedure dealing with funds subsequently recovered from the exchange, the appointed rehabilitation trustee, Nobuaki Kobayashi, announced on July 6 that he was “preparing to make repayments” to creditors.In documentation at the time, Kobayashi gave “the end of August” as a reference period during which some initial payments might begin.”Following discussions with the Court and in accordance with the Rehabilitation Plan, the Rehabilitation Trustee plans to set the Assignment, etc. Restriction Reference Period from approximately the end of August this year until all or part of the repayments made as initial repayments is completed for safe and secure Repayments,” part of it read.With no new official information appearing on the dedicated website covering the rehabilitation proceedings, however, it remained unclear as to why the sell-off rumors had gained so much traction so quickly.Also this is only for those who choose the early lump sum payment which means they only get a portion of their bitcoin. Those who wait until the end of civil rehabilitation period will get more which is years from now.— Danny Devan (@dannydevan) August 27, 2022For trader and analyst Josh Rager, meanwhile, even if the full hoard of BTC were sold at once, the resulting selling pressure would not create the kind of apocalyptic event some imagined.MT GOX release probably creating more fear than needed140k BTC = $2.8B BTC daily trade volume $20B to $30BThese BTC aren’t going to be all sold at once https://t.co/ZLBh0HVIgs— Rager (@Rager) August 27, 2022

“The fear around the release of, potentially, the Mt. Gox Bitcoins is just unwarranted,” Cointelegraph contributor Michaël van de Poppe added. “Typical crypto.”Profits get squeezed in weekend volatilityThe latest losses nonetheless triggered more pain for existing BTC hodlers.Related: US stocks lose $1.25T in a day — more than entire crypto market capAccording to data from on-chain analytics firm Glassnode, the percentage of the overall BTC supply in profit hit a one-month low on the day at just above 55%.Older coins continued a trend of increasing dormancy, meanwhile, with the percentage of the supply last leaving its wallet two years ago or longer hitting ten-month highs.Cointelegraph recently reported on hodler habits remaining broadly unchanged despite the 2022 crypto market drawdown.The views and opinions expressed here are solely those of the author and do not necessarily reflect the views of Cointelegraph.com. Every investment and trading move involves risk, you should conduct your own research when making a decision.

Čítaj viac

Získaj BONUS 8 € v Bitcoinoch

nakup bitcoin z karty

Registrácia Binance

Burza Binance

Aktuálne kurzy