Autor Cointelegraph By William Suberg

Bitcoin market dominance plumbs 4-year lows as BTC price ditches $20K

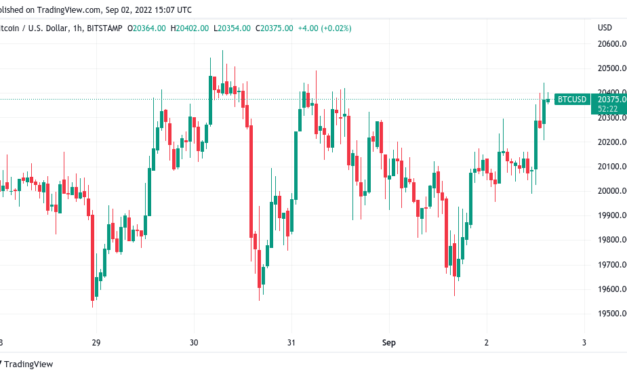
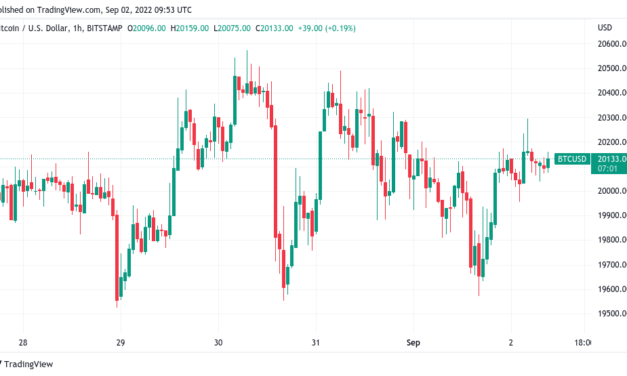
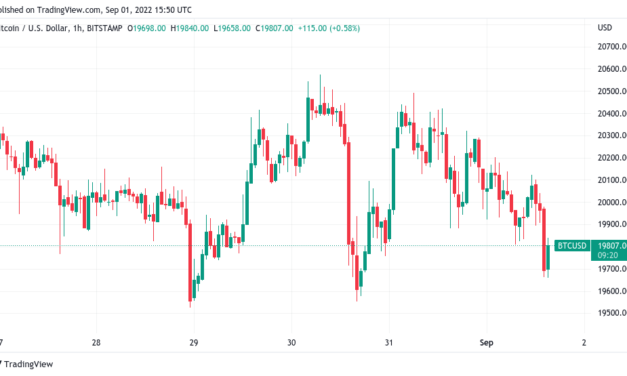
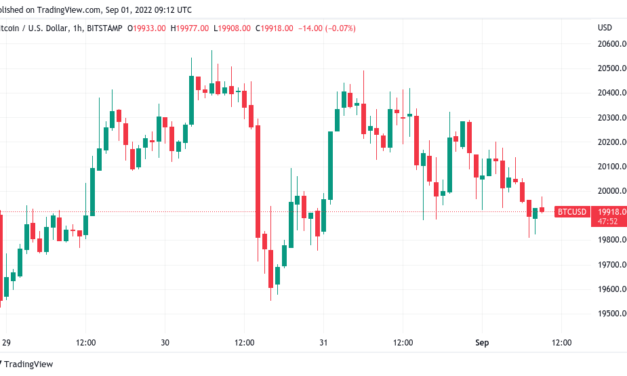
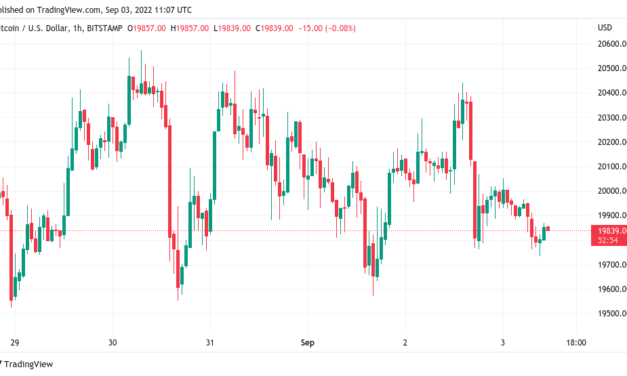
Bitcoin (BTC) traded below $20,000 on Sep. 3 as commodities declined on news of a G7 Russian energy ban.BTC/USD 1-hour candle chart (Bitstamp). Source: TradingViewAll down after gloomy macro weekData from Cointelegraph Markets Pro and TradingView showed ongoing lackluster performance on BTC/USD, which traded around $19,800.The largest cryptocurrency looked increasingly unable to flip $20,000 to firm support as the weekend began, and the mood among market participants was jaded.Eyeing the 8-day exponential moving average (EMA), popular trader Cheds noted its strength as intraday resistance continuing into September.$BTC if you are trading this and not watching daily EMA 8 you are literally asleep at the wheel. No excuses https://t.co/cTGEHWQNYo pic.twitter.com/WwMmwCLFO5— Cheds (@BigCheds) September 2, 2022United States equities closed out a troublesome week, the S&P 500 down 2.7% and Nasdaq Composite Index 3.25%, respectively.Oil prices fell in Europe on the announcement of a Russian price cap potentially taking shape at the end of the year, despite implications tied to price increases should Russia itself retaliate.German Electricity and Gas prices keep crashing. Gas now €218/MWh, down 38% from ATH, 1y Power Price now €508/MWh, down 52% from ATH. pic.twitter.com/1pPK5vJoGE— Holger Zschaepitz (@Schuldensuehner) September 2, 2022

Gas supplies to Europe likewise stopped following the price cap decision, allegedly due to technical difficulties, having previously been due to resume Sep. 3.“Gazprom seems to imply here that the only operating turbine at Nord Stream 1 pipeline can only be repaired now at one of (overseas) Siemens Energy specialised workshops, and until that happens, the pipeline won’t re-start (in other words, it’s down for good),” Javier Blas, energy and commodities columnist at Bloomberg, commented on a statement from Russian energy giant Gazprom over gas transit downtime.Bitcoin gives up market share For Bitcoin bulls, meanwhile, lack of market presence was beginning to show.Related: Bitcoin’s in a bear market, but there are plenty of good reasons to keep investingDepending on the source, Bitcoin’s share of the overall cryptocurrency market cap was at its lowest in as much as four years as of Sep. 3.CoinMarketCap put Bitcoin dominance at just 39%, the weakest performance since June 2018. TradingView calculations gave the figure as 39.88%, still marking an eight-month low.Bitcoin market cap dominance 1-week candle chart. Source: TradingViewEarlier, Cointelegraph reported on the overall cryptocurrency market cap preserving its 200-week moving average (MA), a key achievement in bear markets gone by. The same, however, could not be said for BTC/USD.The views and opinions expressed here are solely those of the author and do not necessarily reflect the views of Cointelegraph.com. Every investment and trading move involves risk, you should conduct your own research when making a decision.

Čítaj viac

Bitcoin hits new September high on US payrolls, G7 Russian energy cap

Bitcoin (BTC) passed $20,400 for the first time this month on Sept. 2 as United States economic data outperformed expectations.BTC/USD 1-hour candle chart (Bitstamp). Source: TradingViewDeclining dollar accompanies BTC price reboundData from Cointelegraph Markets Pro and TradingView showed BTC/USD approaching $20,500 after the Wall Street open, marking new highs for September.The pair had responded well to U.S. non-farm payroll data, which in August showed inflows dropping less than expected.A further boost came from news that the G7 had agreed to implement a price cap on Russian oil, with the European Union also planning to target the country’s gas imports.While the S&P500 and Nasdaq Composite Index both added 1.25% after the first hour’s trading, the U.S. dollar conversely fell in step, looking set to dive below 109 at the time of writing.U.S. dollar index (DXY) 1-hour candle chart. Source: TradingViewBitcoin thus inched closer to an area around $20,700, already being eyed as a launchpad for a short squeeze — a liquidation of short positions providing a swift spike higher for spot price.In a tweet on the day, popular trading account Daan Crypto Trades showed that a low-liquidity area remained overhead, likely not providing much resistance.“White area is quite thin in terms of recent volume profile,” part of commentary on an accompanying chart read.“Should move through that area with relative ease.”$BTC White area is quite thin in terms of recent volume profile.Should move through that area with relative ease. Needs some spot bid to support price of course or we’ll get those wicks taking out stops and reversing pic.twitter.com/hRX2Z1Ww2h— Daan Crypto Trades (@DaanCrypto) September 2, 2022Summarizing the short-term plan in his latest YouTube update, meanwhile, fellow trader Crypto Ed painted a target at near $20,700.”Extreme capitulation” is here, say multiple metricsLooking at the longer-term perspective, two analysts meanwhile insisted there was reason to stay bullish on current price action.Related: The total crypto market cap continues to crumble as the dollar index hits a 20 year highTwitter trader Alan noted similarities to the 2015 bear market, and argued that if history were to repeat, BTC/USD should be about to bottom out.Historically, one of the bear markets in $BTC was completed by two big bear flags.The current chart pattern is very similar. Breakdown of the 2nd bear flag was the last step just before a massive bull run in 2015.What if?RT and FOLLOW appreciated #Bitcoin #BTC #Cryptos pic.twitter.com/2ivFqKBgkM— Trader Tardigrade (@TATrader_Alan) September 2, 2022

Popular account Plan C contrasted realized losses in USD with Bitcoin’s market cap to produce an index of “extreme capitulation.” The result concluded that only at the pit of Bitcoin’s 2018 bear market was capitulation stronger than at present.#BTC Extreme Network Capitulation >1.0 for ONLY the second time in the last 10 years. #Bitcoin #Crypto pic.twitter.com/xn596ZZuqT— Plan©️ (@TheRealPlanC) September 2, 2022

A series of further on-chain indicator posts from Plan C on the day furthered the concept that current market behavior was echoing macro bear market bottoms.The views and opinions expressed here are solely those of the author and do not necessarily reflect the views of Cointelegraph.com. Every investment and trading move involves risk, you should conduct your own research when making a decision.

Čítaj viac

Bitcoin squeeze to $23K still open as crypto market cap holds key support

Bitcoin (BTC) returned to $20,000 on Sep. 2 amid renewed bets on a “short squeeze” higher.BTC/USD 1-hour candle chart (Bitstamp). Source: TradingViewTrader eyes $20,700 short squeeze triggerData from Cointelegraph Markets Pro and TradingView showed BTC/USD recovering from another dip below the $20,000 mark on the day, continuing rangebound behavior.The pair gave little insight into which direction the next breakout could be, with opinions differing on the surrounding environment.Amid downside pressure on risk assets and a strong U.S. dollar, overall consensus appeared to favor long-term weakness continuing.For popular trader Il Capo of Crypto, however, there was still reason to believe that a relief bounce could enter first. Thanks to the majority of the market expecting immediate losses to continue, a “squeeze” of short positions could hit, pushing spot price out of its multi-day trading range to target as much as $23,000.“Main bearish TL broken. Bullish confirmation for the short squeeze would be a break of the 20700-20800 resistance. After this, we should see 22500-23000,” he told Twitter followers on the day.“Invalidation for the short squeeze idea: break 19500 and main confirmation would be a clean break of 19000.”Bitcoin circled $20,100 at the time of writing, still requiring effort to enter the launch zone for the short squeeze.On the dollar, other crypto sources argued that the status quo was not yet showing signs of fundamental change. The U.S. dollar index (DXY) hit fresh twenty-year highs on Sep. 1.People keep tryna call the $DXY top and the #BTC bottom without any reason for itI think it’s gonna be pretty clear when it happensFor now we’re just getting continuation up on the $DXY and #BTC is sustaining low levelsThere’s no reason to believe a trend shift is happening— Kevin Svenson (@KevinSvenson_) September 1, 2022“This will end in capitulation of the the global markets and a blow off top of the US Dollar at some point,” analyst Matthew Hyland added. “We aren’t there yet.”U.S. dollar index (DXY) 1-hour candle chart. Source: TradingViewDXY was consolidating at around 109.3 at the time of writing, having hit 109.97.Crypto market cap offers bear market hopeOffering a more optimistic take, meanwhile, was Michaël van de Poppe, founder of training firm Eight Global.Related: The total crypto market cap continues to crumble as the dollar index hits a 20 year highIn his latest YouTube update on the day, Van de Poppe told market participants to pay less attention to the Bitcoin chart and instead focus on the overall cryptocurrency market cap.With BTC/USD acting below the 200-week moving average (MA) for an extended period — a first in Bitcoin history — it was “not unwarranted” for sentiment to favor further losses.“More importantly, watching the total market cap chart makes more sense, as that one grants more information on this,” he explained.“The total market cap is showing support is around the corner, as this one kept the 200 MA as support and rested on the previous all-time high too.”Van de Poppe thus forecast a potential retest of the 200 MA, whereupon a clearer bottom signal would have been printed “while most of the people are anticipating a crash towards $12,000.”Cryptocurrency market cap 1-week candle chart. Source: TradingViewThe views and opinions expressed here are solely those of the author and do not necessarily reflect the views of Cointelegraph.com. Every investment and trading move involves risk, you should conduct your own research when making a decision.

Čítaj viac

US dollar smashes yet another 20-year high as Bitcoin price sags 2.7%

Bitcoin (BTC) faced familiar pressure on the Sep. 1 Wall Street open as the U.S. dollar hit fresh two-decade highs.BTC/USD 1-hour candle chart (Bitstamp). Source: TradingViewTrader: DXY could hit 115 before ‘slowdown’Data from Cointelegraph Markets Pro and TradingView followed BTC/USD as it fell to $19,658 on Bitstamp, down 2.7% from the day’s high.The pair faced stiff resistance trying to flip the important $20,000 mark to solid support, with macro cues further complicating the picture for bulls.That came in the form of a resurgent U.S. dollar index (DXY) on the day, which beat previous peaks to reach 109.97, its highest since September 2002.U.S. dollar index (DXY) 1-day candle chart. Source: TradingViewRisk assets thus broadly lost ground, with the S&P 500 and Nasdaq Composite Index trading down 1% and 2%, respectively at the time of writing.“DXY with another strong day,” popular crypto trading account Kaleo summarized on Twitter. “Honestly see zero signs of it wanting to slow down until ~114/115, which at this rate should take at least a couple of months.”Other commentators, including crypto account TXMC Trades, noted the declining Japanese yen as an additional dollar booster. USD/JPY hit 140.21, marking its highest since August 1998.RSI divergence traders in disbelief with $DXY bull continuation. It’s almost as if RSI is a bounded oscillator and should not be used for regular divergence — Cheds (@BigCheds) September 1, 2022“Dollar at levels last seen in 2002. Key time here it seems. Bulls need a reversal. Bears need a break out,” NorthmanTrader founder, Sven Henrich added, noting that the DXY relative strength index (RSI) was “very stretched.”Bad timing?Further clouds on the horizon meanwhile made Sep. 15 a key date in crypto traders’ diary.Related: Bitcoin mining has never been more competitive even as BTC loses 13% in AugustJust days after the August Consumer Price Index (CPI) inflation print would be due, payouts as part of the Mt. Gox rehabilitation process would begin after years of legal work.Creditors would thus start to receive a share of almost 140,000 BTC, last traded at a price below $500 a coin.While the resulting selling pressure is a topic of debate, the launch coincides with the Ethereum Merge, where the largest altcoin by market cap jettisons Proof-of-Work for Proof-of-Stake as its consensus algorithm.September 15th:- #Ethereum merge- Mt. Gox #Bitcoin release beginsWhat could go wrong? pic.twitter.com/Ha5rBnpSxx— Justin Bennett (@JustinBennettFX) August 31, 2022

Cold feet reigned supreme across crypto sentiment on the day, captured by the Crypto Fear & Greed Index falling to 20/100 — its lowest since July 18 and corresponding to “extreme greed.”Crypto Fear & Greed Index (screenshot). Source: Alternative.meThe views and opinions expressed here are solely those of the author and do not necessarily reflect the views of Cointelegraph.com. Every investment and trading move involves risk, you should conduct your own research when making a decision.

Čítaj viac

Bitcoin price dips 14% in August as trader warns of ‘macro drop down’

Bitcoin (BTC) has sealed its worst August performance since 2015 after the monthly candle closed down 13.9%.BTC/USD 1-hour candle chart (Bitstamp). Source: TradingViewWeekly candle “doesn’t look good”Data from Cointelegraph Markets Pro and TradingView confirms that BTC/USD finished the month at $19,990.A knock to bulls’ efforts to stabilize spot price, the August close was only the second monthly candle finish below the $20,000 mark (depending on the exchange used) since late 2020.BTC/USD 1-month candle chart (Bitstamp). Source: TradingViewWhile preserving June’s close as the macro low on the monthly chart, the performance led traders into firmly bearish territory. Among them was Crypto Tony, who warned that the stage was set for deeper losses going forward.His outlook, he told Twitter followers on the day, saw him “leaning towards a macro drop down.”This is my macro go to on #Bitcoin currently and until we see- A change in market behaviour and becoming macro bullish (Taking out $30,000 and putting in a higher high)I am leaning towards a macro drop down, which i where i will be looking to ladder into #Altcoins for swings https://t.co/qz7RAgw4gH— Crypto Tony (@CryptoTony__) September 1, 2022Caleb Franzen, senior market analyst at Cubic Analytics, added that the first weekly candle of September is already shaping up to take Bitcoin further into the red.“The weekly candle for Bitcoin doesn’t look good, though it’s still very early in the week,” he warned alongside an explanatory chart. “The long top wick and selloff is objectively a bad sign, if it closes this way. Particularly if it turns into a red candle. Something to watch for the rest of the week.”Others saw more optimistic implications in the monthly close.Popular Twitter account Dave the wave highlighted moving average convergence/ divergence (MACD) as having predicted the comedown from local highs above $25,000 and now conversely favoring relief for bulls.On the basis of this indicator, a further correction was also predicted [at a time when uber-bullishness dominated on CT].https://t.co/Y6ONHetp80— dave the wave (@davthewave) September 1, 2022

Fellow trader Johal Miles reiterated the potentially bullish knock-on effect of an MACD cross from mid-August, one which nonetheless had seen “no continuation yet.”BTC/USD monthly returns chart (screenshot). Source: TradingViewNew “historical lows” for hodl metricOne on-chain indicator in particular meanwhile reinforced the feeling that current BTC price levels are for accumulating, not selling.Related: BTC price top warnings emerge as 10K BTC leaves wallet after 9 yearsBitcoin’s Realized Value Hodl (RHODL) ratio, which measures the relative value of coins moving in recent weeks compared to one or two years prior, now sits at its lowest ever.The dubious achievement was noticed by Philip Swift, creator of on-chain data resource LookIntoBitcoin.“RHODL Ratio is now at historical lows. Indicating near-term prices paid for $BTC are relatively low to those paid 1-2yrs ago,” he explained. “Useful way of identifying sentiment via actual behavior. Shows market is v.bearish bitcoin right now. Accumulate.”The views and opinions expressed here are solely those of the author and do not necessarily reflect the views of Cointelegraph.com. Every investment and trading move involves risk, you should conduct your own research when making a decision.

Čítaj viac

Získaj BONUS 8 € v Bitcoinoch

nakup bitcoin z karty

Registrácia Binance

Burza Binance

Aktuálne kurzy