Autor Cointelegraph By William Suberg

BTC price clings to $20K as US stocks lose the equivalent of 4 Bitcoin market caps

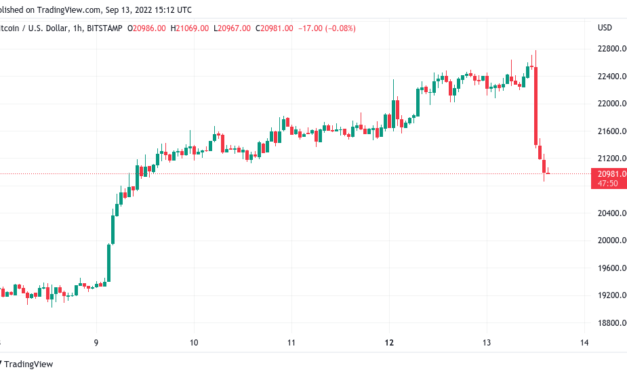
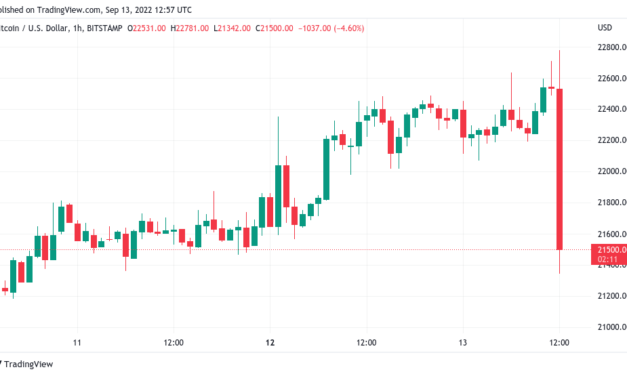
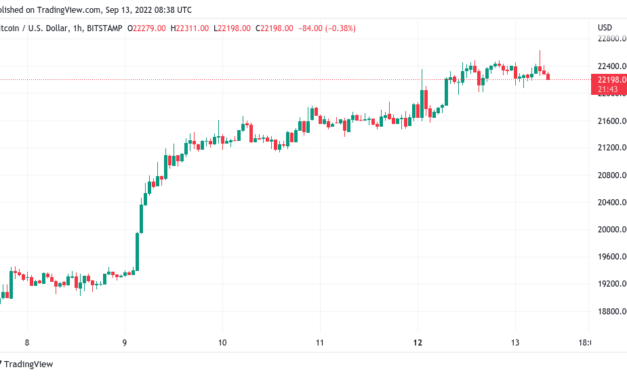
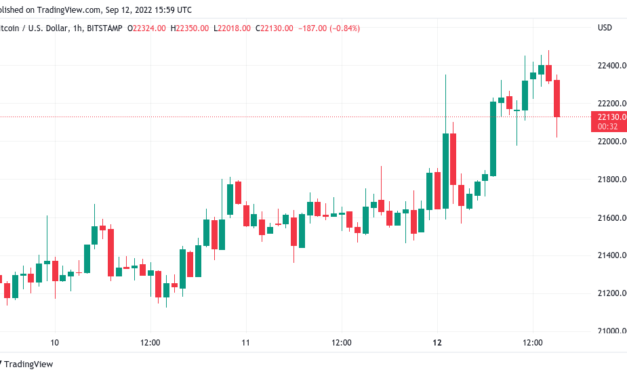
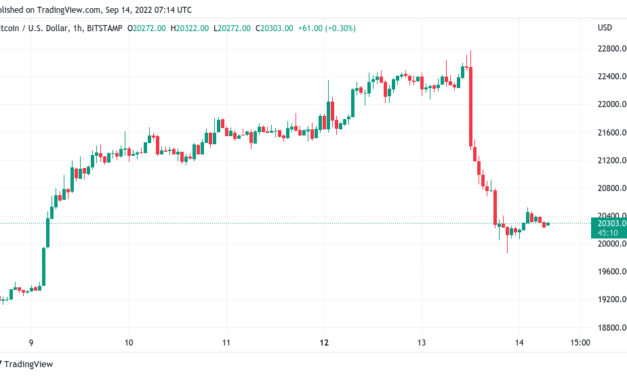
Bitcoin (BTC) briefly lost $20,000 support overnight into Sep. 14 after hot United States inflation sent risk assets crashing lower.BTC/USD 1-hour candle chart (Bitstamp). Source: TradingViewMarkets lose big in bid to “fight the Fed”Data from Cointelegraph Markets Pro and TradingView followed BTC/USD as it hit lows of $19,870 on Bitstamp — its worst since Sep. 9.The move came amid a stocks rout triggered by Consumer Price Index (CPI) inflation data for August coming in above expectations.Despite still being lower than July, the market had hoped for a quicker cooling of inflation more broadly and hence the chance of a quicker loosening of policy by the Federal Reserve.With that prospect now appearing slim, equities indexes hemorrhaged value, with Apple losing $154 billion — the sixth-biggest daily loss in U.S. stock market history.Tech selloff on Tue has been particularly costly for Apple. World’s most-valuable comp lost $154bn in market value – a wipeout that ranks among top 10 worst single-day market value losses in US stock market history, acc to BBG. That’s more than mkt cap of ~90% of S&P 500 comps. pic.twitter.com/M32soxmDPn— Holger Zschaepitz (@Schuldensuehner) September 13, 2022“Markets had tried desperately to spin a bull case and fight the Fed, basically, and that’s a dangerous place to be,” Carol Schleif, deputy chief investment officer at BMO Family Office, told Bloomberg.In total, U.S. stocks fell by approximately $1.6 trillion on the day — more than four times the Bitcoin market cap.The U.S. dollar consequently increased in strength, with the U.S. dollar index (DXY) surging back towards twenty-year highs.At the time of writing, the index circled just under 110, less than 0.9% below that macro peak seen earlier in the month.U.S. dollar index (DXY) 1-hour candle chart. Source: TradingView”Septembear” comes back to haunt BTC bullAt the time of writing, cross-market crypto liquidations totaled $355 million, with Sep. 13 forming one of the largest long liquidation events in recent weeks.Related: Bitcoin margin long-to-short ratio at Bitfinex reach the highest level everData from on-chain monitoring resource Coinglass also captured $88 million of short liquidations on that day.Crypto liquidations chart. Source: CoinglassThe sell-off thus left BTC/USD up just 1% for the month of September, which was nonetheless still the first “green” September since 2016, Coinglass showed.BTC/USD monthly returns chart (screenshot). Source: CoinglassThe views and opinions expressed here are solely those of the author and do not necessarily reflect the views of Cointelegraph.com. Every investment and trading move involves risk, you should conduct your own research when making a decision.

Čítaj viac

Bitcoin price falls under $21K as traders send 84K BTC to exchanges

Bitcoin (BTC) fell further after the Sept. 13 Wall Street open as the dust settled on unexpectedly high United States inflation.BTC/USD 1-hour candle chart (Bitstamp). Source: TradingViewBTC price eyes 9% daily lossesData from Cointelegraph Markets Pro and TradingView showed BTC/USD giving up $21,000, down up to 8.45% on the day.Bearish tendencies set in after the U.S. Consumer Price Index (CPI) print for August arrived 0.2% higher than expected.This, in turn, boosted the likelihood of a 75 or 100-basis-point key rate hike next week by the Federal Reserve — something that would pressure already creaking risk-asset markets.Fed target rate probabilities chart as of Sep. 13, 2022. Source: CME GroupBitcoin proved especially sensitive to the event, with downside nonetheless contained by anticipated support at $20,800.BTC/USD also managed to take out the latest CME futures gap created at the weekend, this lying between $21,300 and $21,500.“BTC just took out the previous swing low I marked out yesterday and today,” popular trader Crypto Ed, who forecast both levels, confirmed in part of a tweet following the CPI release.U.S. equities faced similar woes, with the S&P 500 down 3% and the Nasdaq Composite Index 4% lower at the time of writing. For Jurrien Timmer, director of global macro at asset manager Fidelity Investments, there was no reason to believe that a risk asset renaissance would set in until the Fed stopped its rate hikes altogether.Look to the 1994 cycle to understand the current one: Valuations are unlikely to rally until the Fed is done tightening and the 2-year yield starts falling. pic.twitter.com/xk6DDYLdzp— Jurrien Timmer (@TimmerFidelity) September 13, 2022Exchange inflows hit 10-week highVolatility meanwhile claimed the most BTC long liquidations in a week, these totaling $45 million for Sep. 13 at the time of writing. Related: The Fed, the Merge and $22K BTC — 5 things to know in Bitcoin this weekTotal crypto long liquidations were much higher at $168 million, according to data from on-chain monitoring resource Coinglass.Crypto liquidations chart. Source: CoinglassAnalytics platform CryptoQuant meanwhile showed exchange inflows on the day already hitting their highest since July 1 at 84,000 BTC.The views and opinions expressed here are solely those of the author and do not necessarily reflect the views of Cointelegraph.com. Every investment and trading move involves risk, you should conduct your own research when making a decision.

Čítaj viac

Bitcoin price sheds $1K in 3 minutes as US CPI inflation overshoots

Bitcoin (BTC) crashed below $22,000 instantly on Sep. 13 after United States inflation data failed to meet estimates. BTC/USD 1-hour candle chart (Bitstamp). Source: TradingViewCPI print sparks major crypto routData from Cointelegraph Markets Pro and TradingView showed BTC/USD swiftly falling $1,000 after Consumer Price Index (CPI) inflation for August came in at 8.3% year-on-year.Consensus had agreed that 8.1% would be the latest figure, and the overshoot suggested that inflation was not slowing at the expected pace.US CPI for August YoY coming in above expectations at 8.3% (expected 8.1%) but lower than in July with 8.5%.MoM core CPI coming in hot at 0.6% twice as high as the expected 0.3%.Not what the Fed wants to see.So 75bps it is at the next meeting?— Jan Wüstenfeld (@JanWues) September 13, 2022Nonetheless, versus July, year-on-year growth was still down 0.2%, preserving the overall trend of slowing CPI inflation.This was not enough to avoid a crypto rout, however, and at the time of writing, Bitcoin was below $21,500, down 4% on the day.Fed target rate probabilities chart. Source: CME GroupAs market participants increased bets on a further 75-basis-point and even a 100-point rate hike from the Federal Reserve next week, cold feet were increasingly noticeable ahead of the Wall Street open.This is just a test of the real — il Capo Of Crypto (@CryptoCapo_) September 13, 2022

“Lots of volatility around these events and a ton of fake-outs do happen,” Michaël van de Poppe, founder and CEO of trading firm Eight, responded. “Remind yourself that and avoid excessive trading. Right now, lows are taken and some consolidation seems to be happening.”The U.S. dollar index (DXY), strength in which traditionally means headwinds for crypto, saw a flash rebound on the CPI news, passing 109 for the first time since Sep. 9.U.S. dollar index (DXY) 1-hour candle chart. Source: TradingViewEthereum wobbles as Merge hype fadesOn altcoins, pain for Ether (ETH) continued as existing weakness was compounded by Bitcoin’s dip.Related: Bitcoin and altcoins pop to the upside, but upcoming macro events could cap the rallyDespite the incoming Merge event, ETH/USD and ETH/BTC both extended losses as the largest altcoin by market cap failed to capitalize on surrounding hype.”Even with the CPI print, this was always an area of resistance,” popular trader Altcoin Sherpa reacted. “Heavy interaction w. this level over the last year, it’s still an area to take caution.”The views and opinions expressed here are solely those of the author and do not necessarily reflect the views of Cointelegraph.com. Every investment and trading move involves risk, you should conduct your own research when making a decision.

Čítaj viac

Bitcoin battles whales above $22K as BTC price faces US CPI data

Bitcoin (BTC) continued to battle major resistance on Sep. 13 as markets prepared for United States inflation numbers.BTC/USD 1-hour candle chart (Bitstamp). Source: TradingView”Serious” whales present new BTC price hurdlData from Cointelegraph Markets Pro and TradingView tracked BTC/USD as it sought to push through $22,500.Bulls had attempted to vanquish a wall of seller interest in the range just above $22,000, this proving especially stubborn and leading to an overnight consolidation phase.On-chain monitoring resource Material Indicators highlighted the struggle in a screenshot of the Binance BTC/USD order book the day prior.Let’s see if they are hungry enough to snack on $13M in #BTC ask liquidity.#FireCharts pic.twitter.com/GY3giu7Mh8— Material Indicators (@MI_Algos) September 12, 2022For fellow analytics platform Whalemap, meanwhile, it was no wonder that the current range was a sticking point for bulls.“The new area to keep an eye on: $22,780 – $23,400,” the Whalemap team told Twitter followers. “This one is serious BUT is the last one inside our current 19k – 25k range.”Bitcoin large wallet inflows annotated chart. Source: Whalemap/ TwitterAn accompanying chart showed the extent to which large-volume wallets had accumulated at various levels in the past. Resistance near spot price was thus all but guaranteed. As Cointelegraph reported, these clusters of whale activity had effectively sealed the most recent BTC price bottom.Further analyzing the situation, popular trader Crypto Ed remained confident that a price correction should now enter, but noted that spot buyer interest nonetheless remained.#BTC a correction down would absolutely make sense (small CME gap), but check how spot keeps buying this (white indicator). pic.twitter.com/XbXATe8W8I— Ed_NL (@Crypto_Ed_NL) September 13, 2022

In a previous update, Crypto Ed had given a potential downside target of $20,800.CPI showdown due in hoursFor Michaël van de Poppe, CEO and founder of trading firm Eight, the day was still all about the U.S. Consumer Price Index (CPI) print for August.Related: The Fed, the Merge and $22K BTC — 5 things to know in Bitcoin this weekPoised to confirm the ongoing trend of declining inflation, CPI promised volatility across risk assets around the reveal date, slated for 8.30 am Eastern time.“Today is the big day on CPI. Expectations are that month-over-month will be -0.1% and year-over-year 8.1%,” Van de Poppe explained. “If it’s going to be higher than those numbers, probably we’ll be seeing a heavy reaction negatively on risk-on. If it’s lower – > positive reaction. Simple.”The U.S. dollar index (DXY), a key driver of risk asset downside, steadied its fall from recent days, attempting to preserve 108 as support.U.S. dollar index (DXY) 1-hour candle chart. Source: TradingViewThe views and opinions expressed here are solely those of the author and do not necessarily reflect the views of Cointelegraph.com. Every investment and trading move involves risk, you should conduct your own research when making a decision.

Čítaj viac

Bitcoin hits 3-week high as trader says 'all signs there' to short BTC

Bitcoin (BTC) kept grinding higher at the Sep. 12 Wall Street open as traders called for an imminent correction.BTC/USD 1-hour candle chart (Bitstamp). Source: TradingView$23,000 proves essential to flipData from Cointelegraph Markets Pro and TradingView showed BTC/USD hitting $22,481 on Bitstamp, its highest since Aug. 19.The pair had preserved existing gains over the weekend, with a declining U.S. dollar providing a catalyst for risk assets as the week began.The S&P 500 and Nasdaq Composite Index both traded up 1.1% after the first two hours’ trading. By contrast, the U.S. dollar index (DXY) was down 0.7% on the day.U.S. dollar index (DXY) 1-day candle chart. Source: TradingViewAnalyzing the situation, popular trader Crypto Ed said that the time had now come to eye a corrective move on BTC/USD.“I would say that all signs are there for some shorts,” he told viewers in his latest YouTube update.Upside potential was likely limited to $23,000, he suggested, while to the downside, $20,800 was an area of interest.A CME Bitcoin futures gap left over from the Sep. 10 close meanwhile added the area around $21,400 as a possible retracement target.“I only would be looking for longs if we break $23,000, then for a move towards $28-29,000,” Crypto Ed added.CME Bitcoin futures 1-hour candle chart with gap highlighted. Source: TradingViewEqually expecting a trend change was Il Capo of Crypto, who on the day reinforced a conviction that the current price strength was simply a relief rally within an overall bear market.“Most people getting bullish now. Remember that this is a short squeeze, a bounce that happens during a bear market to continue the downtrend afterwards,” he tweeted. “I still expect a little bit higher (22500-23000), but soon I will turn full bearish again.”Having sealed a weekly close above its realized price, BTC/USD now looked primed to see a daily candle close above the 100-day moving average (MA) for the first time since April.BTC/USD 1-day candle chart (Bitstamp) with 100-day MA. Source: TradingViewEthereum struggles on Merge countdownLess inspiring, meanwhile, was price action on Ethereum (ETH), which lost ground on the day despite ongoing hype around the Merge.Related: The Fed, the Merge and $22K BTC — 5 things to know in Bitcoin this weekETH/BTC 1-day candle chart (Binance). Source: TradingViewETH/USD was down 2.2% at the time of writing, while ETH/BTC caught the attention of some market participants.Update: Rejection off the 0.085 level for ETH/BTC.My position that the run-up in ETH going into the merge has no more gas is intact. Will continue watching this. https://t.co/HKPdHmsDrb pic.twitter.com/Xy0J6baaai— Joe Consorti ⚡ (@JoeConsorti) September 11, 2022Bitcoin’s share of the overall cryptocurrency market cap thus saw a stiff rebound on the day after hitting just 38.9%, its lowest since January.Bitcoin market cap dominance 1-week candle chart. Source: TradingViewThe views and opinions expressed here are solely those of the author and do not necessarily reflect the views of Cointelegraph.com. Every investment and trading move involves risk, you should conduct your own research when making a decision.

Čítaj viac

Získaj BONUS 8 € v Bitcoinoch

nakup bitcoin z karty

Registrácia Binance

Burza Binance

Aktuálne kurzy