Autor Cointelegraph By William Suberg

Bitcoin bulls battle for $80K control as US jobs data delivers surprise

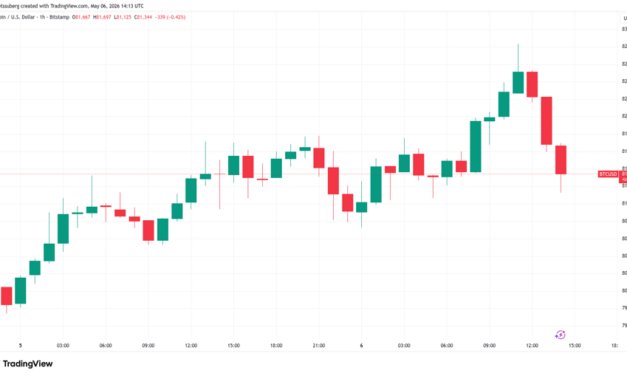
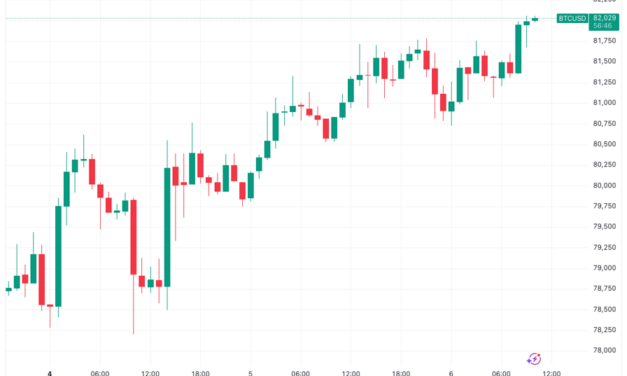
Bitcoin (BTC) struggled with an $80,000 reclaim at Friday’s Wall Street open as strong US jobs data added to headwinds.Key points:Bitcoin crisscrosses $80,000 as US jobs data notionally reduces the odds of US interest-rate cuts.US jobs vastly outpace expectations, adding almost twice the anticipated number of jobs in April.Traders avoid giving up on the local uptrend, seeing a “healthy” support retest.Bitcoin stays undecided on fate of $80,000Data from TradingView showed ongoing BTC price volatility as buyers and sellers sparked gyrations around the key $80,000 mark.BTC/USD one-hour chart. Source: Cointelegraph/TradingViewUS nonfarm payrolls revealed that the economy added far more jobs than expected in April, despite ongoing inflation pressure thanks to the Iran war.The Bureau of Labor Statistics reported 115,000 jobs — far beyond the expected 65,000.“The change in total nonfarm payroll employment for February was revised down by 23,000, from -133,000 to -156,000, and the change for March was revised up by 7,000, from +178,000 to +185,000,” an accompanying news release stated.“With these revisions, employment in February and March combined is 16,000 lower than previously reported.”US civilian unemployment rate. Source: BLSThe unemployment rate remained unchanged at 4.3%.Bitcoin initially fell on the numbers, as outperformance implied less need for the Federal Reserve to relax financial policy.As Cointelegraph reported, the Fed made it clear at its latest meeting on interest rates that conditions were conducive to tightening, and that rate cuts were unlikely.The latest data from CME Group’s FedWatch Tool reflected market expectations of a potential rate hike at the Fed’s next meeting on June 17.Fed target rate probabilities for June 17 FOMC meeting (screenshot). Source: CME GroupBTC price sees “healthy bullish backtest”Among traders, the mood was one of cautious optimism with acceptance that recent gains may not hold for long.Related: Bitcoin Bollinger Bands push key breakout as creator acts on positive signal“Retesting the highs from the previous consolidation,” Daan Crypto Trades summarized in his latest X analysis. “Good bounce so far but this is a key level for the bulls to hold.”BTC/USDT perpetual contract 12-hour chart. Source: Daan Crypto Trades/XTrading account Cryptic Trades saw Bitcoin retesting its bull market support band, an area formed by two daily moving averages.“For now, this looks like a healthy bullish backtest before a continuation higher,” it wrote on the day.BTC/USD one-day chart. Source: Cryptic Trades/XEarlier, Cointelegraph noted signs that a local top could be in for BTC/USD, notably an “overbought” warning on the relative strength index indicator.

Čítaj viac

Bitcoin eyes $80K reclaim as traders say these BTC price support levels must hold

Bitcoin (BTC) revisited $80,000 on Friday after US-Iran war nerves sparked 3% daily losses.Key points:Bitcoin bullish momentum slowly returns after a shakeout amid familiar geopolitical tensions.Traders flag support levels in the mid- to high-$70,000 zone as important for bulls to defend.Unprecedented Bollinger Bands data calls for more volatile conditions going forward.Bitcoin retests $80,000 after sell-offData from TradingView showed BTC price downside pressure easing toward the Wall Street open.BTC/USD one-hour chart. Source: Cointelegraph/TradingViewThursday had seen risk assets lose out amid rumors of the US restarting its “Project Freedom” campaign against Iran, while military strikes from both sides placed a fragile ceasefire in jeopardy. The S&P 500 came off new all-time highs.S&P 500 one-hour chart. Source: Cointelegraph/TradingViewCommenting, crypto trader Michaël van de Poppe said that the retracement was no “surprise” given recent brisk gains.“Assets trend in waves. Bitcoin has seen multiple days of momentum upwards, so it’s not strange to expect it to consolidate just now,” he wrote in an X post at the time. “As long as the trend remains intact, I think we’ll see more upside during coming weeks.”BTC/USDT one-day chart. Source: Michaël van de Poppe/XVan de Poppe subsequently described Bitcoin as “doing just fine,” but said $76,000 needed to hold as support.“The first rally out of a bear market lands at that resistance, and it would give some more momentum for Altcoins,” he added.Trader Jelle also remained optimistic on the outlook while arguing that the day’s lows near $79,000 needed to hold.“Even in the bearish case, I believe the turquoise zone will hold the price and trigger a reversal to the upside,” he told X followers about charts showing $74,500 as a potential downside target.BTC/USDT charts. Source: Jelle/XBitcoin volatility metric demands larger movesOn daily time frames, BTC/USD thus failed to sustain a break beyond the upper band of the Bollinger Bands volatility metric.Related: Bitcoin can crash to $50K if ‘most critical’ bear market test fails: AnalysisBTC/USD one-day chart with Bollinger Bands data. Source: Cointelegraph/TradingViewAs Cointelegraph reported, positive signals from the Bands even inspired their creator, John Bollinger, to take a position via his proprietary investment funds.In an X response, trader SuperBro observed the narrowest-ever conditions for the Bands on monthly time frames — a key prerequisite for heightened volatility next.BTC/USD one-month chart with Bollinger Bands data. Source: Cointelegraph/TradingViewThis article is produced in accordance with Cointelegraph’s Editorial Policy and is intended for informational purposes only. It does not constitute investment advice or recommendations. All investments and trades carry risk; readers are encouraged to conduct independent research.

Čítaj viac

Bitcoin Bollinger Bands push key breakout as creator acts on 'positive' signal

Bitcoin (BTC) is attempting its first Bollinger Bands breakout in months, while creator John Bollinger is more bullish than some traders.Key points:Bitcoin faces stiff resistance as it attempts daily candle closes above the upper Bollinger Band.Volatility comes on cue after the Bands’ tightest-ever conditions last month.Creator John Bollinger takes advantage of positive trading signals as part of his investment program.Responses mixed as Bitcoin tests Bollinger Bands ceilingData from TradingView confirms that on Wednesday, BTC/USD saw its second daily close above the upper Bollinger Band on the daily chart, something it has not achieved since mid-January.BTC/USD one-day chart with Bollinger Bands data. Source: Source: Cointelegraph/TradingViewThe Bollinger Bands indicator, used to assess both volatility and momentum, recently saw the narrowest gap between its constituent trend lines ever recorded for Bitcoin.This led to predictions of a breakout move, with the direction open to debate, as well as heightened volatility to come.Commenting on the visit to the upper band, however, trader SuperBro noted that the price was now in an area full of potential points of rejection.“Closed above the upper Bollinger Band, above the trendline on closing prices, but just below the log trendline on wicks,” they wrote in a post on X.SuperBro added that most potential liquidations now belonged to long positions below the price, with shorts already taken out.“There are relatively few short liquidations remaining up to 85K compared to long liquidations down to 74K,” they continued. “However, bulls still have the momentum advantage and I don’t yet see a good reversal setup. Despite the liquidation imbalance, I’m holding tight to see if we can blast through.”BTC/USD one-day chart with order-book liquidity data. Source: SuperBro/XBollinger, the indicator’s creator, revealed that one of his investment fund’s proprietary trading models had flipped positive on Bitcoin, and had taken a position accordingly. Source: John Bollinger/X”Overheated” Bollinger signal returns after 18 monthsWednesday also saw another Bollinger Band milestone, this time concerning the market value to realized value (MVRV) ratio for speculative investors.Related: Bitcoin can crash to $50K if ‘most critical’ bear market test fails: AnalysisThe metric, recently covered by Cointelegraph, compares Bitcoin’s market cap to the price at which the supply last moved, also known as its “realized cap.”A Bollinger Bands derivative entered “overheated” territory for the first time since late 2024, the X analytics account Frank Fetter noted.At the time, BTC/USD was building its first visit to $100,000 in history.Bitcoin short-term holder MVRV ratio with Bollinger Bands oscillator. Source: Frank Fetter/XAsked whether “overheated” conditions implied a price reversal, the account said this was “not necessarily” a given outcome.This article is produced in accordance with Cointelegraph’s Editorial Policy and is intended for informational purposes only. It does not constitute investment advice or recommendations. All investments and trades carry risk; readers are encouraged to conduct independent research.

Čítaj viac

Bitcoin price rejects at $83K as Trump calls Iran deal 'big assumption'

Bitcoin (BTC) cooled from new 13-week highs at Wednesday’s Wall Street open amid mixed signals over a US-Iran peace deal.Key points:Bitcoin stops short of tapping $83,000 as momentum becomes guided by geopolitical developments.Oil sees flash volatility around rumors of the Strait of Hormuz opening.Bitcoin trader sees a price reset to a $78,400 trend line.Iran deal let-down sours Bitcoin’s attack on $83,000Data from TradingView showed a new local peak for BTC/USD of $82,833 on Bitstamp.BTC/USD one-hour chart. Source: Cointelegraph/TradingViewThe pair made fresh gains amid reports of a 14-point ceasefire agreement potentially coming into effect — one that would include resumption of oil traffic through the Strait of Hormuz.Hours later, however, US President Donald Trump said that Iran’s agreement to the terms of the truce was “perhaps, a big assumption.”“If they don’t agree, the bombing starts, and it will be, sadly, at a much higher level and intensity than it was before,” he added in a post on Truth Social.Source: Truth SocialBitcoin reacted by erasing its upside to circle $81,500 at the time of writing, still up around 1% on the day.Oil also saw volatility, with WTI dropping over 10% in a matter of hours before rebounding to $96 per barrel.CFDs on WTI crude oil one-hour chart. Source: Cointelegraph/TradingViewCommenting on X, trading resource The Kobeissi Letter reported what it called “unusually large” short interest on WTI, which totaled nearly $1 billion, immediately before the drop.Light crude oil futures chart. Source: The Kobeissi Letter/XBTC price focus switches to $78,000 and higherBitcoin traders, meanwhile, looked to patches of potential liquidations on exchange order books for clues as to where price might head next.Related: Bitcoin can crash to $50K if ‘most critical’ bear market test fails: Analysis“Above, the $82.4K area still has some left. But price did take out most of the local liquidity from the past day. With price at 3 month highs, we would need to zoom out to see the other major levels,” trader Daan Crypto Trades told X followers. “Below, the $80.1K & $78.2K levels are good to watch if price were to trade into them.”Crypto liquidation history (screenshot). Source: CoinGlassData from CoinGlass put total crypto liquidations over the past 24 hours at more than $550 million, with shorts accounting for $400 million of the total.Trader CrypNuevo called BTC/USD “overextended” on short time frames, seeking a retracement to the 50-period simple moving average (SMA) on the four-hour chart. That stood at $78,432.“Ideally it continues pushing straight higher without any exhaustion signs and it will overextend price even more so the short will be more atractive and worth it when we see those signs at higher prices,” he wrote on X.BTC/USD four-hour chart with 50SMA. Source: Cointelegraph/TradingViewEarlier, Cointelegraph reported on concerns that historical precedent called for the failure of Bitcoin’s current breakout attempt.This article is produced in accordance with Cointelegraph’s Editorial Policy and is intended for informational purposes only. It does not constitute investment advice or recommendations. All investments and trades carry risk; readers are encouraged to conduct independent research.

Čítaj viac

Bitcoin can crash to $50K if 'most critical' bear market test fails: Analysis

Bitcoin (BTC) is approaching its “most critical” resistance hurdle of the bear market, new BTC price analysis says.Key points:Bitcoin has arguably its most important resistance battle at $84,000.A failure to reclaim a 200-day trend line opens up the road down to $50,000 lows, warns analysis.The bull market support band needs to hold in the event of a corrective phase.Bitcoin faces battle to avoid “bear cycle continuation”In an X post on Wednesday, crypto investment company TradingShot revealed the next key decision point for Bitcoin bulls.BTC price action continues to test $82,000, according to data from TradingView, but it is the area around $84,000 that will be essential to reclaim as support next.BTC/USD one-hour chart. Source: Cointelegraph/TradingView“Bitcoin is about to test its 1D MA200, the most critical Bear Cycle Resistance but has also already entered the Pivot Zone formed from the previous Low,” TradingShot wrote.An accompanying chart compares current price performance with the 2022 bear market, with the 200-day simple moving average (SMA) at the center.At the time, BTC/USD retested the 200-day SMA from below after initially losing it, but the reclaim failed — and the result was a trip to new macro lows.“This is a familiar pattern that $BTC forms during downtrends, it was also emphatically present during the 2022 Bear Cycle where those Pivot Zones got formed from a previous Low that was later tested as Resistance,” the analysis continues.BTC/USD one-week chart. Source: TradingShot/XShould history repeat, TradingShot is eyeing a dramatic correction, with a bottom target at $50,000.“A rejection now on this ‘Stepping Stones’ pattern will confirm the Bear Cycle continuation for BTC to $50000, while a break-out will invalidate it,” it concludes.As Cointelegraph reported, the $50,000 zone has long been a favorite among traders who see the bear market continuing.BTC price support band as “main focus”If the 200-day SMA is the resistance level to beat, two trend lines immediately below price are essential to retain as support, commentators argue.Related: Bitcoin price nears $82K as ‘big level’ sparks warning of fresh macro rejectionThe so-called bull market support band, formed of the 20-week SMA and the 21-week exponential moving average (EMA), sits near $78,000.In some of its latest X analysis, trading account Cryptic Trades said that the support band should stay the “main focus.”“I believe that as long as price keeps holding above this range, as well as the April 2025 bottoming formation around $76K, the broader market structure remains intact,” it wrote on Wednesday alongside an explanatory chart. “The other key level to track is the lost high-timeframe support range marked in purple around $84K, where I believe we could see a short-term rejection.”BTC/USD one-day chart. Source: Cryptic Trades/XThis article is produced in accordance with Cointelegraph’s Editorial Policy and is intended for informational purposes only. It does not constitute investment advice or recommendations. All investments and trades carry risk; readers are encouraged to conduct independent research.

Čítaj viac

Získaj BONUS 8 € v Bitcoinoch

nakup bitcoin z karty

Registrácia Binance

Burza Binance

Aktuálne kurzy