Autor Cointelegraph By William Suberg

More ancient Bitcoins leave from its wallet after 10-year hibernation

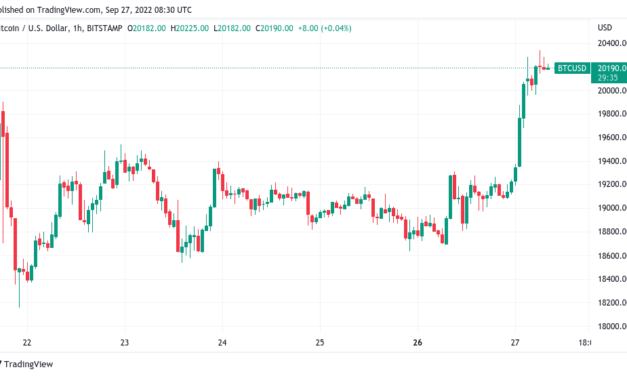
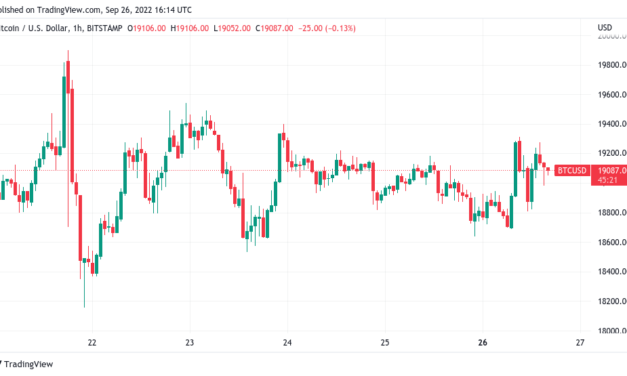
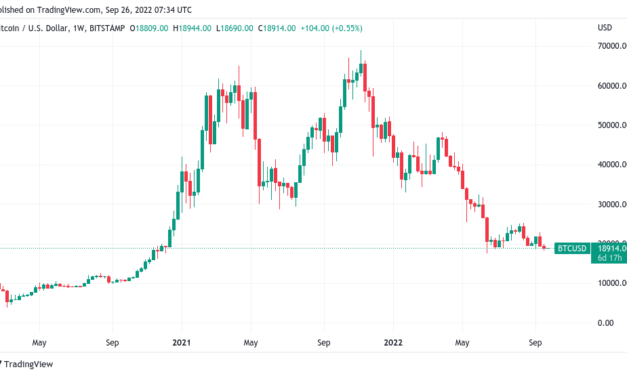
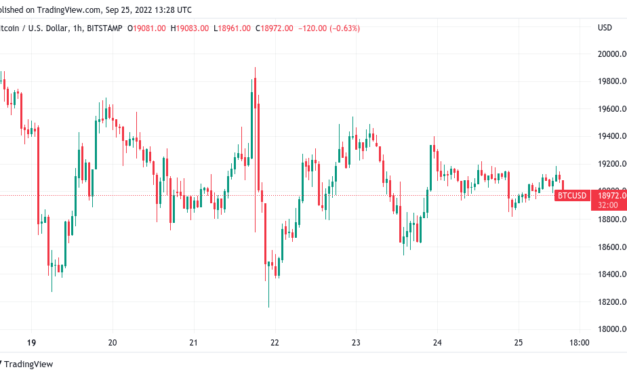
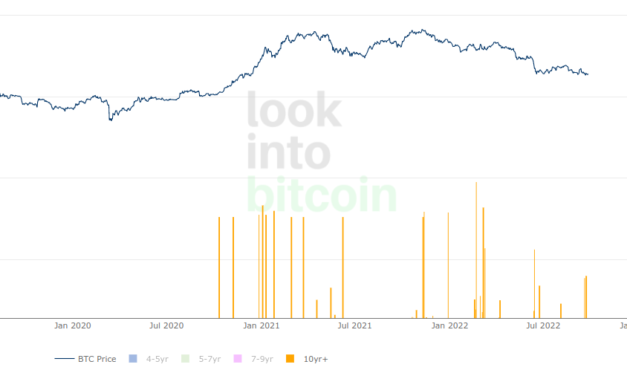
Bitcoin (BTC) is seeing some of its oldest coins come back to life after a decade lying dormant.The latest on-chain data reveals that two-year BTC price lows have reawakened the most ancient part of the supply.”Very old” bitcoins come back to lifeAs BTC/USD returns to levels not seen since Q4 2020, questions are arising over how long-term holders will respond.The on-chain picture is mixed — the dormant supply is aging, but certain old hands are showing signs of wanting to sell at current prices.The latest piece of the puzzle comes in the form of BTC returning to circulation after remaining in the same wallet for at least ten years.Off the menu since 2012 — or even before — a total of 510.65 BTC moved again for the first time last week.Little is known about the origin of the coins and the motive behind them coming back to life. The movements were noted by Philip Swift, creator of on-chain analytics resource LookIntoBitcoin.“We saw the movement of some VERY old coins last week. Coins that had not moved onchain for +10yrs,” he commented on social media on Sep. 27.BTC moves after 10 years+ dormancy chart (screenshot). Source: LookIntoBitcoin10-year inactive BTC hits record highAt the same time, separate data from on-chain analytics firm Glassnode has confirmed that more of the BTC supply has now been dormant for a decade or more than ever before.Related: Bitcoin gains 5% to reclaim $20K, eyes first ‘green’ September since 2016As of Sep. 27, a total of 2,521,378.890 BTC has stayed out of circulation for a minimum of ten years — a new all-time high.BTC supply last active 10 years ago or more chart. Source: Glassnode/ TwitterCointelegraph has been closely monitoring movements of old coins as the latest Bitcoin bear market takes hold. Late August, for example, was marked by 10,000 BTC suddenly moving on-chain, leaving its wallet for the first time since 2013. At the time, concerns even linked the stash to defunct exchange Mt. Gox, a theory later disregarded.According to LookIntoBitcoin, meanwhile, Bitcoin’s June lows saw a larger tranche for 10-year+ coins move in a single day, with 477.80 BTC recorded on Jun. 14.Bitcoin spent output lifespan of 10+ years chart. Source: GlassnodeThe views and opinions expressed here are solely those of the author and do not necessarily reflect the views of Cointelegraph.com. Every investment and trading move involves risk, you should conduct your own research when making a decision.

Čítaj viac

Bitcoin gains 5% to reclaim $20K, eyes first 'green' September since 2016

Bitcoin (BTC) delivered long-anticipated volatility on Sep. 27 as a squeeze higher resulted in a push beyond $20,000.BTC/USD 1-hour candle chart (Bitstamp). Source: TradingViewBTC price 9-day highs greet tradersData from Cointelegraph Markets Pro and TradingView followed BTC/USD as it added over 7% after the Sep. 26 close.Local highs of $20,344 appeared on Bitstamp before the pair began consolidating at around $20,200.The move naturally did not go unnoticed by in trading circles, but opinions differed over the outcome, amid warnings that the whole episode may end up trapping overoptimistic traders taking late long positions.“No [rejection] yet, but soon. Expecting higher for now,” popular Twitter account Il Capo of Crypto summarized, sticking by a theory which demanded new lower lows than the sub-$19,000 levels seen over the past week.Research firm Santiment meanwhile noted mass profit-taking beginning as Bitcoin recrossed the $20,000 boundary for the first time in over a week.“Many traders were apparently awaiting the $20k threshold to begin selling their bags,” it revealed alongside a chart of transactions made at a profit or loss to their owner. “As Bitcoin crossed back above this psychological level, mass profit taking ensued. Now we find out whether those anxious to sell will regret their decisions.”Bitcoin transactions in profit/ loss annotated chart. Source: Santiment/ TwitterCan bulls beat “Septembear?”In a sign of how even modest price moves can impact market sentiment, meanwhile, the return to $20,000 set up BTC/USD to finish September higher than at the start.Related: ‘The bond market bubble has burst’ — 5 things to know in Bitcoin this weekAs noted by on-chain analytics resource Material Indicators, all now rested on bulls’ ability to defend BTC price action into the monthly close.“BTC now in position for a green Monthly close…if it can hold through Friday. Taking profits along the way,” it confirmed in a tweet.While modest, Bitcoin’s September gains totaled 0.7% at the time of writing, with BTC/USD at $20,200. If the month ends up “green,” it would be the first non-loss making September since 2016, data from Coinglass shows.Just a day previously, Bitcoin was looking at monthly losses of 6% or more.BTC/USD monthly returns chart (screenshot). Source: CoinglassThe views and opinions expressed here are solely those of the author and do not necessarily reflect the views of Cointelegraph.com. Every investment and trading move involves risk, you should conduct your own research when making a decision.

Čítaj viac

Traders brace for Bitcoin price volatility as DXY 2022 gains near 20%

Bitcoin (BTC) volatility edged higher during Sept. 26 as the Wall Street open avoided significant losses.BTC/USD 1-hour candle chart (Bitstamp). Source: TradingViewMonthly close tipped to shake up BTC priceData from Cointelegraph Markets Pro and TradingView showed BTC/USD circling $19,000 on the day, with hourly candles of 1.5%–2% not uncommon.The pair was expected to break out of its narrow trading range in the short term, having consolidated since Sept. 22.For Michaël van de Poppe, founder and CEO of trading firm Eight, a tap of the area at the top of the range should signal acontinuation higher.“Theory still stands for Bitcoin,” he told Twitter followers on the day. “Crucial area at $18.6K holds for support, which we’ve been testing multiple times. Another test of the $19.4K–19.5K area (which we’ll be doing soon) is, most likely, giving a breakout to the upside. I’m targeting $20K and $22.5K.”On-chain analytics resource Material Indicators agreed on volatility returning.“BTC is trading in a tight range. Volatility will increase as the week progresses toward the Monthly Close, which coincides with Monthly and Quarterly Options expiry,” it wrote in a Twitter thread on the current state of the market. “If bulls can manage a green M close above $20k, technical resistance is at the key MAs.”Eyeing a longer-term range, meanwhile, fellow trader and analyst Josh Rager suggested that an optimistic scenario could see BTC/USD echo its growth from the first half of 2019. “Uncertain if a bottom is in for Bitcoin but if $BTC price starts making its way back up to $24k+, I’ll certainly be paying attention,” he tweeted. “Not saying that history will repeat but April ’19 took most people by surprise.”Rager acknowledged that the macroeconomic environment this year was “different” from 2019.BTC/USD monthly returns chart (screenshot). Source: CoinglassDollar strength sees best ever yearOn the macro topic, United States equities stabilized at the Sept. 26 Wall Street open, helping highly-correlated crypto to avoid downside volatility. Related: ‘The bond market bubble has burst’ — 5 things to know in Bitcoin this weekThe S&P 500 and Nasdaq Composite Index were down 0.35% and 0.65% on the day, respectively.The U.S. dollar index (DXY) nonetheless looked primed to attack its latest twenty-year highs, having retraced only modestly after reaching 114.52 — its highest since May that year.2022 has marked the best year ever for DXY, now up over 18% since Jan. 1.“The 52-week percent change (lower-bound) is +21.3%, the highest rate of change since Q2 2015,” Caleb Franzen, senior market analyst at Cubic Analytics, noted in part of a tweet on the day. U.S. dollar index (DXY) 1-month candle chart. Source: TradingView“The trend will stabilize & the RoC will normalize, but that doesn’t necessitate a decline in the $DXY.”The views and opinions expressed here are solely those of the author and do not necessarily reflect the views of Cointelegraph.com. Every investment and trading move involves risk, you should conduct your own research when making a decision.

Čítaj viac

'The bond market bubble has burst' — 5 things to know in Bitcoin this week

Bitcoin (BTC) starts a new week staring down a wild macro environment after sealing its lowest weekly close in nearly two years.As risk assets across the global economy take a hammering and the U.S. dollar surges, the largest cryptocurrency is on a limp footing.September, having started out on bulls’ side, is now living up to its informal crypto market nickname — “Septembear” — and BTC/USD is currently down 6.2% since the start of the month.The bad news keeps coming for hodlers, who are clinging to dormant coins in increasing numbers as the dollar runs rampant and mainstream appetite to diversify into riskier plays continues to evaporate.With macro set to remain the key focus for everyone this week, Cointelegraph takes a look at what might lie in store for BTC price action.In economic conditions that rival any major period of historical upheaval seen in the past century or more, here are some factors to take into account when assessing where Bitcoin could head next.Weekly close sends BTC/USD back to November 2020While not matching the previous week’s losses (3.1% versus 11%), the past seven days nonetheless managed to spark Bitcoin’s lowest weekly close since November 2020, data from Cointelegraph Markets Pro and TradingView shows.As the downside keeps coming, Bitcoin has thus turned back the clock to before the breakout, which took it beyond its prior halving cycle’s all-time high.BTC/USD 1-week candle chart (Bitstamp). Source: TradingViewThe sense of deja vu is unwelcome to the average hodler — the vast majority buying and cold storing over the past two years is now underwater.“$BTC just made the lowest weekly close in this zone,” popular Twitter analyst SB Investments summarized after the close. “Looks bearish with stocks looking to break support as well. But on the other side this is what everyone expects.”Whether the markets could pull a surprise “max pain” move to the upside, liquidating short bias, is a key alternative argument for Bitcoiners. For popular trader Omz, the weekly close price of $18,800 even represents a convincing local bottom.The RSI divergence has not gone unnoticed elsewhere, with trader JACKIS flagging its arrival last week.“We only got two touches of the oversold territory in the past & they have always marked the exact bottom as well,” he tweeted at the time.Fellow trading account IncomeSharks also maintained that a reversal could accompany the U.S. midterm elections in early November, but stopped short of saying that the bottom was in.“Elevator down, stairs up,” it commented on the 4-hour chart on the day. “Keep on building double bottoms and new supports, Midterm Rally remains on the table. Break this structure, remove these targets, and find a new bottom.”BTC/USD 4-hour candle chart (Bitstamp). Source: TradingViewDollar wrecking ball costs stocks, fiatMonday has barely started and the turmoil that accompanied last week is already back with a vengeance on macro markets.An unstoppable U.S. dollar is laying waste to key trading partner currencies, with the Bitcoin pound sterling making headlines on the day as it plunges 5% to come within a few percentage points of USD parity — its lowest levels against the greenback ever.GBP/USD would follow the euro becoming worth less than $1, while the misery forced Japanese authorities to prop up the yen exchange rate artificially last week.GBP/USD 1-day candle chart. Source: TradingViewEUR/USD briefly fell below $0.96 before a modest rebound, while USD/JPY remains near its highest since the 1990s despite Japan’s intervention.At the same time, alarm bells are sounding for global bonds, which have fallen back to 2020 levels. Markets commentator Holger Zschaepitz warned alongside Bloomberg data:“Looks like the bond market bubble has burst. The value of global bonds has plunged by another $1.2tn this week, bringing the total loss from ATH to $12.2tn.” Stocks are set to fare no better, with futures down on the day prior to the Wall Street open. Brent crude oil fell below $85 per barrel for the first time since the start of 2022.“Global bonds are collapsing in their fiat currencies, which are collapsing against the dollar, which is fast losing purchasing power,” Saifedean Ammous, author of the popular books, “The Bitcoin Standard” and “The Fiat Standard,” reacted. “It will be months & years before the average fiat user realizes just how much they’re getting ruined financially. The ‘new normal’ is poverty.”With crypto still highly correlated with stocks and inversely correlated against dollar strength, the outlook for Bitcoin is thus less than positive as the status quo looks set to remain.Euro Area Consumer Price Index (CPI) is due this week, expected to show inflation still increasing, while the U.S. Personal Consumption Expenditures Price Index (PCE) print should conversely continue the U.S. downtrend which began in July.The U.S. dollar index (DXY) meanwhile shows no sign of reversing, now at its highest since May 2002.U.S. dollar index (DXY) 1-month candle chart. Source: TradingViewHodlers in classic bear market modeAmid such mayhem, it comes as no surprise that Bitcoin hodlers’ conviction is increasing and long-term investors refuse to sell.Stubborn hodling is a hallmark of Bitcoin bear markets, and the latest data shows that that mindset is firmly back this year. According to on-chain analytics firm Glassnode, Bitcoin’s so-called Coin Days Destroyed (CDD) metric is setting new lows.CDD refers to how many dormant days are erased when BTC leaves its host wallet after a given period. When CDD is high, it suggests that more long-term stored coins are now on the move.“The total volume of Bitcoin coin-days destroyed in the last 90-days has, effectively, reached an all-time-low,” Glassnode commented. “This indicates that coins which have been HODLed for several months to years are the most dormant they have ever been.”Bitcoin 90-day Coin Days Destroyed (CDD) annotated chart. Source: Glassnode/ TwitterThe news follows weeks of various hodl-focused metrics showing a commitment to keep the BTC supply under lock and key for better days.Glassnode meanwhile additionally noted the increasing prevalence of coins hodled for at least three months as a proportion of the USD value of the BTC supply.“Bitcoin HODLers appear to be steadfast and unwavering in their conviction,” it agreed. An accompanying chart showed Bitcoin’s HODL Waves metric — a depiction of the supply broken down by coin dormancy.Bitcoin HODL Waves annotated chart. Source: Glassnode/ TwitterWhales still dictate support and resistanceWhile old hands walk away from the “sell” button, Bitcoin’s largest-volume investors are on the radar of analysts when it comes to spot price moves.The current trading range represents a zone of interest due to the extent of trading activity involving whale money in the past.Large buys lend additional weight to a specific support price while the same is true of resistance levels, and according to on-chain monitoring resource Whalemap, BTC/USD is currently stuck between the two.“Holding 19k-18k is key for $BTC,” the Whalemap team summarized late last week.An accompanying chart showed whale resistance levels capping relief for Bitcoin and limiting it to within the $20,000 zone.Bitcoin whale resistance annotated chart. Source: Whalemap/ TwitterNonetheless, separate figures from research firm Santiment confirm that whales’ BTC exposure overall has fallen to two-year lows.Bitcoin whale ownership annotated chart. Source: Santiment/ Twitter”Extreme fear” enters second weekIn a familiar return to 2022 norms, crypto market sentiment has now been in “extreme fear” mode for more than a week.Related: 5 altcoins that could turn bullish if Bitcoin price stabilizesAs per the Crypto Fear & Greed Index, which measures aggregate crypto market sentiment, the average investor could not feel much more uneasy about the outlook.As of Sep. 26, Fear & Greed recorded a score of 21/100, with 25/100 the boundary for “extreme fear.Cold feet is nothing new to the market this year, which saw its longest-ever stint in “extreme fear” at over two months.Crypto Fear & Greed Index (screenshot). Source: Alternative.meA potential silver lining could lie in social media interest, which saw a rebound over the weekend, Santiment noted.”Among crypto’s top 100 assets, $BTC is the topic in 26%+ of discussions for the first time since mid-July,” it revealed in part of Twitter comments this week. “Our backtesting shows 20%+ dedicated to Bitcoin is a positive for the sector.”Bitcoin social dominance annotated chart. Source: Santiment/ TwitterThe views and opinions expressed here are solely those of the author and do not necessarily reflect the views of Cointelegraph.com. Every investment and trading move involves risk, you should conduct your own research when making a decision.

Čítaj viac

Bitcoin risks worst weekly close since 2020 as BTC price dices with $19K

Bitcoin (BTC) headed for its lowest weekly close since 2020 on Sep. 25 as a week of macro turmoil took its toll.BTC/USD 1-hour candle chart (Bitstamp). Source: TradingViewTrader prepares for “important week” for BTCData from Cointelegraph Markets Pro and TradingView showed BTC/USD trading near $19,000 with hours left to run on the weekly candle.While only down $400 since the week began, the pair offered traders little optimism amid fears that the coming days would continue the bleedout across risk assets.“The whole week traded within the monday range. Weekly close gonna be bearish, looking like a pin bar,” popular trading account Crypto Yoddha told Twitter followers in a summary post. “Also consolidating at the range low. So need a bounce first before taking a position. Next week is gonna be important. (Q3 close + Monthly close).”Macro commentator Alex Krueger meanwhile noted that the Sep. 19 close marked Bitcoin’s lowest of 2022.”Thinking lower then higher,” he wrote in a Twitter discussion. “Replay of June CPI week on equities, crypto to outperform once bounce is on, as it has been showing relative strength (heavy spot buyers last two days). strong bounce =/ new multi-week upwards trend.”Unless a last-minute rebound entered, however, the largest cryptocurrency was on track for an even less enviable achievement — its lowest close since November 2020.BTC/USD 1-week candle chart (Bitstamp). Source: TradingViewMichaël van de Poppe, founder and CEO of trading firm Eight, added that volatility was all but guaranteed next week thanks to the precarious macro environment.Hand in hand with that, the U.S. dollar index (DXY) prepared to defend the new twenty-year highs claimed the week prior — over 113.2 and at the expense of multiple major fiat currencies.U.S. dollar index (DXY) 1-week candle chart. Source: TradingViewXRP takes the altcoin gains crownAmong the top ten altcoins, losses from the week were being shouldered chiefly by Ether (ETH), now down 8% as hype over the Merge faded.Related: The biggest Bitcoin fund just hit a record -35% discount — A warning for BTC price?The largest altcoin by market cap circled $1,300 at the time of writing, its lowest since mid-July. ETH/USD 1-week candle chart (Binance). Source: TradingViewThe only token bucking the trend was XRP, which continued to rally as the market hoped for a victory in the ongoing court battle between major investor Ripple and U.S. regulators.XRP/USD 1-week candle chart (Binance). Source: TradingViewThe views and opinions expressed here are solely those of the author and do not necessarily reflect the views of Cointelegraph.com. Every investment and trading move involves risk, you should conduct your own research when making a decision.

Čítaj viac

Získaj BONUS 8 € v Bitcoinoch

nakup bitcoin z karty

Registrácia Binance

Burza Binance

Aktuálne kurzy