Autor Cointelegraph By William Suberg

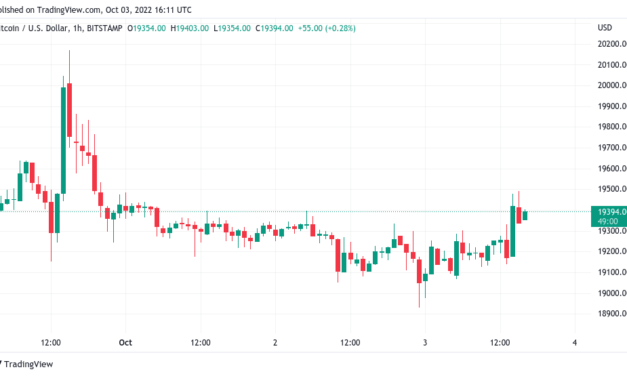
Bitcoin price sees first October spike above $20K as daily gains hit 5%

Bitcoin (BTC) saw its first trip above $20,000 on Oct. 4 as traders expected familiar resistance to cap gains.BTC/USD 1-hour candle chart (Bitstamp). Source: TradingViewMulti-week dollar lows fuel Bitcoin bullsData from Cointelegraph Markets Pro and TradingView showed BTC/United States dollar climbing prior to the Wall Street open, up over 5% in 24 hours.The pair had shaken off macroeconomic concerns at the start of the week, with trouble at Credit Suisse and the escalating Russia-Ukraine conflict failing to slow performance.Now, the short-term analysis focused on a run potentially topping out closer to $21,000 — as was the case late last month, as sell-side pressure at that level remained significant. “20500-21000 is a sell zone. If price gets there, which should, don’t be too bullish,” popular trader Il Capo of Crypto told Twitter followers on the day.Razzoorn, an analyst at international trade group The Birb Nest, noted that the current charge was Bitcoin’s fifth attempt at escaping a major liquidity cloud in several weeks.Despite the potentially limited upside opportunity, Bitcoin rallied in line with a broader risk asset tide which saw United States equities finish noticeably higher the day prior. At the same time, the U.S. dollar suffered, the U.S. dollar index (DXY) extending losses to approach 111 points and threaten support in place since mid-September.U.S. dollar index (DXY) 1-day candle chart. Source: TradingView“Up the market goes,” a more optimistic Michaël van de Poppe, CEO and founder of trading platform Eight, continued:“Flipping $19,500 for support. Now, if range-high at $19,600 holds for Bitcoin, I assume we’ll continue towards $22,400.”Altcoins attempt to change sticky trendAcross major altcoins, it was Ether (ETH) and Ripple (XRP) leading daily performance at the time of writing. Related: CoinShares’ Butterfill suggests ’continued hesitancy’ among investorsETH/USD traded above $1,350, still yet to break out of its sideways trend in place for several weeks since major losses entered during the post-Merge breakdown.ETH/USD 1-day candle chart (Binance). Source: TradingViewXRP, on the other hand, faced a more stubborn band of resistance after prior gains, bouncing off multi-week support just below $0.45.XRP/USD 1-day candle chart (Binance). Source: TradingViewThe views and opinions expressed here are solely those of the author and do not necessarily reflect the views of Cointelegraph.com. Every investment and trading move involves risk, you should conduct your own research when making a decision.

Čítaj viac

Bitcoin price sets October high with $20K in reach as US stocks rally

Bitcoin (BTC) climbed to new October highs at the Oct. 3 Wall Street open as Credit Suisse concerns heightened. BTC/USD 1-hour candle chart (Bitstamp). Source: TradingViewTraders close in on rangebound BTCData from Cointelegraph Markets Pro and TradingView showed BTC/USD taking aim at $19,500 after starting the month flat.The largest cryptocurrency reacted positively to lower than expected United States manufacturing data, while in Europe, market turmoil over Credit Suisse gathered pace despite executives’ reassurances.“We are kicking off October trading in the same congested area we ended September,” on-chain analytics resource Material Indicators wrote in one of several updates on the day. “The 21 DMA is behaving like a ceiling on BTC price, but expect it to be retested soon. Need it to do so for any shot at reclaiming the 20s.”Material Indicators was referring to Bitcoin’s 21-day moving average (MA) at around $19,400, this now potentially coming in for a resistance/ support flip.BTC/USD 1-day candle chart (Bitstamp) with 21MA. Source: TradingViewA further post revealed a proprietary trading indicator flashing “long” on daily timeframes, increasing hopes that bulls would be able to tackle the $20,000 mark.Analyzing the behavior of derivatives traders, however, William Clemente, co-founder of digital asset research and trading firm Reflexivity Research, warned that long positions were too eager to confirm a trend change.“Important to monitor the BTC derivatives market. For the time being, longs have been piling in on every move up in price,” he explained. “This is not what we want to see for a full on trend reversal (similar to the end of July 2021). We want to see participants conditioned to ‘fade’ rallies.”Order book data from Binance, the largest exchange by volume, meanwhile showed BTC/USD acting in a tight range bordered by sellers at $19,500 and bid interest around $19,150.Below that, support lay at $18,800 at the time of writing.BTC/USD order book data chart (Binance). Source: Material Indicators/ TwitterU.S. stocks make up losses as dollar coolsTurning to the macro situation, U.S. Purchasing Managers Index (PMI) data coming in below expectations pressured bond yields.Related: BTC price still not at ‘max pain’ — 5 things to know in Bitcoin this weekAt the same time, oil and silver, in particular, gained, while on equity markets, the S&P 500 and Nasdaq Composite Index were 1.8% and 1.3%, respectively.“Coming week more PMI data, unemployment and job openings will be coming in. The turn in markets? Seems like it,” Michaël van de Poppe, CEO and co-founder of trading firm Eight, responded as part of market commentary.Van de Poppe additionally described Bitcoin’s current trading range as “ultra boring” while hoping that crypto would copy silver’s performance.The U.S. dollar index (DXY), a classic headwind for crypto, slid below 112 points on the day.U.S. dollar index (DXY) 1-day candle chart. Source: TradingViewThe views and opinions expressed here are solely those of the author and do not necessarily reflect the views of Cointelegraph.com. Every investment and trading move involves risk, you should conduct your own research when making a decision.

Čítaj viac

BTC price still not at 'max pain' — 5 things to know in Bitcoin this week

Bitcoin (BTC) starts a new week in a precarious place as global macro instability dictates the mood.After sealing a weekly close just inches above $19,000, the largest cryptocurrency still lacks direction as nerves heighten over the resilience of the global financial system.Last week proved a testing time for risk asset investors, with gloomy economic data flowing from the United States and, moreover, Europe.The Eurozone thus provides the backdrop to the latest concerns of market participants, who are watching as the financial buoyancy of major banks is called into question.With the war in Ukraine only escalating and winter approaching, it is perhaps understandable that hardly anyone is optimistic — what could the impact be on Bitcoin and crypto? BTC/USD remains below its prior halving cycle’s all-time high, and as comparisons to the 2018 bear market flow in, so too is talk of a new multi-year low.Cointelegaph takes a look at five BTC price factors to watch in the coming days with Bitcoin still firmly below $20,000.Spot price avoids multi-year low weekly closeDespite the bearish mood, Bitcoin’s weekly close could have been worse — at just above $19,000, the largest cryptocurrency managed to add a modest $250 to last week’s closing price, data from Cointelegraph Markets Pro and TradingView shows.BTC/USD 1-week candle chart (Bitstamp). Source: TradingViewThat prior close had nonetheless been the lowest since November 2020 on weekly timeframes, and as such, traders continue to fear that the worst is yet to come.“The bears remained in full swing last night during the Asian, while the bulls failed to give us any good rallies to work off on,” popular trader Crypto Tony wrote in part of a Twitter update on the day.Others agreed with a summary which concluded that BTC/USD was in a “low volatility” zone which would necessitate a breakout sooner or later. All that was left was to decide on the direction.“Next big move is up,” Credible Crypto responded. “Typically prior to these major moves and after capitulation we see a period of low volatility before the next big move begins.”As Cointelegraph reported, the weekend was already tipped to provide a boost of volatility as suggested by Bollinger Bands data. This came hand in hand with rising volume, a key ingredient in sustaining a potential move.“Weekly chart BTC shows a massive increased volume since the beginning of the third quarter + weekly bullish divergence on one of the most reliable time frames,” fellow trading account Doctor Profit concluded. “Bitcoin price increase is just a matter of time.”Not everyone eyed an impending comeback, however. In predictions over the weekend, meanwhile, trader Il Capo of Crypto gave the area between $14,000 and $16,000 as a longer-term target.BTC/USD annotated chart. Source: Il Capo of Crypto/ Twitter“If this was the real bottom… bitcoin should be trading close to 25k- 26k by now,” trading account Profit Blue argued, showing a chart with a double bottom structure potentially in the making on the 2-day chart.Credit Suisse unnerves as dollar strength goes nowhereBeyond crypto, attention is coalescing around the fate of major global banks, in particular Credit Suisse and Deutsche Bank.Worries over liquidity resulted in emergency public reassurances from the CEO of the former, with executives reportedly spending the weekend calming major investors.Bank failures are a sore spot for underwater hodlers — it was government bailouts of lenders in 2008 which originally spawned Bitcoin’s creation.With history increasingly looking to rhyme nearly fifteen years later, the Credit Suisse saga is not going unnoticed.“We can’t see inside CeFi firm Credit Suisse — JUST LIKE we could not see inside of CeFi firms Celsius, 3AC, etc.,” entrepreneur Mark Jeffery tweeted on the day, comparing the situation to the crypto fund meltdowns earlier this year. For Samson Mow, CEO of Bitcoin startup JAN3, the current environment could yet give Bitcoin its time to shine in a crisis instead of staying correlated to other risk assets.“Bitcoin price is already pushed down to the limit, well below 200 WMA,” he argued, referring to the 200-week moving average long lost as bear market support.“We’ve had contagion from UST/3AC and leverage flushed already. BTC is massively shorted as a hedge. Even if Credit Suisse / Deutsche Bank collapse & trigger a financial crisis, can’t see us going much lower.”Nonetheless, with instability already rampant throughout the global economy and geopolitical tensions only increasing, Bitcoin markets are voting with their feet.The U.S. dollar index (DXY), still just 3 points off its latest twenty-year highs, continues to circle round for a potential rematch after limiting corrective moves in recent days.Looking further out, macro economist Henrik Zeberg repeated a theory that sees DXY temporarily losing ground in a major boost for equities. This, however, would not last.“In early 2023 DXY will once again rally with target of ~120. This will be Deflationary Bust – and Equities will crash in a larger bust than during 2007-09,” he wrote in part of a tweet. “Largest Deflationary Bust since 1929.”U.S. dollar index (DXY) 1-day candle chart. Source: TradingViewMiner revenue measure nears all-time lowWith Bitcoin price suppression grinding on, it is less than surprising to see miners struggle to maintain profitability. At one point in September, monthly selling from miners was in excess of 8,500 BTC, and while this number subsequently cooled, data shows that for many, the situation is precarious.“Bitcoin miner revenue per TeraHash on the edge of all time lows,” Dylan LeClair, senior analyst at digital asset fund UTXO Management, revealed at the weekend. “Margin squeeze.”Bitcoin miner revenue per terahash chart. Source: Dylan LeClair/ TwitterThe scenario is an interesting one for the mining ecosystem, which currently deploys more hash rate than at almost any time in history.Estimates from monitoring resource MiningPoolStats put current Bitcoin network hash rate at 261 exahashes per second (EH/s), only marginally below the all-time high of 298 EH/s seen in September.Competition among miners also remains healthy, as evidenced by difficulty adjustments. While seeing its first decrease since July last week, difficulty is set to add an estimated 3.7% in seven days’ time, taking it to new all-time highs of its own.Nonetheless, for economist, trader and entrepreneur, Alex Krueger, it may yet be premature to breathe a sigh of relief.“Bitcoin hash rate hitting all time highs while price goes down is a recipe for disaster rather than a cause for celebration,” he wrote in a thread about the miner data last month.“As miner profitability gets squeezed, odds of another round of miner capitulation increase in the event of a downmove. But hopium never dies.”Bitcoin network fundamentals overview (screenshot). Source: BTC.comGBTC “discount” hits new all-time lowEchoing the institutional exodus from BTC exposure this year, the space’s largest institutional investment vehicle has never been such a bargain.The Grayscale Bitcoin Trust (GBTC), which in the good times traded far above the Bitcoin spot price, is now being offered at its biggest-ever discount to BTC/USD.According to data from Coinglass, on Sep. 30, the GBTC “Premium” — now in fact a discount — hit -36.38%, implying a BTC price of just $11,330.The Premium has now been negative since February 2021.Analyzing the data, Venturefounder, a contributor to on-chain analytics platform CryptoQuant, described the GBTC drop as “absolutely wild.”“Yet still no sign of GBTC discount bottoming or reversing,” he commented. “Institutions are not even biting for $12K BTC (locked for 6 months).”GBTC premium vs. asset holdings vs. BTC/USD chart. Source: CoinglassCointelegraph has long tracked GBTC, with owner Grayscale attempting to get legal permission to convert and launch it as a spot exchange-traded fund (ETF) — something still forbidden by U.S. regulators.For the meantime, however, the lack of institutional appetite for BTC exposure is something of an elephant in the room.“Objectively, I would say there isn’t much interest in $BTC from U.S. based institutional investors until $GBTC starts getting bid closer to net asset value,” LeClair wrote last week.Charting Bitcoin’s “max pain” scenarioWhile it is safe to say that a fresh Bitcoin price drop would cause many a hodler to question their investment strategy, it remains to be seen whether this bear market will copy those which have gone before.Related: Analyst on $17.6K BTC price bottom: Bitcoin ‘not there yet’For analyst and statistician Willy Woo, creator of data resource Woobull, the next bottom could have a close relationship with hodler capitulation.Previously in Bitcoin’s history, bear market bottoms were accompanied by at least 60% of the BTC supply being traded at a loss.So far, the market has almost, but not quite, copied that trend, leading Woo to conclude that “max pain” may still be around the corner.“This is one way of visualising maximum pain,” he wrote alongside one of his charts showing underwater supply.“Past cycles bottomed when approx 60% of the coins traded below their purchase price. Will we hit this again? I don’t know. The structure of this current market this time around is very different.”According to on-chain analytics firm Glassnode, as of Oct. 2, 9.52 million BTC was being held at a loss. Last month, the metric in BTC terms hit its highest since March 2020.Bitcoin supply in loss chart. Source: GlassnodeThe views and opinions expressed here are solely those of the author and do not necessarily reflect the views of Cointelegraph.com. Every investment and trading move involves risk, you should conduct your own research when making a decision.

Čítaj viac

Bitcoin price starts 'Uptober' down 0.7% amid hope for final $20K push

Bitcoin (BTC) failed to hold $20,000 into the September monthly close as one trader eyed a final comeback before fresh downside.BTC/USD 1-hour candle chart (Bitstamp). Source: TradingViewTrader’s $20,500 upside target remainsData from Cointelegraph Markets Pro and TradingView showed BTC/USD staying lower after finishing the month at around $19,400.Capping 3% losses, the monthly chart failed to rally on Oct. 1, with BTC/USD down another 0.7% in “Uptober” so far, according to data from on-chain data resource Coinglass.BTC/USD monthly returns chart (screenshot). Source: CoinglassDismal financial data from macro markets contributed to the lack of appetite for risk assets, and among crypto traders, the outlook remained gloomy.For popular Twitter account Il Capo of Crypto, a return above the $20,000 mark was still possible on the day, this still to be followed by a dive much lower.An additional post noted steady buy-ins worth $192,000 on exchange FTX, something which he argued could contribute to the short-term upside.While still at the time of writing, BTC/USD looked apt for volatility into the weekly close, as suggested by the tightening Bollinger Bands on lower timeframes.BTC/USD 1-hour candle chart (Bitstamp) with Bollinger Bands. Source: TradingViewThe September close nonetheless continued a losing streak for Bitcoin which now rivaled the 2018 bear market, as highlighted by Caleb Franzen, senior market analyst at Cubic Analytics.“Bitcoin has officially produced 10 consecutive red monthly Heikin Ashi candles, with the September close,” he revealed. “This is the longest such streak since the 2018 bear market, which produced 14 red candles from Feb.’18 to Mar.’19. Each bear market streak has been longer than the last…”BTC/USD 1-month Heikin Ashi candle chart (Bitstamp). Source: TradingViewMajor banks sound alarm bells among analystsThe macro story of the moment revolved around major global banks, headlined by worrying signs coming out of Credit Suisse.Related: Bitcoin 2021 bull market buyers ‘capitulate’ as data shows 50% lossesThe Swiss lender’s share price, having all but collapsed since 2021, now had concern spreading to institutions such as Deutsche Bank, UniCredit and even Bank of China.“Credit Suisse is not the only major bank whose price-to-book is flashing warning signals.The list below is of all G-SIBs with PtBs of under 40%,” Alistair Macleod, head of research at Goldmoney, responded, uploading a comparative chart of various banks’ price to book ratios. “A failure of one of them is likely to call the survival of the others into question.”In a memo quoted by Reuters on Oct. 2, Credit Suisse CEO, Ulrich Koerner, cautioned investors against “confusing our day-to-day stock price performance with the strong capital base and liquidity position of the bank.”The events follow the Bank of England returning to quantitative easing (QE) last week in an unprecedented U-turn with inflation at forty-year highs.The views and opinions expressed here are solely those of the author and do not necessarily reflect the views of Cointelegraph.com. Every investment and trading move involves risk, you should conduct your own research when making a decision.

Čítaj viac

Bitcoin 2021 bull market buyers ‘capitulate’ as data shows 50% losses

Bitcoin’s (BTC) spot trading below $20,000 is seeing a new “capitulation” event encompassing an entire year’s worth of buyers, research reveals.In one of its Quicktake market updates on Sept. 29, on-chain analytics platform CryptoQuant flagged intense selling by a large number of recent hodlers.2021 bull market coins “have been sold aggressively”As BTC/USD lingers near levels barely seen since 2020, it is not just miners feeling the pinch.Analyzing Bitcoin’s Exchange Inflow Spent Output Ages Bands (SOAB), CryptoQuant contributor Edris showed that those who bought between April 2021 and April 2022 have been selling coins en masse — for less than they bought them.“Looking at the chart, it is evident that coins aged between 6–18 months ago have been sold aggressively recently,” he concluded.“These coins have been bought between April 2021 and April 2022 at prices above $30K. This signal means that many holders who have entered the market during the 2021 bull market and above the $30K mark, have recently capitulated and exited the market at an approximate 50% loss.”Bitcoin exchange inflow Spent Output Age Bands (SOAB) chart (screenshot). Source: CryptoQuantSuch events should not be taken lightl because they tend to occur at the bottom of bear markets. The only question is whether the recent macro bottom in June at $17,600 will be this one’s floor.Edris added:“These types of capitulations tend to occur during the last months of a bear market, pointing to a potential bottom formation in the near future.” Profit warning meets profit potentialInvestigating Bitcoin’s Spent Output Profit Ratio (SOPR) metric, meanwhile, fellow CryptoQuant contributor Caue Oliveira highlighted another historical bear market trend repeating itself.Related: Bitcoin price due ‘big dump’ after passing $20K, warns traderSOPR divides the price paid for an amount of BTC by the price it is sold at. The resulting figure fluctuates around 1, with values below indicative of a bear market as investors begrudgingly shoulder net losses.According to data from fellow on-chain analytics firm Glassnode, as of Sept. 29, entity-adjusted SOPR was just over 0.95.The metric is trending back towards 1, having seen a local bottom in June, suggesting that the prime buying opportunity may have already hit.“Looking at the on-chain spending pattern of long-term holders, measured through the Spent Output Profit Ratio… we can find the biggest selling points at a loss,” Oliveira wrote.“Historically these points have been the best risk-adjusted entries in the last two bear market floors.”Looking ahead, a “maximum pressure point” for long-term holders (LTHs) is on the cards, he added, referencing selling pressure decreasing as SOPR inches higher.Bitcoin entity-adjusted Spent Output Profit Ratio (SOPR) chart. Source: GlassnodeThe views and opinions expressed here are solely those of the author and do not necessarily reflect the views of Cointelegraph.com. Every investment and trading move involves risk, you should conduct your own research when making a decision.

Čítaj viac

Získaj BONUS 8 € v Bitcoinoch

nakup bitcoin z karty

Registrácia Binance

Burza Binance

Aktuálne kurzy