Autor Cointelegraph By William Suberg

Bitcoin price threatens $19K support ahead of ‘most hyped’ CPI print

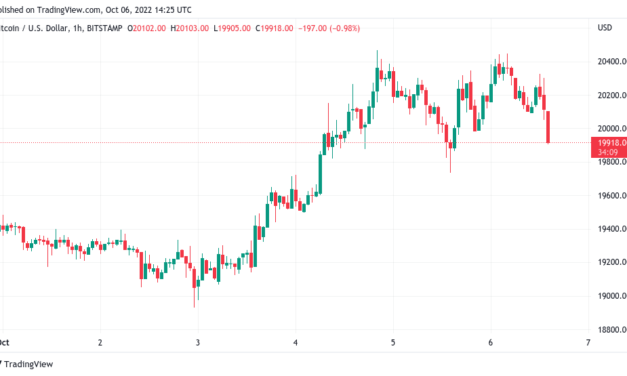
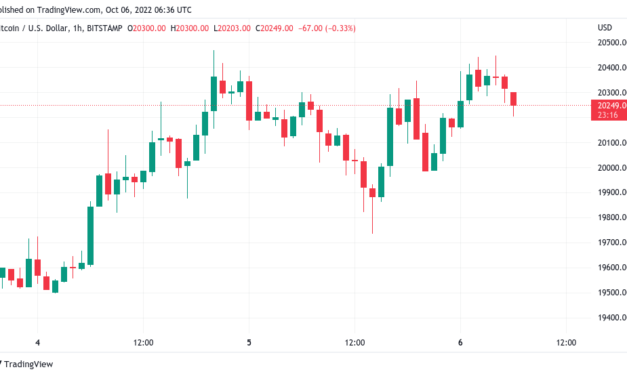
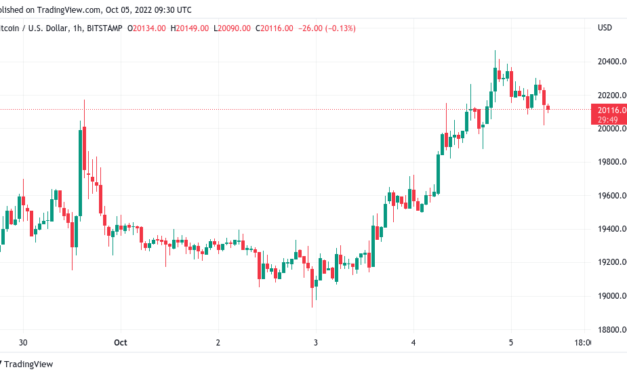
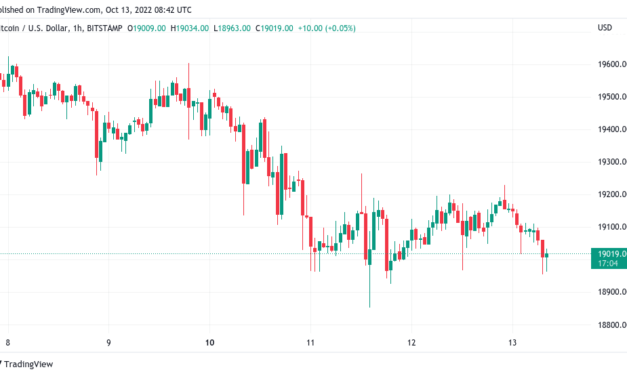
Bitcoin (BTC) began Oct. 13 with classic fluctuations around $19,000 as markets prepared for crucial macro data.BTC/USD 1-hour candle chart (Bitstamp). Source: TradingViewNo sign of upside ahead of key U.S. dataData from Cointelegraph Markets Pro and TradingView showed BTC/USD threatening downside at the time of writing with hours to go until the United States Consumer Price Index (CPI) print for September.Expected at 6.5% year-on-year as per a Bloomberg survey, core inflation was tipped to unsettle risk asset markets by showing a potential reversal of previously falling inflation numbers.CPI itself was expected to decrease modestly to 8.1% from its previous 8.3% year-on-year gains.“Markets selling off as fears go through the roof for CPI today,” Michaël van de Poppe, CEO and founder of trading firm Eight, wrote in a fresh Twitter update:“Maybe most hyped data point of the year.”Known as a source of volatility, CPI events have often sparked unusual short-term price moves both up and down, these frequently reversing multiple times to trap opportunistic speculative trades.Analyzing market composition, data resource Material Indicators, meanwhile, eyed Binance whales increasing asks following above-expected Producer Price Index (PPI) numbers the day prior. “Whales are suppressing price with ~$20M in asks trying to get bids filled. PPI came in hotter than expected. CPI and Jobless Reports tomorrow at 8:30am ET. Things are about to get spicy,” it summarized.A subsequent chart of the BTC/USD order book on Binance showed a cluster of resistance above the spot price, with a lack of buyer support in place much above $18,500.BTC/USD order book chart (Binance). Source: Material Indicators/ TwitterMarket “waiting for resolution” of tight rangeAs Cointelegraph reported, even going into CPI day, Bitcoin had stayed unusually calm.Related: Biggest mining difficulty spike in 14 months — 5 things to know in Bitcoin this weekDespite the unpredictability of risk asset markets more broadly in the current climate, the largest cryptocurrency managed to keep volatility practically nonexistent.This in itself suggested that violent change would come, analysts explained, eyeing the Bitcoin historical volatility index (BVOL) as proof.On the day, BVOL measured just under 23, among its lowest-ever recorded levels and those seen only a handful of times in Bitcoin’s lifetime.“The range on $btc LTF is so suppressed, BVOL is gearing up for big move,” popular trading account TMV Crypto warned on the day. TMV Crypto added that the market had been “stuck” for several days and had been “waiting for today for resolution,” referring to the CPI release.Bitcoin historical volatility index (BVOL) 1-day candle chart. Source: TradingViewThe views and opinions expressed here are solely those of the author and do not necessarily reflect the views of Cointelegraph.com. Every investment and trading move involves risk, you should conduct your own research when making a decision.

Čítaj viac

'Violent' Bitcoin breakout due as BTC open interest nears all-time high

Bitcoin (BTC) stayed rangebound at the Oct. 6 Wall Street open with traders already planning for a “violent” breakout.BTC/USD 1-hour candle chart (Bitstamp). Source: TradingViewBitcoin whale activity highlights the importance of $19,000Data from Cointelegraph Markets Pro and TradingView followed BTC/USD as it moved up and down by only a matter of a few hundred dollars on the day.The amount of $20,000 formed a focus for the pair, which meandered in step with consolidating U.S. equities and dollar strength.With no spot catalyst in sight on short timeframes, on-chain analytics resource Whalemap turned to largescale buy and sell points to sketch out likely support and resistance.To the downside, $19,174 marked the site of whale buy-ins, suggesting its continued strength as a line in the sand.Bullish progress, meanwhile, would have to contend with a cloud of resistance at $21,500.“Don’t be distracted by the noise,” the Whalemap team commented alongside a chart showing the key levels overnight.BTC/USD annotated chart. Source: Whalemap/ TwitterAs Cointelegraph reported, $19,000 was already on the radar, reflecting the broader aggregate price sold for the BTC supply — Bitcoin’s so-called “investor cost basis.”Elsewhere, others targeted $21,000 as a likely turning point should a spate of bullishness kick in.Futures open interest approaches a record 604,000 BTCOn longer timeframes, meanwhile, popular trading account Daan Crypto Trades flagged an impending triangle breakout for BTC/USD after weeks of comparative sideways trading.Related: BTC price still not at ‘max pain’ — 5 things to know in Bitcoin this week”$BTC The only two lines you need for the next week,” he summarized.BTC/USD annotated chart. Source: Daan Crypto Trades/ TwitterOn derivatives markets, traders were steadily adding dry powder, which could fuel a “violent” end to the status quo.“As bitcoin consolidates around $20,000, BTC denominated futures open interest sits just below all time highs at 604k BTC,” Dylan LeClair, senior analyst at UTXO Management wrote in a dedicated thread on the day. “Whether up or down, when bitcoin breaks out of its current range, it’ll likely be a violent move.”LeClair noted that the all-time high in open interest was mainly collateralized by stablecoins, marking a distinct change from the heavy upside volatility seen in April 2021, when BTC/USD hit $58,000.Bitcoin futures open interest chart. Source: Dylan LeClair/ TwitterThe views and opinions expressed here are solely those of the author and do not necessarily reflect the views of Cointelegraph.com. Every investment and trading move involves risk, you should conduct your own research when making a decision.

Čítaj viac

Bitcoin beats out shorts as BTC price attempts to crack $20.5K

Bitcoin (BTC) reclaimed and held $20,000 into Oct. 6 as the latest rebound punished short speculators.BTC/USD 1-hour candle chart (Bitstamp). Source: TradingViewBitcoin preserves “important” $19,600 zoneData from Cointelegraph Markets Pro and TradingView showed BTC/USD bouncing from local lows of $19,740 on Bitstamp around the Oct. 5 Wall Street open.The pair then reversed prior losses, leading early shorters into $20 million in liquidations in 24 hours.BTC liquidiations chart (screenshot). Source: CoinglassAt the time of writing, Bitcoin traded around $20,250, having gone on to reach $20,447 on the day.Michaël van de Poppe, CEO and founder of trading firm Eight, had flagged the lows as a suitable entry point.“Correction indeed taking place in which $19.8K-$19.9K is an area to look for longs, but also a retest around $19.6K is an important one for Bitcoin,” he wrote at the time.Popular trader Il Cap of Crypto meanwhile reiterated his existing thesis over short-term crypto market prospects. BTC/USD should continue rising, he argued, before a decisive rejection sends the market below its recent trading range.“Expectation is 3-6% move up on the entire market, average,” he predicted. “Some shitcoins might be the exception and have higher returns. Then I would like to see bearish signs, but yeah, that resistance should hold. We would then see a strong bearish move towards new lows.”The U.S. dollar index (DXY), descending from highs though the week, continued to see comparative weakness, helping buoy the mood among risk assets.U.S. dollar index (DXY) 1-hour candle chart. Source: TradingViewAnalyst sees S&P 500 losing 500 pointsThe crypto forecast meanwhile tied in with expectations of a comedown for United States equities, with which Bitcoin and crypto remain highly correlated.Related: Bitcoin repeats key bear market move as $19K becomes key BTC price zoneIn a Twitter thread on Oct. 5, Jurrien Timmer, director of global macro at asset manager Fidelity Investments, said that the S&P 500 reading of 3,300 would represent “fair value.”The Index was up around 2.5% over the week, finishing the Oct. 5 trading session at 3,783.“A major buy signal won’t happen until the Fed pivots or the market undershoots the fair value,” Timmer explained.He added that the markets en masse were “at the mercy of the Fed cycle” of interest rate hikes.According to estimates from CME Group’s FedWatch Tool, the November hike was more likely to match the previous two at 75 basis points.Fed rate hike probabilities chart. Source: CME GroupThe views and opinions expressed here are solely those of the author and do not necessarily reflect the views of Cointelegraph.com. Every investment and trading move involves risk, you should conduct your own research when making a decision.

Čítaj viac

Bitcoin repeats key bear market move as $19K becomes key BTC price zone

Bitcoin (BTC) holding $19,000 could be more important than traders realize, new data reveals.In the latest edition of its monthly report series, “The Bitcoin Monthly,” investment management firm ARK Invest flagged an ongoing battle for the defense of Bitcoin’s investor cost basis.Bitcoin investor cost basis buoys marketBitcoin price action is currently characterized by volatile moves within a clearly defined range only around $4,000 across.Having held since June, this range contains what immediately stands out as a focal point — the prior halving cycle’s all-time high of $20,000. With BTC/USD crossing that threshold frequently, however, traders have long sought alternative lines in the sand when it comes to new trends for the pair.For ARK and the report’s guest contributor, Reflexivity Research co-founder William Clemente, it is $19,000, which could function as important support.This is due to Bitcoin’s so-called investor cost basis — the aggregate price at which the BTC supply was bought, minus the portion owned by miners.“For most of September, bitcoin traded between two major historical levels: its 200-week moving average ($23,500) as resistance and its investor cost basis as support ($19,000),” ARK explained.BTC price is now at $19,000, which is the level that, if violated, would spark considerable losses throughout Bitcoin’s investor base.“As strong holder behavior battles a weak macro environment, resolution to either side will play a significant role in bitcoin’s short- to mid-term performance,” the report added.Bitcoin 200-week moving average vs. investor cost basis chart (screenshot). Source: ARK InvestAs Cointelegraph reported this week, analysts are keenly eyeing the overall proportion of the supply currently being held at a loss. In prior bear markets, this always crossed 60% before a price bottom hit, leading them to conclude that in 2022, the market has further left to fall. Investor cohorts echo 2018 behaviorFurther figures covering the losses of long-term holders (LTHs) paint a similar picture as of mid-September — BTC price action could target $14,000 before echoing prior bear market bottoms.Related: Bitcoin still has $14K target, warns trader as DXY due ‘parabola’ breakContinuing, ARK noted that the cost basis of LTHs and short-term holders (STHs) had crossed over for the first time since 2018 — the year t saw the macro bottom of $3,100 in late Q4.An STH is defined as an entity holding BTC for up to 155 days, with LTHs making up investments for longer periods.“The short-term-holder (STH) cost basis has crossed below the longterm-holder cost (LTH) basis, a signal usually correlated with high-conviction market bottoms,” the report commented.“Likely a sign of low speculative excesses, this cross suggests that short-term holders have capitulated or are aging into longterm holders.”Bitcoin LTH and STH cost basis chart (screenshot). Source: ARK InvestThe views and opinions expressed here are solely those of the author and do not necessarily reflect the views of Cointelegraph.com. Every investment and trading move involves risk, you should conduct your own research when making a decision.

Čítaj viac

Bitcoin still has $14K target, warns trader as DXY due ‘parabola’ break

Bitcoin (BTC) held $20,000 into Oct. 5 with trader targets still including a fresh high before rejection.BTC/USD 1-hour candle chart (Bitstamp). Source: TradingView$21,000 upside target to precede new lowsData from Cointelegraph Markets Pro and TradingView showed BTC/USD reaching $20,470 on Bitstamp overnight before returning lower.The pair succeeded in maintaining the 2017 old all-time high as support, something on-chain analytics resource Material Indicators had hoped would endure as a positive sign.“BTC is still in a congested range,” it summarized in comments the day prior:“The retest of technical resistance at the 50-Day MA was rejected. Now I want to see a retest of support at the 2017 Top. Bulls may be losing momentum, but placed a buy wall at $20k to hold price up.”Material Indicators was analyzing a chart of the Binance BTC/USD order book showing investor behavior involving different-sized transactions.It referred to its 50-day moving average (MA), which at $20,170 had still not flipped to decisive support on the day.BTC/USD 1-day candle chart (Bitstamp) with 50MA. Source: TradingViewPopular trader Il Capo of Crypto, meanwhile, continued an extant thesis involving a trip to $21,000 before a steeper more enduring comedown.“Local top is not in yet imo, but it’s very very close,” he told Twitter followers:“20500-21000 hasn’t been touched and there’s no ltf distribution. Expecting the last leg up soon. Then ltf bearish signs, and reversal to new lows (14k-16k).”BTC/USD annotated chart. Source: Il Capo of Crypto/ TwitterSigns of good times ending for U.S. dollarTurning to the United States dollar index (DXY), a key macro trigger for crypto markets, there was some relief on the horizon. Related: BTC price still not at ‘max pain’ — 5 things to know in Bitcoin this weekA fresh 20-year high was still due, according to Il Capo of Crypto, but this would be followed by a longer-term break of the “parabola” in place on dollar strength since 2021.“We could see a push deeper into the box giving BTC/SPX more time to rally,” fellow trader Mayne explained in an accompanying thread, also mentioning the S&P 500.“If this area fails, we could see a break in the dollar’s parabolic ascent and perhaps a much longer sustained rally.”DXY circled 110.6 points at the time of writing, having narrowly preserved 110 as support — still marking its lowest levels since Sept. 21.U.S. dollar index (DXY) 1-day candle chart. Source: TradingViewThe views and opinions expressed here are solely those of the author and do not necessarily reflect the views of Cointelegraph.com. Every investment and trading move involves risk, you should conduct your own research when making a decision.

Čítaj viac

Získaj BONUS 8 € v Bitcoinoch

nakup bitcoin z karty

Registrácia Binance

Burza Binance

Aktuálne kurzy