Autor Cointelegraph By William Suberg

‘No emotion’ — Bitcoin metric gives $35K as next BTC price macro low

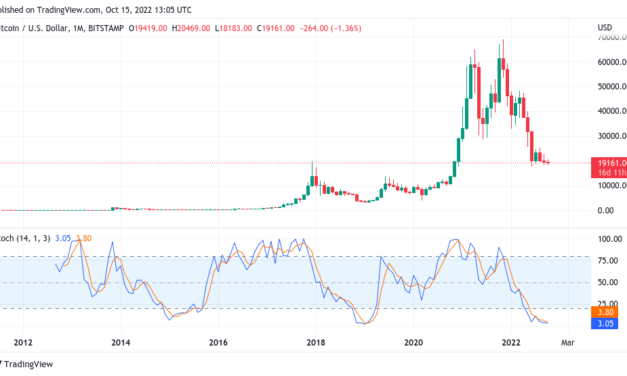
Bitcoin (BTC) is showing textbook macro bottom signs in a “business as usual” bear market, data suggests.In fresh findings published on Oct. 13, popular Twitter trader Alan revealed that BTC price action is closely mimicking prior cycles.Trader on Stoch data: “Don’t be shaken out”While some are concerned about the current state of Bitcoin and crypto markets, on-chain indicators have long suggested that the 2022 bear market is comfortingly similar to previous ones.Eyeing the one-month stochastic chart for BTC/USD, Alan highlighted Bitcoin repeating a structure common to both the 2014 and 2018 bear markets.Stochastic oscillators are classic tools for identifying price cycles and bullish and bearish interplay.Bitcoin has proved to be no exception, with monthly low Stochastic readings perfectly matching bear market price floors, data from Cointelegraph Markets Pro and TradingView confirms.Now, those low levels are back — numbers which have only appeared three times before.BTC/USD 1-month candle chart (Bitstamp) with Stochastic indicator. Source: TradingViewNot only is Stoch calling for an imminent new macro BTC price low, but it can also be used to determine where Bitcoin might bottom in the future.Inferring potential price points from existing data, Alan predicted the next cycle’s low could be $35,000.“Bitcoin forms Flag over the previous Flag configuration. Yellow zone form Stochastic indicator shows (at least) second half of the flag, where we are right now,” he commented alongside the chart. “Next pole low = $35k. Quick rebound always follows a dip. No emotion, don’t be shaken out.”BTC/USD annotated chart. Source: Trader Tardigrade/ TwitterA much-needed silver liningPhenomena such as Stoch behavior may well console traders who have watched as Bitcoin descends up to 75% from all-time highs just eleven months ago.Related: Price analysis 10/14: SPX, DXY, BTC, ETH, BNB, XRP, ADA, SOL, DOGE, MATICWith popular sources insisting that the bottom is not yet in, there appears to be little to be confident about while analyzing short-timeframe BTC price action.Optimists are few and far between, among them well-known analyst Philip Swift, who this week predicted to Cointelegraph that the 2022 bear market should end up being just that — done and dusted by the end of the year.Others are less hopeful. On the topic of financial asset values in general, Goldmoney senior analyst Alasdair Macleod this week told investors to forget about the good times until the United States Federal Reserve changes course on interest rate hikes.The views and opinions expressed here are solely those of the author and do not necessarily reflect the views of Cointelegraph.com. Every investment and trading move involves risk, you should conduct your own research when making a decision.

Čítaj viac

Bitcoin trader predicts $18K return within days as stocks wilt post-CPI

Bitcoin (BTC) cooled near $19,200 after the Oct. 14 Wall Street open as stocks struggled to preserve their “bear trap.”BTC/USD 1-hour candle chart (Bitstamp). Source: TradingViewAnalyst: “Abandon all hope” for asset price reboundData from Cointelegraph Markets Pro and TradingView followed BTC/USD as it came off one-week highs on the day to circle $19,300.The pair had seen intense volatility on the back of United States economic data the day prior, this sparking hundreds of millions of dollars in liquidations from both long and short positions.Now, after turning the tables and adding almost $2,000 in 24 hours, Bitcoin was again losing momentum as U.S. equities turned red on the day.At the time of writing, the S&P 500 was down 1.9%, while the Nasdaq Composite Index traded a gruesome 5.4% lower.Investigating the status quo, Alasdair Macleod, head of research at Goldmoney, pointed to rampant gains in long-dated U.S. bonds as a key factor in the pressure being felt across markets.“US Try bond yields continue to soar,” he commented. “So long as this is the case abandon all hope for financial asset values.”The U.S. dollar index, a classic headwind maker for risk assets, made strong progress on the day, passing 113.4 before consolidating.U.S. dollar index (DXY) 1-hour candle chart. Source: TradingViewWith the September Consumer Price Index (CPI) print released, sentiment was now overwhelmingly leaning toward the Federal Reserve enacting a further 75-basis-point rate hike in November.According to CME Group’s FedWatch Tool, the odds of a lower 50-point hike were just 2.1% as of Oct. 14.Fed target rate probabilities chart. Source: CME GroupMacleod meanwhile noted that even under existing dollar strength, major world currencies were showing increasing strain, among them the Japanese yen and, increasingly, the Chinese yuan. The former traded at its lowest versus the U.S. dollar in 34 years on the day.Pundits see BTC bears winning outPlanning ahead, Bitcoin analysts continued to favor downside regaining control of short-term BTC price action.Related: Bitcoin bear market will last ‘2-3 months max’ —Interview with BTC analyst Philip SwiftIl Capo of Crypto reiterated an existing theory involving a push to near $21,000 before a new macro bottoming sequence ensued.Closer to home, Jibon, known as Trader_J, saw the current highs petering out at or above $20,000, with a trip to the lows near $18,000 on the menu in the coming days.BTC/USD annotated chart. Source: Trader_J/ TwitterFor Michaël van de Poppe, founder and CEO of trading firm Eight, the current spot price was an important line in the sand.”Bitcoin broke up even more, through which the area around $19.4K is important to sustain,” he concluded on the day. “Probably long area. If it holds, finally, we can project $20.8K and $22.4K.”BTC/USD annotated chart. Source: Michaël van de Poppe/ TwitterThe views and opinions expressed here are solely those of the author and do not necessarily reflect the views of Cointelegraph.com. Every investment and trading move involves risk, you should conduct your own research when making a decision.

Čítaj viac

Bitcoin bear market will last '2-3 months max' —Interview with BTC analyst Philip Swift

Bitcoin (BTC) may see more pain in the near future, but the bulk of the bear market is already “likely” behind it.That is one of many conclusions from Philip Swift, the popular on-chain analyst whose data resource, LookIntoBitcoin, tracks many of the best-known Bitcoin market indicators.Swift, who together with analyst Filbfilb is also a co-founder of trading suite Decentrader, believes that despite current price pressure, there is not long to go until Bitcoin exits its latest macro downtrend.In a fresh interview with Cointelegraph, Swift revealed insights into what the data is telling analysts — and what traders should pay attention to as a result.How long will the average hodler need to wait until the tide turns and Bitcoin comes storming back from two-year lows?Cointelegraph (CT): You’ve pointed out that some on-chain metrics such as HODL Waves and RHODL Ratio are hinting at a BTC bottom. Could you expand on this? Are you confident that history will repeat this cycle?Philip Swift (PS): I believe we are now at the point of maximum opportunity for Bitcoin. There are numerous key metrics on LookIntoBitcoin that indicate we are at major cycle lows. We are seeing the percentage of long-term holders peak (1yr HODL Wave), which typically happens in the depths of bear market as these long-term holders don’t want to take profit until price moves higher. This has the effect of restricting available supply in the market, which can cause price to increase when demand does eventually kick back in. Bitcoin HODL Waves chart. Source: LookIntoBitcoinWe are also seeing metrics like RHODL Ratio dip into their accumulation zones, which shows the extent to which euphoria has now been drained from the market. This removal of positive sentiment is necessary for a bottom range to form for BTC. RHODL Ratio is highlighting that the cost basis of recent Bitcoin purchases is significantly lower than prices paid 1–2 years ago when the market was clearly euphoric and expecting +$100k for Bitcoin. So it is able to tell us when the market has reset in preparation for the next cycle to start.Bitcoin RHODL ratio chart. Source: LookIntoBitcoinCT: How is this bear market different from previous BTC cycles? Is there any silver lining?PS: I was around for the 2018/19 bear market and it actually feels pretty similar. All the tourists have left and you just have the committed passionate crypto people remaining in the space. These people will benefit the most in the next bull run — as long as they don’t go crazy trading with leverage.In terms of silver linings, I have a couple! First, we are actually a fair way through the market cycle, and likely through the majority of this bear market already. The chart below shows Bitcoin performance each cycle since the halvening, and we are already around the capitulation points of the previous two cycles. Bitcoin bull market comparison chart. Source: Philip Swift/ DecentraderSecond, the macro context is very different now. While it has been painful for bulls to see Bitcoin and crypto so heavily correlated to struggling traditional markets, I believe we are soon going to see a bid on Bitcoin as confidence in (major) governments crosses downwards beyond a point of no return. I believe this lack of confidence in governments and their currencies will create a rush towards private “hard” assets, with Bitcoin being a major beneficiary of that trend in 2023. CT: What other key on-chain metrics would you also recommend to keep an eye on to spot the bottom?PS: Be wary of Twitter personalities showing Bitcoin on-chain charts cut by exotic/ weird variables. Such data very rarely adds any genuine value to the story shown by the major key metrics and these personalities just do it as a way to grab attention rather than genuinely trying to help people. Two metrics that are particularly useful in the current market conditions:MVRV Z-score is an important and widely used metric for Bitcoin. It shows the extremes of Bitcoin price moving above or below its realized price. Realized price is the average cost basis of all bitcoins purchased. So it can be thought of as an approximate break-even level for the market. Price only ever dips below that level in extreme bear market conditions. When it does, the indicator on this chart dips into the green “accumulation” zone. We are currently in that zone, which suggests that these may be very good levels for the strategic long-term investor to accumulate more bitcoin.Bitcoin MVRV Z-Score chart. Source: LookIntoBitcoinPuell Multiple: Looks at miner revenues versus their historical norms. When the indicator dips into the green accumulation band, like it is now, it shows many miners are under significant stress. This often occurs at major cycle lows for Bitcoin. This indicator suggests we are close to a major cycle low for Bitcoin if we have not already bottomed.Bitcoin Puell Multiple chart. Source: LookIntoBitcoinCT: Your fellow analyst Filbfilb expects BTC to reverse course in Q1 2023. Do you agree?PS: Yes, I do. I think traditional markets probably have a bit more downturn going into early 2023. At worst I see crypto having a tough time until then, so probably another 2-3 months max. But I think the majority of fear will soon switch towards governments and their currencies — rightly so. Therefore I do expect private assets like Bitcoin to outperform in 2023 and surprise many of the doomers who are saying Bitcoin has failed and is going to zero. Related: Bitcoin analyst who called 2018 bottom warns ‘bad winter’ may see $10K BTCCT: October is a historically bad month for stocks — not so much for Bitcoin. How long do you expect BTC to be in lockstep with risk-on assets and what will be the catalyst?PS: Bitcoin has been a useful forward-looking risk indicator for the markets throughout much of 2022. What will change in 2023 is that market participants will appreciate most of the risk in fact lies with governments, not with traditionally defined “risk” assets. As a result, I expect a narrative shift that will benefit Bitcoin next year. The actions of the UK government around their mini-budget two weeks ago were a key turning point for that potential narrative shift. Markets showed they were prepared to show their disapproval of poor policy and incompetence. I expect that trend to accelerate not only for the UK but in other countries also.CT: Are you surprised at Ethereum’s poor performance post-Merge? Are you bullish on ETH longer term with its supply-burning mechanisms?PS: ETH had a strong short-term narrative with the Merge, but it was within the context of a global bear market. So it is not surprising that its price performance has been lackluster. Ultimately the overall market conditions dominated which was to be expected. Long term though Ethereum is set up to do exceptionally well. It is a critical component of Web3, which is growing exponentially. So I am very bullish on Ethereum over the next couple of years.CT: What is the best jurisdiction for a Bitcoin/ crypto trader today?PS: Somewhere that is low-tax and crypto-friendly. I personally think Singapore is great and there is a growing crypto scene here which is good fun too. I have friends who are in Bali which also sounds great and is more affordable.CT: Anything you would like to add?PS: Resist any temptation to quit crypto near the bottom of the bear market. Just be patient and use some good tools to help manage your emotions.The views and opinions expressed here are solely those of the author and do not necessarily reflect the views of Cointelegraph.com. Every investment and trading move involves risk, you should conduct your own research when making a decision.

Čítaj viac

Bitcoin ‘bear trap’ sees BTC price near $20K as daily gains top 9%

Bitcoin (BTC) delivered more surprises on Oct. 14 as the reaction to macro triggers saw a sudden run at $20,000.BTC/USD 1-hour candle chart (Bitstamp). Source: TradingViewStocks, crypto smoke shortsData from Cointelegraph Markets Pro and TradingView showed BTC/USD climbing to one-week highs, gaining almost $2,000 in hours.After the United States Consumer Price Index (CPI) print for September came in above expectations, an initial crypto rout put bulls on edge, but the pain was short lived.Bitcoin ultimately ran higher than its pre-CPI levels, following stocks that were described as delivering the “biggest bear trap of 2022.”“That’s gotta be the biggest bear trap I’ve seen so far,” popular Twitter trading account Stockrocker reacted:“Even I was starting to feel quite bearish.”S&P 500 1-hour candle chart. Source: TradingViewBitcoin thus kept volatility — and liquidations — coming as spot price bounced around an established trading range.Popular Twitter analytics account On-Chain College noted that liquidations in a single hour on the day were the highest on those timeframes in over a month.Data from monitoring resource Coinglass put total BTC liquidations at $116 million in the 24 hours to the time of writing. Cross-crypto liquidations totaled $327 million.Crypto liquidations chart. Source: CoinglassWhile failing to reclaim the $20,000 mark, Bitcoin was succeeding in flipping traders’ outlook to the bullish side. Analyzing chart behavior stretching back to 2019, Credible Crypto argued that the signals were there for an extended upside breakout.“Our last two major impulses were both preceded by around 120 days of relatively low-volatility consolidation before they began,” he summarized:“It’s supposed to be boring- it’s part of the process. The more boring it gets the better it is for the coming expansion.”BTC/USD annotated chart. Source: Credible Crypto/ TwitterTrader on future bottom: CPI move “isn’t it”Attention thus focused on whether markets could preserve the status quo at the end of the week.Related: Why is the crypto market down today?In a sign of potential trouble brewing, the U.S. dollar index (DXY) began clawing back lost ground on the day in what could yet take the momentum out of the risk asset rally.Summarizing the situation, popular trader Roman said that while it paid to be “macro bearish,” there was no reason to ignore the signs of what should be a temporary relief rally.“Yes I am macro bearish but this move down isn’t it,” part of a Twitter thread read:“There’s bullish divergence on every higher timeframe and the DXY has bear divs. USDT.D rejected resistance as well. Tiny brained investors shorting the bottom yet again.”U.S. dollar index (DXY) 1-hour candle chart. Source: TradingViewThe views and opinions expressed here are solely those of the author and do not necessarily reflect the views of Cointelegraph.com. Every investment and trading move involves risk, you should conduct your own research when making a decision.

Čítaj viac

BTC price hits 3-week lows on US CPI as Bitcoin liquidates $57M

Bitcoin (BTC) delivered classic volatility on Oct. 13 as United States economic data shook markets.BTC/USD 1-hour candle chart (Bitstamp). Source: TradingViewTrader sticks by $21,000 targetData from Cointelegraph Markets Pro and TradingView followed BTC/USD as it presented some textbook moves to accompany the U.S. Consumer Price Index (CPI) print for September.Coming in at 0.1% above expectations year-on-year, the September figures immediately made themselves felt, with risk assets selling off and the dollar advancing in the face of ongoing inflation pressures.In line with previous CPI events, Bitcoin saw a fakeout to the upside, which vanished in minutes, leading to protracted downside which only bottomed at $18,183 on Bitstamp.A rebound took the largest cryptocurrency to $18,800, having seen its lowest since Sep. 22.Traders both long and short felt the burn, with combined 24-hour liquidations totaling $57 million according to data from Coinglass.Bitcoin liquidations chart. Source: Coinglass“THE BOTTOM isn’t in,” analytics resource Material Indicators summarized alongside order book data from Binance.The accompanying chart showed support at $18,000 massing on BTC/USD, providing at least a temporary support level.BTC/USD order book chart (Binance). Source: Material Indicators/ TwitterDespite being down 4% on the day, Bitcoin was nonetheless in line for a bear market bounce, popular trader Il Capo of Crypto insisted.Continuing an existing theory, a Twitter post on the day called for a rally to $21,000 before the real macro bottom emerged, this tipped to be between $14,000 and $16,000.“I didn’t expect this move to go this low. In fact I expected the bounce to come earlier,” Il Capo of Crypto wrote about the post-CPI dip.“With this being said, SPX is pumping and DXY dumping. $BTC still at support. This could be a massive bear trap. Bounce to 21k is still in play.”BTC/USD annotated chart. Source: Il Capo of Crypto/ TwitterDollar dives after initial gainsThe CPI event did not appear to dent stock market confidence, meanwhile, with U.S. indexes rising on the Wall Street open.Related: Bitcoin eyes ‘textbook’ bottom as $16K whale cost basis comes into playAt the time of writing, the S&P 500 and Nasdaq Composite Index were up 0.3% and 0.6%, respectively.The U.S. dollar index (DXY), having gained earlier on the day, saw a dramatic retracement to target 112.5 points, helping alleviate pressure on highly-correlated crypto markets.U.S. dollar index (DXY) 1-hour candle chart. Source: TradingViewThe views and opinions expressed here are solely those of the author and do not necessarily reflect the views of Cointelegraph.com. Every investment and trading move involves risk, you should conduct your own research when making a decision.

Čítaj viac

Získaj BONUS 8 € v Bitcoinoch

nakup bitcoin z karty

Registrácia Binance

Burza Binance

Aktuálne kurzy