Autor Cointelegraph By William Suberg

Bitcoin liquidates over $1 billion as BTC price hits 6-week highs

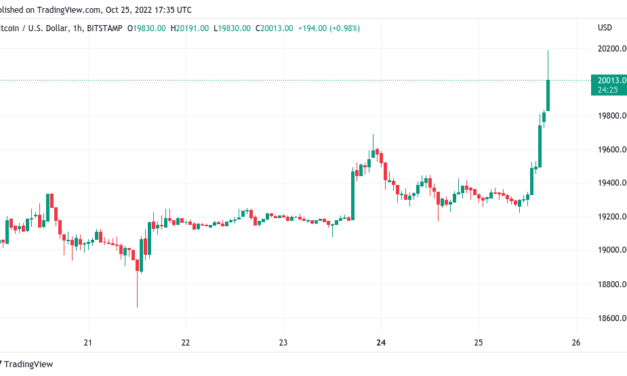
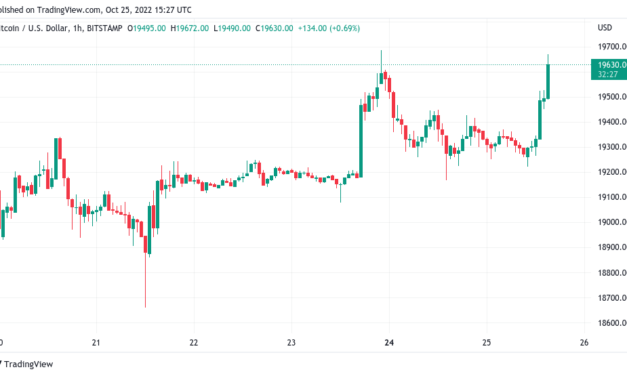
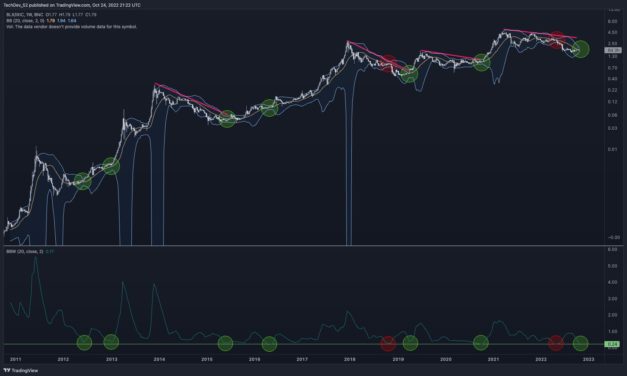
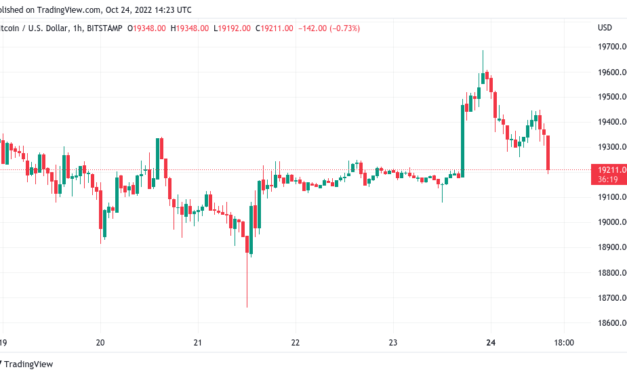
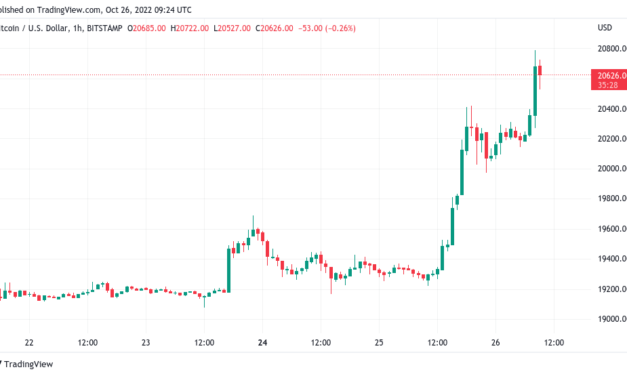
Bitcoin (BTC) saw its highest levels since mid-September on Oct. 26 as BTC/USD approached the pivotal $21,000 mark.BTC/USD 1-hour candle chart (Bitstamp). Source: TradingViewBears lose big as Bitcoin climbsData from Cointelegraph Markets Pro and TradingView showed the pair tackling $20,700 at the time of writing, up over 7% in 24 hours.What began as an assault on $20,000 continued on the day, liquidations mounting further after already sealing the biggest shorts obliteration of 2022.According to data from analytics resource Coinglass, Bitcoin alone accounted for $550 million in liquidations in the past 24 hours.$704 million in cross-crypto shorts were liquidated on Oct. 25, with the Oct. 26 tally so far standing at $275 million. Including long positions, the total was over $1 billion.Crypto liquidations chart. Source: CoinglassNovember lows still on the tableDiscussing what the future could hold for BTC price action, some traders and analysts remained set on previous theories, arguing that the past day’s gains had literal structural impact.Related: Analyst puts Bitcoin price at $30K next month with breakout due“The fact that this retracement is happening before taking the last high is a good sign,” Il Capo of Crypto told Twitter followers during the prior day’s moves. “In my opinion, we will see the last push up to 21k this week. Time pivots are October 27th and November 2nd (interest rates). Potential bottom about mid November. Key levels: 21k and 14k.”BTC/USD annotated chart. Source: Il Capo of Crypto/ TwitterFellow commentator Credible Crypto likewise continued to predict that $14,000 would never arrive.“Nothing I have said in past has changed enough for me to make another vid update- still expecting new ATH in 2023, still not expecting 14k to be met (invalidation), still think we are basing out before our major impulse. Now just waiting for confirmation of the start of it,” he summarized.The last time that BTC/USD circled the day’s local highs of $20,789 on Bitstamp was on Sep. 13.BTC/USD 1-day candle chart (Bitstamp). Source: TradingViewThe views and opinions expressed here are solely those of the author and do not necessarily reflect the views of Cointelegraph.com. Every investment and trading move involves risk, you should conduct your own research when making a decision.

Čítaj viac

Bitcoin price crosses $20K as daily crypto short liquidations pass $400M

Bitcoin (BTC) spiked above $20,000 on Oct. 25 as risk assets benefited from new U.S. dollar weakness.BTC/USD 1-hour candle chart (Bitstamp). Source: TradingViewBitcoin taps three-week highsData from Cointelegraph Markets Pro and TradingView showed BTC/USD hitting highs of $20,191 on Bitstamp.The move came in tandem with rising United States equities, these in turn buoyed by a declining U.S. dollar, which lost traction against major trading partner currencies on the day.With that, Bitcoin saw its first trip above the $20,000 mark since Oct. 7.“Finally, the volatility will kick in,” Michaël van de Poppe, founder and CEO of trading firm Eight, reacted. “Bitcoin is ready for that relief run. Long and strong.”BTC/USD 1-day candle chart (Bitstamp). Source: TradingViewTrader and analyst Il Capo of Crypto meanwhile flagged BTC outperforming altcoins in terms of gains, albeit with no end in sight as yet.“There’s fuel to keep going,” he tweeted.Data from monitoring resource Coinglass meanwhile showed the extent to which the market had been short on the day. Short position liquidations for Bitcoin alone topped $165 million on the day, a multi-month high, with the tally still increasing at the time of writing.Cross-crypto short liquidations amounted to more than $400 million.Crypto liquidations chart. Source: CoinglassDollar puts up a fight after swift lossesFollowing the action, analytics service Material Indicators meanwhile tracked shifting support and resistance on the Binance order book.Related: Analyst puts Bitcoin price at $30K next month with breakout dueThe $20,000 zone had been marked by a cluster of sell orders totaling in excess of $110 million, bulls managing to make a considerable dent with the impulse.”FireCharts shows the remaining $83M of the $112M BTC sell wall we saw this morning was just moved up,” it confirmed alongside a chart showing a heat map of trades.BTC/USD order book data (Binance) chart. Source: Material Indicators/ TwitterIn a potential knock to crypto, however, the U.S. dollar index (DXY) showed signs of recouping its daily losses at the time of writing, attempting to clinch 111 as support.”$DXY is finally breaking down today. Expecting bids in the 109.50-110 range,” Justin Bennett, founder of crypto education platform Crypto Academy, commented.U.S. dollar index (DXY) 1-hour candle chart. Source: TradingViewThe views and opinions expressed here are solely those of the author and do not necessarily reflect the views of Cointelegraph.com. Every investment and trading move involves risk, you should conduct your own research when making a decision.

Čítaj viac

Bitcoin price rises above $19.6K as US dollar strength falls to 3-week lows

Bitcoin (BTC) returned to local highs at the Oct. 25 Wall Street open as nervous analysts kept an eye on miners.BTC/USD 1-hour candle chart (Bitstamp). Source: TradingViewDXY provides instant relief for BTCData from Cointelegraph Markets Pro and TradingView showed BTC/USD rising to offer a modest challenge to resistance, still unable to escape an established trading range.United States equities likewise headed modestly higher, with the S&P 500 and Nasdaq Composite Index up 1% and 1.3%, respectively at the time of writing.The U.S. dollar index (DXY) conversely lost ground on the day, falling to its lowest levels since Oct. 6 and providing potential tailwinds for risk assets to seal opportunistic gains.U.S. dollar index (DXY) 1-day candle chart. Source: TradingViewFor traders, the intraday status quo remained in place amid an ongoing lack of real volatility. Popular Twitter account Crypto Tony highlighted significant range levels, with $18,900 an important zone to hold.BTC/USD annotated chart. Source: Crypto Tony/TwitterFellow trader Crypto Ed, meanwhile, revealed that he was “still waiting” for a correction to that level, followed by a bounce past $19,100.“It might even go a bit lower, then coming back here, that would be your entry for a long,” he said in a YouTube update.Previously, commentators had revealed a wait-and-see approach to the market, with estimates of a breakout ranging from two to eight weeks.Miners under surveillanceDownside risk, meanwhile, firmly focused on miners on the day. Related: Least volatile ‘Uptober’ ever — 5 things to know in Bitcoin this weekWith the hash rate at all-time highs but spot price at its lowest in nearly two years, miners continue to battle the tightest profit squeeze in history. They could soon be forced to offload hoarded coins to cover expenses, some warned.In a dedicated research piece on the topic, Cauê Oliveira, lead on-chain analyst at BlockTrends, in particular, drew attention to hash price — miners’ revenue per exahash.“At this moment hashprice, as the indicator is known, reached $66,500 which is the lowest value ever recorded,” he explained.“Total revenue has strongly deviated from its average annual growth. What is common in all bears but with one difference: the costs of maintaining the operation.”As of September, public miners’ BTC balance totaled a combined 34,509 BTC, a large tranche of liquidity that “can be unloaded as mining pressures continue,” market analyst Sam Rule commented.“Bitcoin could conceivably capitulate to the $10k-$18k range, fueled by a final selloff from the miners. Something I definitely psychologically prepare for,” longtime analyst Tuur Demeester added.Bitcoin miner net position change chart. Source: GlassnodeWith miners exiting a major capitulation phase in August, however, data suggests that even prolonged distribution of coins does not necessarily impact price action negatively.In early 2021, for example, after BTC/USD had cleared its 2017 all-time high, miners embarked on a mass profit-taking exercise, this failing to hold back Bitcoin as it hit an impulse top of $58,000 in April that year.According to on-chain analytics firm Glassnode, the selling at that time saw roughly 30,000 BTC leave miner wallets in the month January.Bitcoin balance in miner wallets chart. Source: GlassnodeThe views and opinions expressed here are solely those of the author and do not necessarily reflect the views of Cointelegraph.com. Every investment and trading move involves risk, you should conduct your own research when making a decision.

Čítaj viac

Analyst puts Bitcoin price at $30K next month with breakout due

Bitcoin (BTC) “will break out significantly” in the next month, with an upside target of $30,000.That was the latest prediction from Michaël van de Poppe, founder and CEO of trading firm Eight.Analyst on November price target: “My guess is probably $30K”In a tweet on Oct. 25, Van de Poppe joined a growing number of analysts delivering bullish BTC price forecasts.BTC/USD is currently marked by a distinct lack of volatility, but signs are flowing in that the sideways trend is due a major shake-up.Bitcoin’s Bollinger Bands versus the Nasdaq are the tightest in history, popular analyst TechDev and others confirmed in recent days, this all but guaranteeing an explosive move to come.“Price vs. NASDAQ peaked at BTC’s last impulse top in April 2021 and has been consolidating during the 1.5 year correction,” he wrote as part of commentary. “Expect upside break and strong Bitcoin outperformance soon.”BTC vs. Nasdaq annotated chart with Bollinger Bands. Source: TechDev/ TwitterFor Van de Poppe, upside potential is a more attractive bet than further bearish behavior, with BTC/USD set to add as much as 35% in the coming weeks.“Within 2-3 weeks, Bitcoin will break out significantly. My take is the upside,” he stated.“My guess is probably $30K.”Such a breakout would surpass the relief rally target from popular pundit Il Capo of Crypto, this being in place for months and set at $21,000.Prior to Wall Street trading beginning, however, he acknowledged that the $21,000 zone may appear “this week.”“Market looking good for a last leg up. Higher highs and higher lows on ltf and demand being moved up,” he tweeted.Old hands fuel latest Bitcoin bull caseSetting out its own bull case for Bitcoin, meanwhile, on-chain analytics firm Glassnode placed the focus on long-term holders (LTHs) and exchange buyers.Related: Least volatile ‘Uptober’ ever — 5 things to know in Bitcoin this weekExchanges are seeing significant amounts of BTC leave their books, while hodlers are intent on not selling, it explained this week — as reported by Cointelegraph.“The Bull Case takes a view on the HODLers of last resort, whereby the supply flows out of exchanges, and into HODLer wallets is at an all-time-high,” the latest edition of Glassnode’s weekly newsletter, “The Week On-Chain,” summarized. “Despite being small in relative number, the conviction of Bitcoins die-hard believers is unshaken, and their balance continues to grow, through thick and thin.”Bitcoin % exchange balance annotated chart (screenshot). Source: GlassnodeLonger-term perspectives on Bitcoin have remained lofty, with a $2 million prediction by 2028 coming in this month.The views and opinions expressed here are solely those of the author and do not necessarily reflect the views of Cointelegraph.com. Every investment and trading move involves risk, you should conduct your own research when making a decision.

Čítaj viac

Bitcoin ‘6–8 weeks’ from breakout as Hang Seng echoes Lehman Brothers dip

Bitcoin (BTC) waited for cues at the Oct. 24 Wall Street open as expectations of a breakout ran high.BTC/USD 1-hour candle chart (Bitstamp). Source: TradingViewHang Seng drops most since 2008Data from Cointelegraph Markets Pro and TradingView tracked a mundane trading day for BTC/USD after the pair hit weekly highs of $19,700 overnight.Despite what Michaël van de Poppe, CEO and founder of trading firm Eight, called “way worse than expected” manufacturing data from the United States, Bitcoin suffered from a declining trajectory on the day. This led on-chain analytics resource Material Indicators to suspect that resistance would remain in place.“Sunday BTC failed all attempts to reclaim the 2017 Top,” it said, summarizing the latest 24 hours’ price action as per its proprietary trading indicators.“The change in the trajectory of Trend Precognition’s A1 Slope Line after the D and W close indicates a loss of momentum. Price is currently pinned between the 50-Day MA and the trend line awaiting the TradFi open.”Van de Poppe, meanwhile, put the sell levels to beat at $19,600 and $20,700, adding that the U.S. dollar and U.S. bond yields were “showing some slight weakness.”“Upwards momentum is fading on bond yields,” popular trading account Game of Trades continued. “When this last happened, the markets went on a big run.”It was nonetheless macro markets offering clearer signs of volatility to come on the day, specifically in Asia, where the Hong Kong Hang Seng saw its biggest daily drop since the Lehman Brothers implosion in 2008.Hang Seng Index 1-day candle chart. Source: TradingViewGame of Trades likewise considered the S&P 500 as a potential source of a “massive move” with volatility increasing.S&P 500 volatility annotated chart. Source: Game of Trades/Twitter“Big expansive move” may be months off for BTCFor Bitcoin, volatility could be a long time coming, as a classic indicator delivers signals seen only a handful of times before.Related: Least volatile ‘Uptober’ ever — 5 things to know in Bitcoin this weekAs noted by Filbfilb, co-founder of trading suite DecenTrader, Bitcoin’s Bollinger Bands continue to contract on weekly timeframes, reaching rare levels.“The outcome of each example is obviously a big expansive move,” he told Twitter followers on the day. “The funny part is that in each of the examples, BTC spent 6-8 weeks tightening further from the width level we are now at, before a big expansive move, so I’m afraid there’s a good chance this thing winds up further.”BTC/USD comparative annotated charts. Source: Filbfilb/TwitterWhether up or down, Bitcoin’s current increasing correlation with gold was something to take note of, Charles Edwards, founder of asset manager Capriole, added.“Bitcoin bottoms often align with high correlation to Gold. We have that today,” he declared alongside a comparative chart of previous such periods. “It is much better when Bitcoin is correlated to Gold. Unshackled.”BTC/USD vs. gold correlation annotated chart. Source: Charles Edwards/TwitterThe views and opinions expressed here are solely those of the author and do not necessarily reflect the views of Cointelegraph.com. Every investment and trading move involves risk, you should conduct your own research when making a decision.

Čítaj viac

Získaj BONUS 8 € v Bitcoinoch

nakup bitcoin z karty

Registrácia Binance

Burza Binance

Aktuálne kurzy