Autor Cointelegraph By William Suberg

Bitcoin price targets $79K as US PPI inflation hits highest since 2022

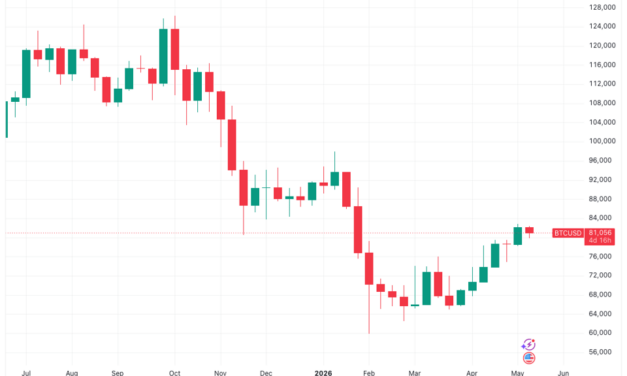
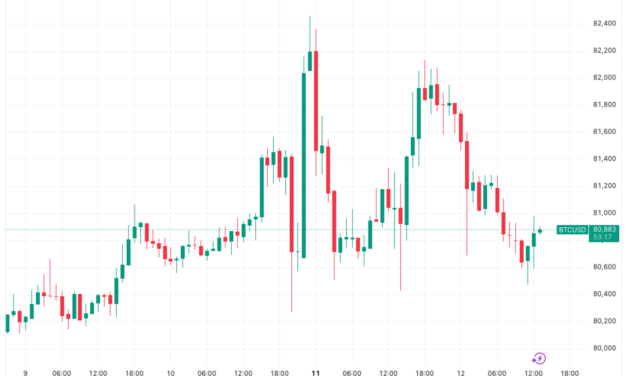
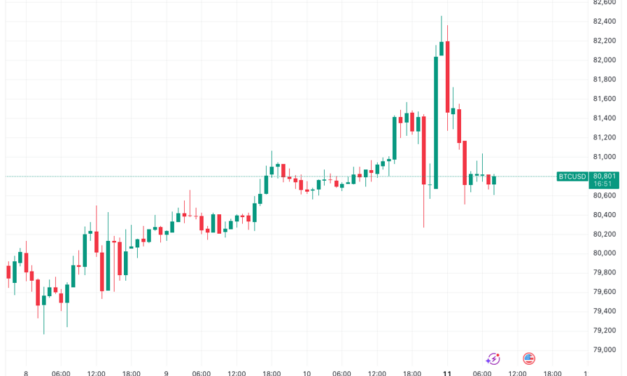
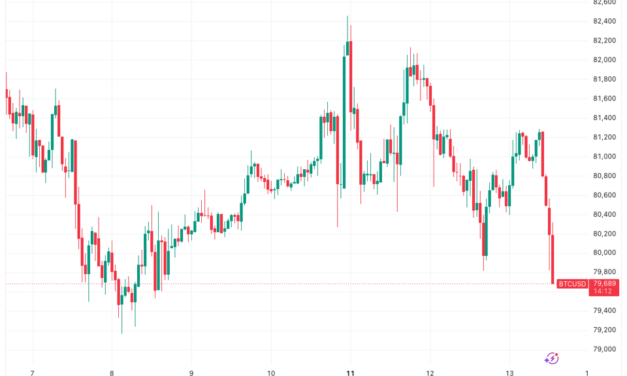
Bitcoin (BTC) fell below $80,000 into Wednesday’s Wall Street open as US inflation data continued to alarm.Key points:Bitcoin price action sees fresh downside pressure thanks to US PPI inflation reaching its highest since 2022.Odds of further financial tightening by the Federal Reserve increased in a headwind for crypto.BTC price analysis sees the CME futures gap staying as resistance “until further notice.” BTC price action loses $80,000 in fresh inflation blowData from TradingView showed a trip to near $79,500 accompanying the April release of the Producer Price Index (PPI).BTC/USD one-hour chart. Source: Cointelegraph/TradingViewLike the Consumer Price Index (CPI) print the day prior, PPI delivered a surprise to the upside — a headwind for crypto and risk assets due to the implied future tightening of financial conditions by the Federal Reserve. “The April increase is the largest advance since rising 1.7 percent in March 2022,” an official news release from the US Bureau of Labor Statistics (BLS) stated. “On an unadjusted basis, the index for final demand rose 6.0 percent for the 12 months ended in April, the largest 12-month increase since moving up 6.4 percent in December 2022.”US PPI one-month % change. Source: BLSThe US-Iran war and its associated impact on oil prices thus continued to filter through to the economy, with even more serious upheaval to come.“All of the data is very clear: consumers are about to face another wave serious pressure on spending power,” trading resource The Kobeissi Letter wrote in a reaction on X.The results further reduced the odds of the Fed cutting interest rates at its June meeting, with just a 1.4% chance of that outcome, per data from CME Group’s FedWatch Tool. Fed target rate probabilities for June 17 FOMC meeting (screenshot). Source: CME GroupOn Monday, trading resource Mosaic Asset Company summarized the risk that high oil prices, in particular, pose to the risk-asset uptrend.“The prospect of rising interest rates on the short- and long-end of the yield curve could pose a challenge to stock market valuations,” it wrote in the latest edition of its regular newsletter, The Market Mosaic. “The easing bias in central banks around the world is shifting to a more hawkish stance.”CFDs on WTI crude oil one-day chart. Source: Cointelegraph/TradingViewBitcoin futures gap in control “until further notice”Bitcoin traders maintained hope for a successful breakout from current resistance for BTC/USD.Related: Bitcoin price history suggests 77% odds of new all-time high within a year“Break above that ~$82K region and that gap at $84K will surely be filled. Likely continuing quite a lot higher at that point,” Daan Crypto Trades wrote in his latest X analysis.Daan Crypto Trades described US stocks as recovering “nicely” from their initial weakness over the CPI data.“Market mostly awaiting some clarity in regards to the conflict in the middle east,” he added.BTC/USDT perpetual contract one-day chart. Source: Daan Crypto Trades/XTrader and analyst Rekt Capital, meanwhile, saw BTC/USD moving within an open “gap” in CME Group’s Bitcoin futures market — a common short-term price magnet.“Bitcoin finally Weekly Closed below the top of the red area, confirming that price will be consolidating within the CME Gap until further notice,” he told X followers.CME Bitcoin futures one-week chart. Source: Rekt Capital/X

Čítaj viac

Bitcoin price repeating move with 77% all-time high odds within year: Analyst

Bitcoin may have a roughly 77% chance of reaching new all-time highs within a year if historical BTC price patterns repeat.Key points:Bitcoin reduces its drawdown from all-time highs from 50% to 35% with its rebound to $80,000.History shows that new all-time highs have come within a year during similar events.The Buffett indicator could be calling Bitcoin’s new $160,000 record highs in advance.BTC price drawdown: Odds favor new all-time highNew research from network economist Timothy Peterson released on Tuesday shows what happens when BTC/USD claws back significant losses.“I looked at every time Bitcoin went from a -50% drawdown to a -35% drawdown (the situation we are in today),” he revealed in a post on X.Bitcoin dipped below $60,000 in late February, a move that brought its drawdown versus its $126,200 all-time highs beyond 50%.Since then, conditions have eased, and price currently trades around $81,000. Against its October 2025 peak, the pair is 35% lower, per data from TradingView.BTC/USD one-week chart. Source: Cointelegraph/TradingViewAs Peterson confirms in an accompanying chart, such moves have characterized price action throughout its past bear markets. What is more exciting for Bitcoin bulls, however, is what traditionally comes next.He added that “7 out of 9 times it hit a new all-time high within a year.” BTC price drawdown data. Source: Timothy Peterson/XThe last time that a similar recovery took place was at the end of the 2022 bear market, which saw a maximum drawdown of just over 70%.Data from onchain analytics platform Glassnode shows that it took until December 2023 for that correction to become 35% against all-time highs from two years prior.Bitcoin’s new record high then came in March 2024.BTC price drawdowns from all-time highs. Source: GlassnodeBitcoin “looks cheap” amid $160,000 targetDespite uncertainty over geopolitical and macroeconomic conditions going forward, Bitcoin is not without its bullish predictions this month.Related: BTC price target becomes $85K next: Five things to know in Bitcoin this weekExamining Bitcoin versus gold, Matthew Sigel, head of digital asset research at VanEck, offered $160,000 per coin as a conservative estimate.Sigel reported that the so-called Buffett indicator — the ratio of the total US stock market to GDP named after Warren Buffett — implies a BTC comeback move.“Bitcoin looks cheap,” he told X followers on Monday.“If it regains the 35x XBT/XAU cross implied by current levels of the Buffett Indicator, we’re looking at $160k, and that’s just catching up to where equities already are.”BTC/USD versus Buffett indicator. Source: Matthew Sigel/X

Čítaj viac

Bitcoin digests highest US CPI since 2023 as Fed rate hike woes return

Bitcoin (BTC) saw classic volatility ahead of Tuesday’s Wall Street open as a key US inflation gauge hit its highest levels in three years.Key points:US CPI inflation reaches its highest year-on-year levels since 2023.Energy prices fuel the rise, with the US-Iran war continuing to make its presence felt.Bitcoin traders retain support levels while a 200-day trend line comes in as resistance.Bitcoin price on edge as CPI beats multiyear recordsData from TradingView showed BTC price action circling $81,000 as risk assets saw fresh headwinds.BTC/USD one-hour chart. Source: Cointelegraph/TradingViewThese came in the form of the April US Consumer Price Index (CPI), which at 3.8% year-on-year put inflation at its highest since 2023.“The index for energy rose 3.8 percent in April, accounting for over forty percent of the monthly all items increase,” an official news release from the US Bureau of Labor Statistics (BLS) noted.The 12-month increase in energy was almost 18%, continuing to show the impact of the US-Iran war and oil-supply squeeze on prices.“Conversely, the indexes for new vehicles, communication, and medical care were among the major indexes that decreased in April,” the release added.US CPI 12-month % change. Source: BLSReacting, trading resource The Kobeissi Letter observed that the odds of the Federal Reserve pivoting to interest-rate hikes were “surging.”“We are now experiencing post-pandemic inflation levels amid surging oil prices,” it wrote in a post on X.Fed target rate probabilities (screenshot). Source: CME GroupThe latest data from CME Group’s FedWatch Tool showed expectations anchored around current rates staying in place throughout 2026 and next year.Crypto and risk assets tend to see downside pressure when rate hikes return, thanks to the implied lower liquidity entering the market.Questions over Bitcoin’s “momentum” at the 200-day trend lineBitcoin traders, meanwhile, reiterated lines in the sand that bulls should protect in the short term.Related: BTC price target becomes $85K next: Five things to know in Bitcoin this week“The 21-MA is a crucial level to look at,” crypto trader and analyst Michaël van de Poppe told X followers on the day, referring to the 21-day simple moving average (SMA) at $78,800. “The $76K area is a crucial support zone that I fancy not to be breached, if that happens, we’ll be going substantially lower.”BTC/USDT one-day chart. Source: Michaël van de Poppe/XTrading resource Material Indicators flagged problematic resistance in the form of the 200-day SMA near $82,600.“Bulls appear to be attempting to establish an R/S Flip at $80.7k to build foundational support for another run at breaking the 200-Day SMA,” it summarized. “Do bulls have the momentum to succeed?”BTC/USD one-day chart. Source: Material Indicators/X

Čítaj viac

BTC price target becomes $85K next: Five things to know in Bitcoin this week

Bitcoin (BTC) starts a new week in fighting form as $80,000 support survives a volatile weekly close.Key points:Bitcoin preserves the potential for upside continuation as one trader pencils in $85,000 for the coming days.Consolidation is also a popular prediction as BTC/USD surfs CME futures gaps and grabs liquidity.The US-Iran war continues to provide snap market turbulence across crypto and risk assets.Buyer commitment to BTC leads analysis to forecast a longer-term uptrend.Two Bitcoin price metrics are about to deliver their first “golden cross” in nearly three years.Latest BTC price targets include $85,000Bitcoin saw classic end-of-week volatility thanks to geopolitical developments as price briefly passed $82,000.Data from TradingView showed that the move was short-lived, however, with BTC/USD quickly dropping back toward the $80,000 mark.BTC/USD one-hour chart. Source: Cointelegraph/TradingViewThe result was liquidity grabs that neutralized both long and short BTC positions on exchange order books. Data from CoinGlass puts the 24-hour crypto liquidation total at more than $400 million.Crypto liquidation history (screenshot). Source: CoinGlass“The Liquidation Heatmap on $BTC is currently looking STACKED with liquidity,” X trading account Cryptic Trades commented in a post just before the volatility hit. “Both sides are filled with liquidity on both sides, which is why I believe that market makers are going to flush out both sides before there’s a bigger directional move out of this range.”Binance BTC/USDT liquidation heatmap. Source: CoinGlassBitcoin is not without its bullish targets, however, as the mid-$80,000 range comes into view.In an X thread mapping out the week’s potential price moves, trader CrypNuevo argued that BTC/USD holding $80,000 as support was the ideal foundation for continuation higher.“Price has found acceptance above $81k and the EMAs have caught up,” he wrote, referring to moving averages (MAs) on daily time frames. “Therefore, we’re expecting price to potentially push higher to $84k-$85k next week.”BTC/USDT four-hour chart. Source: CrypNuevo/XCrypto trader and analyst Michaël van de Poppe continued the bullish sentiment, saying that the “trend remains upward.”“The 21-MA is below the current price; there’s still a lot of momentum, and there’s no breakdown of the higher-high, higher-low structure at all,” he told X followers on Monday. “There’s no reason to believe that we’re stalling soon.”BTC/USDT one-day chart. Source: Michaël van de Poppe/XBitcoin lacks futures “trigger” to break consolidationSome market participants believe that conditions are not yet right for a decisive BTC price breakout.Trader and analyst Rekt Capital is one of them, pointing to nearby “gaps” in CME Group’s Bitcoin futures. These gaps, which are created when BTC/USD sees weekend volatility, often act as short-term BTC price magnets.“Bitcoin has reached its CME Gap (red). BTC is holding the bottom of it as support but rejecting from the top of it,” Rekt Capital told X followers while analyzing the weekly futures chart. “Price will need to Weekly Close above the top of this area if it wants to rally higher. Until that trigger is in – > consolidation.”CME Bitcoin futures one-week chart. Source: Rekt Capital/XTrader Daan Crypto Trades revealed other gaps around the spot price.“We now have a few gaps left in close proximity: $78K, $80.3K & $84K,” he confirmed, with the highest gap capping recent local highs.CME Bitcoin futures one-hour chart. Source: Daan Crypto Trades/XElsewhere, Cryptic Trades argued that the combination of declining open interest and rising price should deliver similar range-bound trading conditions for now.“Because of this, I believe the most likely short-term outcome remains further consolidation, with both longs and shorts getting flushed before the market makes a larger directional move out of this range,” it concluded.CPI leads key inflation week for FedThe US-Iran war continues to be the main source of flash volatility for crypto and risk assets this week.Bitcoin’s weekly close was marked by reactionary behavior as markets digested the latest developments in peace negotiations.After trading terms back and forth — which had given markets reason for optimism last week — US President Donald Trump said that he did not “like” Iran’s latest proposals.In a post on Truth Social, Trump called the terms “totally unacceptable.”Source: Truth SocialThe result was WTI crude oil quickly heading back above $100, while BTC/USD spiked to near $82,500 before giving back all its gains.CFDs on WTI crude oil one-hour chart. Source: Cointelegraph/TradingView“US-Iran peace talks are being priced-out again,” trading resource The Kobeissi Letter wrote in a response on X.Oil prices will remain in the spotlight as new US Consumer Price Index (CPI) data is released. As Cointelegraph reported, this inflation gauge is particularly sensitive to oil-market volatility.The April Producer Price Index (PPI) release will follow on Wednesday.Source: Cointelegraph/XCommenting, investment manager Peter Tarr highlighted the implications of the data for Kevin Warsh, President Trump’s nominee to chair the Federal Reserve“Elevated oil prices will show impact reports. Important report for Warsh era Fed and markets,” he wrote on X.Trump last month said that he “would” be disappointed if Warsh failed to cut interest rates at the Fed’s June meeting. The latest data from CME Group’s FedWatch Tool, however, shows that markets see only a 4.2% chance of that outcome.Fed target-rate probabilities for June 17 FOMC meeting (screenshot). Source: CME GroupWhile this could be a headwind for crypto, traders believe that the CPI result itself is already “priced in” to BTC price action.Analysis sees “sustainable uptrend” for BitcoinThe latest Bitcoin analysis remains hopeful that a “sustained” market rebound is around the corner.In one of its QuickTake blog posts on Sunday, onchain analytics platform CryptoQuant flagged positive changes in exchange-trader behavior.“Looking at the $BTC Spot Taker CVD (90-day) chart on CryptoQuant, we are seeing a significant shift in capital flow structure,” contributor Researcher Rei summarized.Rei referred to cumulative volume delta (CVD) data, which records the difference between buy and sell volume at given price points over time.“Following a neutral accumulation phase, the indicator has turned Green. This means Buyers are no longer waiting at lower price levels (Limit Orders) but have started “sweeping” the order book directly (Market Buy),” he continued.The data implies that large-volume investors have flipped from speculation to a hodl-based mentality, while macro conditions support the return of liquidity to crypto.Rei described Bitcoin as a “top-tier growth asset.”“Real demand has prevailed,” he concluded. “When bulls are willing to pay higher prices to own $BTC, a sustainable uptrend usually follows.”Bitcoin spot taker CVD (screenshot). Source: CryptoQuantOnchain metrics prepare rare golden crossMore good news comes from two other BTC price metrics about to perform their first “golden cross” since mid-2023.Related: Bitcoin Bollinger Bands push key breakout as creator acts on positive signalBitcoin’s market value to realized value (MVRV) ratio, which compares Bitcoin’s market cap to the price at which the supply last moved, also known as its “realized cap,” is one of them.Recently, MVRV has rebounded from local lows to record some of its highest readings of 2026.“This signal reflects a clear improvement in Bitcoin’s market valuation relative to its realized value, suggesting that the market has begun to regain an important portion of its momentum following a period of decline and rebalancing during the first months of the year,” CryptoQuant commented last week.Bitcoin MVRV ratio. Source: CryptoQuantNow, MVRV is about to cross the 200-day exponential moving average (EMA) for the first time in nearly three years. Data shows that past golden crosses have preceded snap BTC price upside. “This signal is a representative trend reversal signal and is a bullish indicator,” CryptoQuant contributor CW8900 confirmed on Sunday.BTC/USD chart with MVRV data (screenshot). Source: CryptoQuant

Čítaj viac

Bitcoin holds $80K into weekly close as traders say BTC price dip not yet over

Bitcoin (BTC) eyed $81,000 into Sunday’s weekly close as traders saw a fresh support retest next.Key points:Bitcoin preserves $80,000 over the weekend, but traders are waiting for a dip to retest a familiar chart feature.Continuation higher remains the overall consensus for what happens afterward.US CPI data is due out, with Bitcoin already “pricing in” the result.Bitcoin traders: Sub-$80,000 retest nextData from TradingView showed BTC price action trending higher after a mostly flat weekend, avoiding a return below $80,000.BTC/USD one-hour chart. Source: Cointelegraph/TradingViewAfter a midweek trip to near $83,000 failed to hold, however, traders saw the need for BTC/USD to retest support — something that they now reiterated.Of particular interest was the bull market support band — two moving averages just below the $80,000 mark.“On the low-timeframes, after rejecting at the high-timeframe resistance range marked in purple, I believe the most likely outcome is a short-term pullback toward the 2D Bull Market Support Band, which has been a strong reversal zone over the last couple of months,” analytics account Cryptic Trades wrote alongside a chart in its latest post on X.“As long as price continues to hold above the support band and the broader high-timeframe support range marked in blue around $75K, which aligns with the April 2025 bottoming formation, I believe the most likely outcome remains further upside.”BTC/USD one-day chart. Source: Cryptic Trades/XTrader Daan Crypto Trades agreed, calling the initial move above the support band “not a clean break.”“Would want to see a move to at least clear that sticky area around the low $80Ks and hold there for a week or two,” he told X followers.BTC/USD one-week chart. Source: Daan Crypto Trades/XCPI already “priced in” to BTCAhead of fresh US inflation data next week, trader Killa warned of headwinds returning for BTC price strength.Related: Bitcoin Bollinger Bands push key breakout as creator acts on positive signalThe Consumer Price Index (CPI) for April, due out on Tuesday, was set to show the ongoing impact of the US-Iran war and oil-price rises on the economy.“Its priced in,” Killa wrote on X.“BTC has rallied after the last two CPI releases. However,  if we follow 2025 CPI price action, we may see bigger players start de-risking into the event counter narrative.”BTC/USD chart with CPI releases. Source: Killa/XSupport levels to watch also included the area around the bull market support band, with $74,000 on the radar, should it fail.“I would watch for liquidity sweeps around this pivot to signal the next move,” Killa added.

Čítaj viac

Získaj BONUS 8 € v Bitcoinoch

nakup bitcoin z karty

Registrácia Binance

Burza Binance

Aktuálne kurzy