Autor Cointelegraph By William Suberg

Bitcoin weak hands 'mostly gone' as BTC ignores Amazon, Meta stock dip

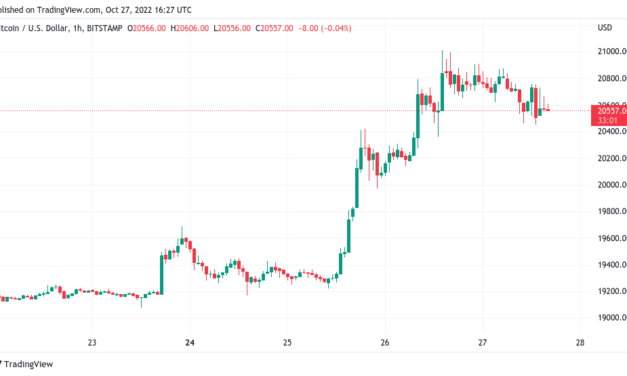
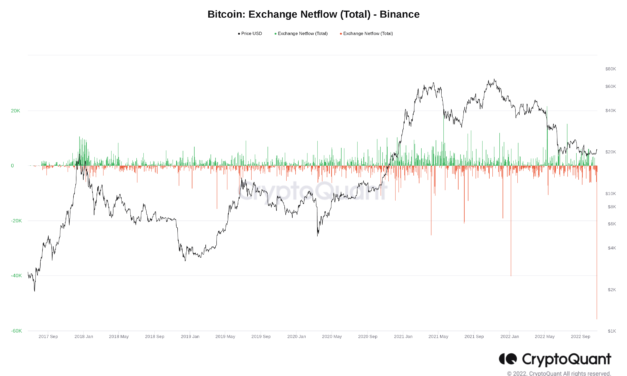
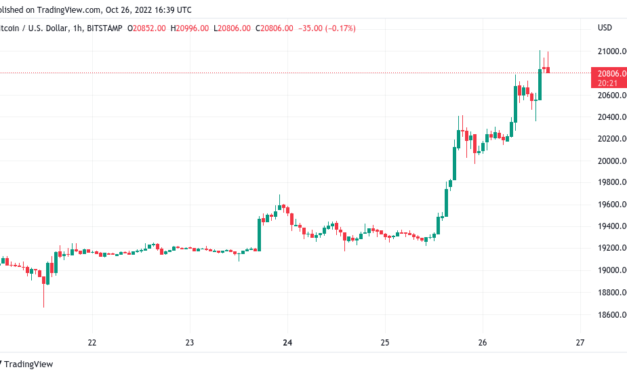
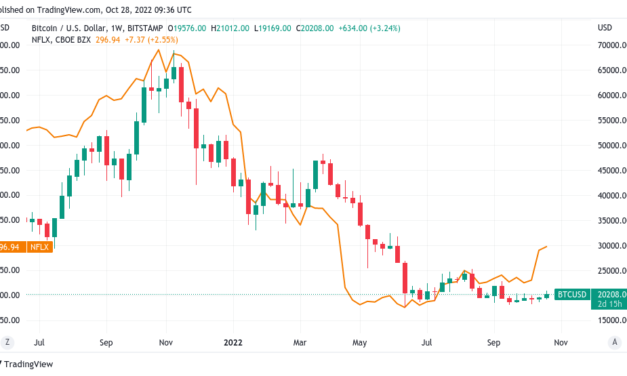
Bitcoin (BTC) is decoupling from big tech as disappointing earnings fail to spark any major BTC price losses.Economic data for Q3, 2022 saw heavy losses for some tech stocks, but BTC/USD avoided a chain reaction.Bitcoin hodlers shrug off Q3 tech resultsThe largest cryptocurrency shed around $800 over Oct. 27, or 3.8%, after hitting its highest levels in six weeks.At the time of writing, Bitcoin was still around $20,200, offering more consolidatory trading behavior than a major correction.The same was not true of tech stocks, these led by a dramatic 20% rout in Amazon during out-of-hours trading thanks to missed earnings targets. Amazon’s market cap sealed the biggest such post-close drop in history, at over $230 billion.“There is obviously a lot happening in the macroeconomic environment, and we’ll balance our investments to be more streamlined without compromising our key long-term, strategic bets,” CEO Andy Jassy commented in the firm’s Q3 earnings report.While evidence of the problematic state of flux experienced by tech giants worldwide this year, Amazon’s comedown notably failed to spark copycat moves on crypto markets.The same is true with similarly painful results from Meta, the stock price of which fell below $100 to return to 2015-levels this week.This is a sea change from the end of 2021, economist, trader and entrepreneur Alex Krueger believes, that time marked by heavy price declines, which came in step with poor performance at Netflix.“Last January Netflix’s earnings and its ensuing 20% crash sent $BTC down 20%, $ETH down 30%. Today Amazon’s earnings and its ensuing 20% crash sent $BTC down 2%, $ETH down 3%,” he tweeted on Oct. 28. “Weak hands are mostly gone.”With that, Netflix is down 50% year-to-date with its current stock price around $300. BTC/USD is down around 6% more, data from Cointelegraph Markets Pro and TradingView shows.BTC/USD vs. Netflix stock 1-week chart. Source: TradingViewCorrelation has not gone awayThe observation feeds into a growing narrative over Bitcoin’s correlation to traditional markets.Related: A record 55,000 Bitcoin, or over $1.1 billion, was just withdrawn from BinanceThe past week has not seen the clear-cut lockstep moves between BTC and equities, with the former playing catch-up as stocks cooled. As Cointelegraph reported, Bitcoin’s growing correlation to gold is now gaining attention once again.Overall, however, a long-term trend change in correlation with the S&P 500, for example, is still far from being confirmed.BTC/USD vs. S&P 500 correlation chart. Source: TradingView”While it’s too early to say if this trend continues, it’s worth watching,” Mario Nawfal, founder of Blockchain consultancy firm IBC Group, summarized.The views and opinions expressed here are solely those of the author and do not necessarily reflect the views of Cointelegraph.com. Every investment and trading move involves risk, you should conduct your own research when making a decision.

Čítaj viac

Bitcoin is cooling its rally — Here are the BTC price levels to watch next

Bitcoin (BTC) consolidated gains on Oct. 27 as the highest levels in six weeks gave way to sideways action.BTC/USD 1-hour candle chart (Bitstamp). Source: TradingViewBitcoin impresses with stability on GDP printData from Cointelegraph Markets Pro and TradingView showed BTC/USD circling $20,500 on Bitstamp after reaching local highs of $21,012 the day prior.The largest cryptocurrency treaded water in line with United States equities at the Wall Street open, with the S&P 500 flat and the Nasdaq Composite Index down around 1% at the time of writing.The U.S. dollar index (DXY) meanwhile began to claw back losses on the day, providing a headwind to risk assets absent for much of the week. DXY had seen its lowest levels since mid-September.U.S. dollar index (DXY) 1-hour candle chart. Source: TradingViewAhead of a decision on interest rates by the Federal Reserve, GDP data showed a rebound for the U.S. economy in Q3.“This [GDP] number is weaker in terms of the signal it sends about the forward strength of the economy than the last one was, even though the headline was positive,” Eric Winograd, director of developed market economic research at AllianceBernstein, nonetheless told the Financial Times.In Europe, the European Central Bank (ECB) raised key rates by 0.75% as expected.“Big day today, as the ECB comes in with their policy and GDP numbers from the U.S.,” Michaël van de Poppe, founder and CEO of trading firm Eight, summarized. “Honestly, Bitcoin remains calm at these levels, would have expected a more significant correction since the last push.”The latest data from CME Group’s FedWatch Tool put the odds of the Fed copying the 0.75% hike at 90.8% on the day.Fed target rate probabilities chart. Source: CME Group$14,000 return still haunts trader’s chartAnalyzing the weekly BTC/USD chart, popular trader Rekt Capital highlighted the zone immediately below $22,000 as an important one to reclaim should bullishness continue.Related: A record 55,000 Bitcoin, or over $1.1 billion, was just withdrawn from Binance“BTC is slowly approaching the red resistance area,” he wrote in an update on Oct. 26.BTC/USD annotated chart. Source: Rekt Capital/ TwitterFellow analyst Il Capo of Crypto meanwhile said that $21,500 would need to form the basis for consolidation should bulls want to see $23,000 materalize.His “main scenario” remained a reversal to new macro lows for BTC/USD, these potentially hitting $14,000.BTC/USD annotated chart. Source: Il Capo of Crypto/ TwitterThe views and opinions expressed here are solely those of the author and do not necessarily reflect the views of Cointelegraph.com. Every investment and trading move involves risk, you should conduct your own research when making a decision.

Čítaj viac

A record 55,000 Bitcoin, or over $1.1 billion, was just withdrawn from Binance

Bitcoin (BTC) has seen record buying activity as BTC/USD returns to six-week highs.The latest data from on-chain analytics firm CryptoQuant shows more BTC leaving major exchange Binance in a single day than ever before.Binance finishes the day 55,000 BTC lighterDespite warnings that a macro bottom may not yet have occurred, Bitcoin investors have wasted no time snapping up BTC above $20,000.The past two days’ gains delivered a sea change to exchange user behavior, with BTC balances dropping across the board.As the largest exchange by volume, Binance was of particular interest and saw a net position change of over 55,000 BTC on Oct. 26 — the most ever.The outflows beat all other buying sprees, including the $17,600 dip in June this year and the March 2020 crash.Bitcoin exchange netflow (Binance) chart. Source: CryptoQuantCryptoQuant contributor Binh Dang further noted that derivatives platform outflows were setting multi-month records.“In 1 year from now, yesterday was the day with the biggest number of coins moved out of the derivatives exchange: 71,579 Bitcoin,” he wrote in one of the firm’s Quicktake posts, noting that internal moves could have made up some of the total.“That number contributes to bringing the outflow of BTC from derivatives exchanges to 94,024 Bitcoin. This is the most significant number since July. This amount has helped drastically reduce the total reserves on derivatives exchanges after spiking since Bitcoin’s price dropped in May.”Dang added that such derivatives outflows had once accompanied decreased sell-side pressure on Bitcoin more broadly.“While there is still a lack of on-chain confirmation of Bitcoin bottoming, looking back at the history of late 2018, we will see the difference,” he concluded. “In the strongest price declines in the two years before 2020, and 2021, each appearance of a strong downtrend on derivative reserve showed a similar decrease in selling pressure. How about this time?”Bitcoin derivative exchange netflow chart. Source: CryptoQuantGains have “not changed” Bitcoin bear marketTurning to exchanges’ stock of BTC, from Oct. 25 through Oct. 26, the major platforms tracked by CryptoQuant saw around 42,500 BTC in net outflows.Related: Why is the crypto market up today?Unlike with Binance, cross-platform position change did not set a global record, with June remaining higher.Bitcoin exchange netflow chart. Source: CryptoQuantSumming up, fellow CryptoQuant contributor IT Tech warned that the good times may not last long. The United States Federal Reserve meeting on interest rates could deliver an unwelcome pivot.“For me it could mean that is some kind of fake pump before FOMC meetings 2.11.2022,” he wrote in a further Quicktake. “DXY is going down and helped S&P500 and Bitcoin grown up. Be careful because we are still in Bear market and one small pump not changed this.”The views and opinions expressed here are solely those of the author and do not necessarily reflect the views of Cointelegraph.com. Every investment and trading move involves risk, you should conduct your own research when making a decision.

Čítaj viac

Bitcoin price reaches $21K as crypto market cap nears $1T

Bitcoin (BTC) returned to $21,000 for the first time since September after the Oct. 26 Wall Street open as buyers solidified gains.BTC/USD 1-hour candle chart (Bitstamp). Source: TradingViewBTC bulls “eat” ask liquidityData from Cointelegraph Markets Pro and TradingView followed BTC/USD as it hit local highs of $21,012 on Bitstamp.At the time of writing, the pair continued to explore territory out of reach for over six weeks.Liquidations also kept flowing, with the past 24 hours delivering $750 million in liquidated positions on Bitcoin alone, according to data from Coinglass.Cross-crypto liquidations totaled $1.43 billion, adding to what was already the highest tally in 2022 so far.Crypto liquidations chart. Source: CoinglassThe impetus did not come from United States equities on the day, these treading water as Bitcoin played catch-up while reducing overall risk asset correlation.The spotlight was instead on gold, which also saw a relief rally as the U.S. dollar struggled. The U.S. dollar index (DXY) circled its lowest levels since Sep. 20.U.S. dollar index (DXY) 1-day candle chart. Source: TradingViewTracking the order book on largest global exchange Binance, analytics platform Material Indicators noted ask liquidity was moving higher.“A big chunk of ask liquidity was eaten in the past 24 hours and some has been replenished, but there is no question that BTC bulls got some help when blocks of bid and ask liquidity were adjusted upward,” it wrote in part of a Twitter update.BTC/USD order book data. Source: Material Indicators/ Twitter$21,000 formed a key level for some analysts, among them Il Capo of Crypto, who previously forecast the market retracing at that point to retarget macro lows.Fellow trader and analyst Rekt Capital also noted that Bitcoin was not yet out of the woods when it came to its comedown from all-time highs.“On the normal scale, BTC is breaking its year-long downtrend,” he tweeted alongside comparative charts. “On the log scale however, the year-long downtrend is still far away from being tested.”BTC/USD annotated log chart. Source: Rekt Capital/ TwitterCrypto market cap eyes key milestoneBeyond Bitcoin, there was also good news for crypto markets in general. Related: Why is the crypto market up today?The overall crypto market cap, which had lost significant value over the year, came within 5% of the $1 trillion mark on the day.”Total Market Cap of crypto is up 2.5% today,” David Gokhstein, founder of Gokhstein Media, reacted, noting the euphoric feeling among market participants.Crypto market cap 1-day candle chart. Source: TradingViewThe views and opinions expressed here are solely those of the author and do not necessarily reflect the views of Cointelegraph.com. Every investment and trading move involves risk, you should conduct your own research when making a decision.

Čítaj viac

Why is the crypto market up today?

Bitcoin (BTC) volatility is finally giving BTC bulls what they want — but why now?After drifting lower for months and spending recent weeks in a tiny trading range, BTC/USD has delivered 24-hour gains in excess of 7%.Hitting its highest levels since mid-September, the largest cryptocurrency is rewarding those who refused to sell and punishing shorters to the tune of around $1 billion.The change of trend has come quickly and caught many by surprise, as evidenced by that liquidation tally.Behind the scenes, however, little has changed — macroeconomic conditions have not undergone major upheaval compared to a week ago, and internal problems for Bitcoin, such as miner strain, remain the same.What could have caused BTC price action to break out of what could end up being a downtrend finally breaking after an entire year?Cointelegraph takes a look at three major factors influencing crypto market strength in the current environment.Fed could change its tune on rate hikesWhen Cointelegraph reported on why the crypto market saw fresh losses last week, the United States Federal Reserve was first on the list.Concerns focused on unwavering policy keeping the U.S. dollar strong and rates surging higher for the foreseeable future — the worst case scenario for risk assets.Nonetheless, the past week has seen the results of that policy spill over into other economies, notably Japan, which made repeated interventions in its exchange market to prop up the flagging yen.At the same time, rumors are gathering over the outlook for rate hikes as the Fed runs out of room to maneuver. After next month’s hike, suspicions are that policy will begin to U-turn, making smaller hikes in subsequent months before reversing altogether in 2023.Important upcoming dates for the Fed are:Oct. 28: Personal Consumption Expenditures (PCE) price indexNov. 1-2: Federal Open Market Committee (FOMC) meeting, rate hike decisionAs such, any signal that the Fed is preparing to soften its hawkish stance is being seized on by markets weary from a year of quantitative tightening (QT).November’s FOMC meeting is still overwhelmingly expected to result in a 0.75% rate hike, matching September and July, according to CME Group’s FedWatch Tool.Fed target rate probabilities chart. Source: CME GroupBitcoin volatility snaps record low levelsAnalyzing data from Cointelegraph Markets Pro and TradingView, it becomes clear that BTC/USD has been too quiet for too long.This is especially visible in the Bollinger Bands volatility indicator, these rarely closer together in Bitcoin’s history and demanding a breakout out for weeks.BTC/USD 1-day candle chart (Bitstamp) with Bollinger Bands. Source: TradingViewThis month, Bitcoin volatility even fell below that of some major fiat currencies, making BTC look more like a stablecoin than a risk asset.Analysts had long expected the trend to undergo a violent change, however, and true to form, crypto markets did not disappoint.A look at the Bitcoin historical volatility index (BVOL), recently at multi-year lows seen only a handful of times, shows that Bitcoin still has a way to go to abandon this characteristic.“Pretty funny that volatility has been so compressed and we’ve become so conditioned as market participants that the slightest 3% move feels like a 15-20% move,” William Clemente, co-founder of crypto research firm Reflexivity Research, commented.Bitcoin historical volatility index (BVOL) 1-week candle chart. Source: TradingViewDollar eyes a new chapterAfter a parabolic uptrend throughout 2022, the U.S. dollar is only just beginning to show signs of weakness.Related: Analyst puts Bitcoin price at $30K next month with breakout dueThe U.S. dollar index (DXY) recently hit its highest levels since 2002, and momentum may yet return to take it even higher — at the expense of risk assets and major currencies alike.For the meantime, however, DXY is under pressure, and its descent came in lock step with a return to form for Bitcoin and altcoins.This flags an issue that Bitcoin bulls are keen to shake — ongoing strong correlation to traditional markets and inverse correlation with the dollar.“Bitcoin now has a correlation with Gold of about 0.50, up from 0 in mid-August,” trading firm Barchart revealed this week. “While the correlation is higher with $SPX (0.69) and $QQQ (0.72), the correlations have decreased of late.”Fellow analyst Charles Edwards, founder of crypto asset manager Capriole, noted that Bitcoin macro price bottoms are often accompanied by increasing gold correlation.BTC/XAU correlation chart. Source: Barchart/ TwitterScott Melker, the analyst and podcast host known as “The Wolf of All Streets,” also confirmed a changing relationship between Bitcoin and the Nasdaq.“Nasdaq futures are down. Bitcoin is up. The short term correlation between the two has disappeared over the past few weeks. I will take it,” he summarized.The views and opinions expressed here are solely those of the author and do not necessarily reflect the views of Cointelegraph.com. Every investment and trading move involves risk, you should conduct your own research when making a decision.

Čítaj viac

Získaj BONUS 8 € v Bitcoinoch

nakup bitcoin z karty

Registrácia Binance

Burza Binance

Aktuálne kurzy