Autor Cointelegraph By William Suberg

New Bitcoin Yardstick metric says $20K BTC now ‘extraordinarily cheap’

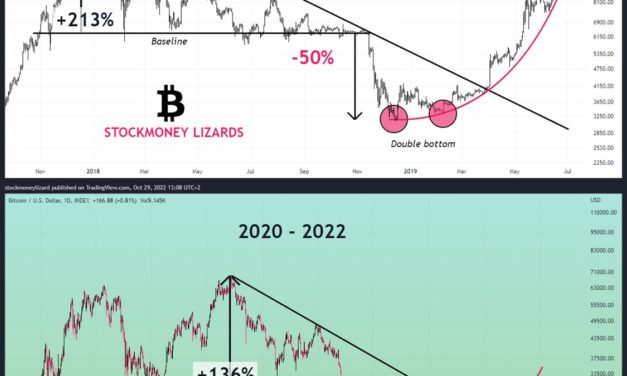
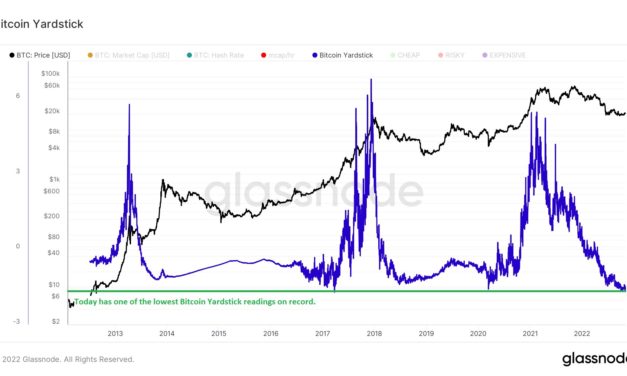
A simple but elegant Bitcoin (BTC) price metric has returned to lows from before the 2017 bull market.As noted by its creator, Charles Edwards, CEO of asset manager Capriole, the Bitcoin Yardstick is now at its second lowest level in history.Yardstick prints second-lowest reading everAs on-chain metrics converge to put in a classic macro bottom for BTC/USD, a new candidate is suggesting that Bitcoin is even more oversold than the average hodler believes.The Bitcoin Yardstick measures the ratio of Bitcoin market cap to hash rate — two fundamental metrics which, when compared to one another, offer key price insights.As Edwards explains, the lower the value, the “cheaper” Bitcoin is — more hash rate is being applied to secure low-priced coins.While he cautions that it is “not investment advice,” this has implications for would-be buyers — much of the unrealized value lies in the amount of work done to secure the Bitcoin supply during price suppression.Currently, the Bitcoin network hash rate is near all-time highs, while the price is down around 75% from its last all-time highs seen in November 2021.“Today we are seeing the second lowest reading for the Bitcoin Yardstick in all of Bitcoin’s history,” Edwards commented:“This means that on a relative basis, Bitcoin is extraordinarily cheap given the amount of energy being used on what is the most powerful computer network in the world.”Bitcoin Yardstick annotated chart. Source: Charles Edwards/ TwitterBitcoin hash rate keeps goingThe Yardstick feeds into the concept of proof-of-work (PoW), the mining algorithm of the Bitcoin network, and its ability to store and grow value over time based on productive activity. The Bitcoin Standard, the seminal book by academic Saifedean Ammous, focuses heavily on the idea.Related: Bitcoin ‘double bottom’ excites bulls as NVT signal predicts major moveThe opposite of the current scenario, meanwhile, where the price is high compared to work done, occurred during the 2013 and 2017 bull market years.In 2021, several spikes accompanied Bitcoin’s double top in April and November, respectively, but none matched the scale of the prior peaks.Bitcoin Yardstick chart. Source: GlassnodeAs Cointelegraph reported, Bitcoin miners are under considerable stress despite mushrooming hash rate as profit margins get squeezed.The summer already saw a period of miner “capitulation,” with Edwards laying out the evidence of recovery underway in August.Bitcoin hash rate chart. Source: BlockchainThe views and opinions expressed here are solely those of the author and do not necessarily reflect the views of Cointelegraph.com. Every investment and trading move involves risk, you should conduct your own research when making a decision.

Čítaj viac

Bitcoin resistance mounts pre-FOMC as Dogecoin sets 17-month BTC high

Bitcoin (BTC) stayed motionless at the Nov. 1 Wall Street open as traders rooted for clues over possible direction.BTC/USD 1-hour candle chart (Bitstamp). Source: TradingViewHopes of a breakout remain despite BTC sell wallData from Cointelegraph Markets Pro and TradingView showed a narrow range in place for BTC/USD overnight, the day seeing local highs of $20,681 on Bitstamp.Markets were keenly awaiting news from the United States Federal Reserve on interest rates, these scheduled for 2pm Eastern time on Nov. 2.Until then, it was a case of “wait and see,” while on-chain monitoring resource Material Indicators noted sell-orders already increasing.“The binance order book is starting to look like a game of Tetris,” it summarized.A chart showed resistance being added at just below $30,000 at the Oct. 31 monthly close. “If that $46M block at ~$30k drops into the active trading range, it’s going to hammer price down. To the contrary, if it gets lifted BTC should run,” Material Indicators continued. “Signaling from the FED on Wednesday could be a catalyst.”BTC/USD order book data (Binance). Source: Material Indicators/ TwitterTrader Crypto Tony meanwhile highlighted the potential for upside to reenter based on recent performance. “Bulls stepped in at the right time to defend the support zone,” he tweeted alongside an illustrative chart. “Now the question is do we get a pump up from here, or dip to take out the liquidity lows then pump.”BTC/USD annotated chart. Source: Crypto Tony/ TwitterThe monthly close had come in at around $20,500 for Bitcoin, this marking a modest increase over September and October gains of 5.6%, according to data from Coinglass.BTC/USD monthly returns chart (screenshot). Source: CoinglassDOGE divides with ongoing bull runThe main story focused on altcoins on the day as Bitcoin ranged.Related: BTC price sees ‘double top’ before FOMC — 5 things to know in Bitcoin this weekContinuing a boost received courtesy of Tesla CEO Elon Musk, Dogecoin (DOGE) furthered gains on the day, reaching its highest since late April in USD terms and highest since June 2021 priced in BTC.“A test of $0.17 EQ level seems inevitable at this point,” Crypto Tony predicted in separate analysis. “No doubt we will continue seeing more Doge tweets from the master himself Elon Musk.”Others were less convinced, with fellow popular trader Anbessa cautioning on adding DOGE exposure at current levels.“Caution, especially if you Fomo now & haven’t caught the whole move,” part of Twitter comments read.DOGE/BTC 1-week candle chart (Binance). Source: TradingViewThe views and opinions expressed here are solely those of the author and do not necessarily reflect the views of Cointelegraph.com. Every investment and trading move involves risk, you should conduct your own research when making a decision.

Čítaj viac

Bitcoin 'double bottom' excites bulls as NVT signal predicts major move

Bitcoin (BTC) is delivering striking similarities to its last bear market but the recent bottom may be its last, research says.In a tweet on Oct. 31, popular trading account Stockmoney Lizards furthered the bull case for BTC/USD.Bitcoin “repeats itself” in 2022The past few days have seen talk of Bitcoin encountering a “double top” with two spikes over $21,000. The implication is bearish — declining volume suggests that bulls will not be able to flip the level to support, and many expect fresh macro lows to come next.New analysis offers an alternative, more optimistic, perspective. For Stockmoney Lizards, the similarities between 2022 and 2018 are hard to ignore.“Bitcoin repeats itself,” it summarized alongside a comparative BTC/USD chart.That chart compared what happened after Bitcoin hits its 2017 all-time high of $20,000 and 2021 all-time high of $69,000.After a year-long bear market, BTC/USD approached macro lows in a similar fashion in both 2018 and 2022, it suggests.As such, the June trip to $17,600 and the lows from the first half of October this year may in fact have been a “double bottom” similar to Q4, 2018 and the first half of 2019.Should that turn out to be true, upside is the logical next step and Bitcoin should avoid a further capitulation event.BTC/USD annotated charts. Source: Stockmoney Lizards/ TwitterNVT Signal take bets on “big green candle”Equally positive news comes from Bitcoin’s NVT signal, which one trader and analyst is reading as a cue for a “big move” to hit the charts.Related: BTC price sees ‘double top’ before FOMC — 5 things to know in Bitcoin this weekA derivative of NVT ratio, NVT signal is about to repeat behavior which sparked considerable BTC price appreciation in years past.“NVT-Signal predicts that a big move for $BTC is coming,” the trader explained alongside a chart.“When NVT signal crosses NVT ratio and the NVT signal was before, the price of $BTC has increased ~450% on average in the last 3 years. I expect that we will see a big green candle very soon.” Bitcoin NVT signal annotated chart. Source: @el_crypto_prof/ TwitterNVT has not always led to successful interpretations. At the end of 2021, a separate iteration flashed “oversold” despite BTC/USD going on to spend a year losing, not gaining, in USD terms.The views and opinions expressed here are solely those of the author and do not necessarily reflect the views of Cointelegraph.com. Every investment and trading move involves risk, you should conduct your own research when making a decision.

Čítaj viac

BTC price sees 'double top' before FOMC — 5 things to know in Bitcoin this week

Bitcoin (BTC) begins a key week of internal and macroeconomic events still trading above $20,000.After its highest weekly close since mid-September, BTC/USD remains tied to higher levels within a macro trading range.Bulls have been keen to shift the trend entirely, while warnings from more conservative market participants continue to call for macro lows to enter next.So far, a tug-of-war between the two parties is what has characterized BTC price action, and any internal or external triggers have only had a temporary effect. What could change that? The first week of November contains a key event which has the potential to shape price behavior going forward — a decision by the United States Federal Reserve on interest rate hikes.In addition to other macroeconomic data, this will form the backdrop to overall market sentiment beyond crypto.Bitcoin will further see a monthly close during the week, this apt to spark last-minute volatility despite October 2022 being one of the quietest on record.Cointelegraph takes a look at these and several other factors impacting BTC/USD in the coming days.FOMC countdown enters final daysThe headline story of the week comes courtesy of the Fed and the meeting of its Federal Open Market Committee (FOMC).On Nov. 1-2, officials will make a decision on the November benchmark interest rate hike, this overwhelmingly priced in at 0.75%.While this will match the Fed’s previous two hikes in September and July, respectively, markets will be watching for something else — subtle hints of a change in quantitative tightening (QT).The rates decision is due Wednesday at 2pm Eastern time, along with an accompanying statement and economic projections.Fed Chair Jerome Powell will then deliver a speech at 2:30pm, this completing the backdrop to market reactions.As Cointelegraph reported, there is already talk that subsequent rate hikes will begin to trend towards neutral, marking the end of an aggressive policy enacted almost a year ago.For Bitcoin and risk assets in general, this could ultimately provide some serious fuel for growth as conditions loosen. Looking at the short term, however, commentators expect a standard reaction to the upcoming FOMC announcement.“Think we see a little pullback this week which is pretty typical when the FED will be announcing rates,” popular trading account IncomeSharks summarized to Twitter followers. “4h showing a double top and downtrend break.”An accompanying chart showed the expected retracement to be followed by more potential upside going forward.BTC/USD annotated chart. Source: IncomeSharks/ TwitterAn alternative perspective came from analyst Kevin Svenson this weekend, who warned that with inflation expectations “increasing,” there was little reason to hope for a rate hike decrease in the near future.“Every time the Stock Market rallied up in this current downtrend, it did so with the expectation of a FED pivot,” he noted. “Inflation expectations increasing recently making a FED pivot less likely. The trend is ur friend? If so, Stocks find another lower high after FOMC.”Svenson continued that should the Fed surprise with a lower hike than 0.75%, bullish momentum should “take over.”“Obviously, this could be wrong if the FED does a “soft pivot” and goes for 50 basis points,” he added. “If that occurs, the market would get excited and bullish speculation would take over for the time being.”According to CME Group’s FedWatch Tool, the chances of a lower hike than 0.75% are currently 19%. Fed target rate probabilities chart. Source: CME GroupIn a summary of the FOMC event, popular analyst @Tedtalksmacro meanwhile drew similarities with Svenson’s take.“There’s lots of talk about a ‘pivot’ or that ‘the Fed are breaking things and need to stop hiking.’ But, the data says otherwise and points to nothing other than hawkishness again this week,” it said.”Clear double top” sparks BTC downside talkBitcoin managed to avoid major volatility as it closed the weekly candle at around $20,625 on Bitstamp, data from Cointelegraph Markets Pro and TradingView confirms.That in itself was noteworthy, marking the highest weekly candle close in six weeks for BTC/USD.BTC/USD 1-week candle chart (Bitstamp). Source: TradingViewThe daily chart meanwhile retains the 100-day moving average as current resistance.BTC/USD 1-day candle chart (Bitstamp) with 100MA. Source: TradingViewNonetheless, the long-established trading range the pair has acted in for months on end remains firmly in place, and even last week’s push higher failed to produce a significant paradigm shift.For analyst Mark Cullen, it is thus a question of “wait and see” when it comes to Bitcoin’s next move.In fresh analysis on Oct. 31, he noted BTC/USD had returned to a familiar Fibonacci level based on last week’s upside while continuing to range.“Bitcoin pulled back to the 20.4k level at the 61.8 of the last push up & has held it so far,” he explained. “With the FOMC meeting this week, i wonder if BTC just range between here & 21k until a catalyst pushes it in one direction or the other. Levels are clear, sit & wait.”Tedtalksmacro drew a similar conclusion on macro markets in general — they expect the “same old hawkishness” from the Fed, and thus even FOMC delivering no surprises should be enough for last week’s bullish tone to continue.“Nothing new is bullish — as the market seems prepared for all of the hawkishness that we have heard so far,” he concluded. “Expect volatility this week and if everything goes smoothly, for a really, really hated rally.”Crypto trader and analyst Il Capo of Crypto meanwhile called the two spikes above $21,000 in recent days a “clear double top” for Bitcoin.His target of a reversion to downside and new macro lows, possibly coming in at $14,000, remains in force.BTC/USD annotated chart. Source: Il Capo of Crypto/ TwitterToo early to bottomComparisons between this year and 2018, Bitcoin’s last bear market, are abundant currently — but it may be a case of “too much, too soon.”In analysis released late last week, on-chain analytics platform CryptoQuant argued that while Bitcoin is putting the pieces of the puzzle in place to bottom out, the market is not there yet.“Similar to the bottoms in 2015 and 2018-2019, bitcoin prices have been trading in a narrow range (between $18,000 and $20,000 for almost two months),” it began. “Price volatility has also dropped to one of its lowest levels ever and surged. When price volatility was this low in the past, it typically indicated that the downward trend was about to end. But in 2018, low price volatility was swiftly followed by a 50% price drop from $6.5k to $3.2k in just one month.”CryptoQuant flagged two important on-chain metrics — MVRV and UTXO Realized Cap — supporting the theory that the next bear market bottom is still a way off.MVRV divides Bitcoin’s market cap by realized cap, and is “useful,” in the words of popular analyst Willy Woo, for detecting overbought oversold conditions, as well as macro tops and bottoms.UTXO Realized Cap is the price at which different cohorts of bitcoins were transferred compared to the prior time, giving an insight into profit and loss.“MVRV and UTXO Realized Cap 6 months and older Age Bands show that the price of bitcoin is in the value range,” CryptoQuant continued. “However, a reasonable length of time needs to pass before the 1-3 months UTXO Age Band Realized Price is overtaken for a prolonged growth trend. Currently, this level is at $21,264.”As such, levels above $21,000 need to hold for the trend to change, and so far, that line in the sand has proven impossible to hold for hours, let alone weeks.“We have seen that market bottoms can be correlated with unusually low volatility in bitcoin prices,” CryptoQuant concluded. “Nevertheless, many of the on-chain measures we have examined still do not support the conclusion that the price has reached its bottom and is rising.”Bitcoin UTXO Realized Cap annotated chart (screenshot). Source: CryptoQuantSupply shock risk highest since 2017Bitcoin dormant for up to a decade has been on the move recently, but overall, the BTC supply is becoming more and more illiquid.Fresh data this week provides the latest hint that an increase in buyer interest could spark a considerable supply squeeze and associated price hike.Highlighting data from on-chain analytics firm Coin Metrics, Jack Neureuter, a researcher at Fidelity Digital Assets, revealed that the percentage of the supply moved in the past year is now at an all-time low.33.7% of all available BTC has left its wallet since the end of October 2021, this also accounting for the increased volumes around November’s $69,000 all-time high.“Put another way, 2/3 of $BTC supply hasn’t moved the past 365 days,” Neureuter added in comments. “Marginal trading drives prices over the short-term, but large imbalances between supply and demand tend to do so in the long-term.”Bitcoin % supply last moved in past year chart. Source: Jack Neureuter/ TwitterSeparate data from on-chain analytics firm Glassnode meanwhile shows that the chances of a supply shock are rising.Its Illiquid Supply Shock Ratio metric, which models the phenomenon, has been trending higher throughout 2022, and is currently at levels not seen since Bitcoin’s all-time high from the last halving cycle in 2017.Bitcoin Illiquid Supply Shock chart. Source: GlassnodeSentiment hits six-week highs with pricePerhaps unsurprisingly, crypto market sentiment has improved thanks to last week’s price increases.Related: BNB jumps to new BTC all-time high as Elon Musk’s Twitter fuels DOGE bullsIn a sign of how much — or little — it takes to flip sentiment around, the Crypto Fear & Greed Index hit its highest levels in six weeks over the weekend.Fear & Greed uses a basket of factors to determine how bullish or bearish the mood in crypto is, and whether the market is due for a bounce or correction as a result.At 34/100, sentiment even managed to escape the “extreme fear” zone, which has become commonplace in 2022.Crypto Fear & Greed Index (screenshot). Source: Alternative.meMoreover, data from analytics firm Santiment suggested that long-term holders are planning to hodl through volatility.“With Bitcoin back above $20.7k, traders appear to be content with long-term holding as coins continue moving away from exchanges,” it wrote in a tweet at the weekend.Santiment additionally showed that the ratio of the BTC supply on exchanges was now at its lowest since 2018 — the year of the last macro bear market bottom. “With the ratio of $BTC on exchanges down to 8.3%, it’s the lowest seen in 4 years. October has been a big outflow month,” the post stated.Bitcoin exchange supply annotated chart. Source: Santiment/ TwitterThe views and opinions expressed here are solely those of the author and do not necessarily reflect the views of Cointelegraph.com. Every investment and trading move involves risk, you should conduct your own research when making a decision.

Čítaj viac

Binance Coin jumps to new BTC all-time high as Elon Musk's Twitter fuels DOGE bulls

Binance Coin (BNB) has hit new all-time highs against Bitcoin (BTC) as excitement grows over the crypto’s future role on Twitter.BNB/BTC 1-month candle chart (Binance). Source: TradingViewBinance Coin sets new record against BTCData from Cointelegraph Markets Pro and TradingView confirms that BNB/BTC briefly spiked above 0.15 BTC to a record 0.15267 BTC on Oct. 30.The in-house token of Binance, the largest crypto exchange by volume, has gained around 10% in the past 72 hours.The strong performance came on the back of reports that Binance was preparing to assist Twitter eradicate bots as part of its new direction under Elon Musk.Binance had contributed $500 million to Musk’s takeover of the social media platform.“Our intern says we wired the $500 million 2 days ago, probably just as I was being asked about Elon/Twitter,” CEO Changpeng Zhao wrote in a cryptic tweet referencing comments to crypto media outlet Decrypt.Further posts stated, “Let’s unleash the bird” and “crypto Twitter,” the former appearing to be referencing Musk’s own tweet, “The bird is freed.”In U.S. dollar terms, meanwhile, BNB hit highs of $318.80 on the day, its best performance since mid-August.BNB/USD 1-day candle chart (Binance). Source: TradingViewDogecoin “copies itself” as it runs to April highsMusk was also responsible for outperformance of another popular cryptocurrency in recent days — Dogecoin (DOGE).Related: Dogecoin price rallies 150% in 4 days, but DOGE now most ‘overbought’ since April 2021A familiar setup, actions by Musk linked to Twitter sent DOGE price action into a frenzy, with DOGE/USD hitting its highest levels since April.Long a pet favorite of Musk, DOGE is still waiting for its shot at a wider use application, possibly with his involvement.In the meantime, popular analyst Tree of Alpha suggests, retail traders may do the work, helped by both the Twitter and Binance ecosystems.“Another ATH in complete silence as the dog coin longers rejoice,” he wrote about BNB. “Imagine the smell when launchpads become a thing again and retail is back to turbo buying garbage on BSC. Are you actually fading the token that backs the biggest exchange & the most degenerate evm chain by far?”DOGE/USD 1-week candle chart (Binance). Source: TradingViewAnalytics account Stockmoney Lizards meanwhile noted uncanny similarities in DOGE price action and relative strength index (RSI) still being repeated this year.”Dogecoin copies itself,” it summarized.DOGE/USD annotated chart. Source: Stockmoney Lizards/ TwitterThe views and opinions expressed here are solely those of the author and do not necessarily reflect the views of Cointelegraph.com. Every investment and trading move involves risk, you should conduct your own research when making a decision.

Čítaj viac

Získaj BONUS 8 € v Bitcoinoch

nakup bitcoin z karty

Registrácia Binance

Burza Binance

Aktuálne kurzy