Autor Cointelegraph By William Suberg

Bitcoin miners send less BTC to exchanges since 2020 halving despite FTX

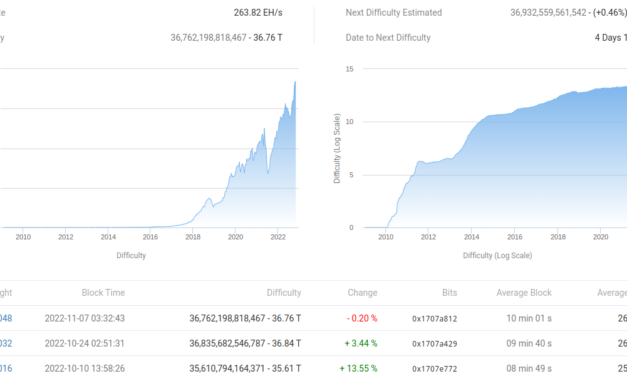
Bitcoin (BTC) miners may be sending more BTC to exchanges this month — but overall, their sales have crashed since 2020.Data from on-chain analytics platform CryptoQuant confirms that daily miner transfers to exchanges have decreased by two thirds or more.Miners cool BTC exchange sales after FTX spikeAfter BTC/USD lost 25% in days last week, existing concerns over miner solvency have heightened.Given their cost basis and rising hash rate, commentators warned that many mining participants may not be able to make ends meet — block subsidies and fees would not be enough to cancel out expenses, chiefly electricity.Network fundamentals, however, tell a curious story — hash rate continues to circle all-time highs and not fall significantly, indicating that at least certain miners are maintaining network hashing power, not shutting down operations en masse.Bitcoin network fundamentals overview (screenshot). Source: BTC.comCryptoQuant meanwhile shows that on a daily basis, miners are not desperately selling coins to cover the shortfall in revenue.On Nov. 8, the day of the FTX blowout, flows from miner wallets to exchanges totaled 1,300 BTC. This was the largest single-day tally since September.Overall, the period of the FTX debacle has seen comparatively modest increase in selling compared to other spikes this year. Miners sent 4,540 BTC to exchanges on Sep. 2, while on June 22, around the time that BTC/USD dipped to then two-year lows of $17,600, the day’s total was 5,729 BTC.Bitcoin Miner to Exchange Flow (Total) chart. Source: CryptoQuantZooming out, the picture becomes even more nuanced.Since Bitcoin’s last block subsidy halving event in May 2020, miners have significantly reduced their daily exchange sales.Around the time of the halving, the seven-day moving average of miner exchange deposits was around 1,200 BTC per day.The number varied significantly from day to day, but overall, what is considered a spike in November 2022 was standard practice at the time.Fast forward to October this year, and on some days, miners sent under 100 BTC to exchanges.The block subsidy may have halved and fees may account for less revenue in USD terms, but nevertheless, a clear trend is evident when it comes to exchange sales.Bitcoin Miner to Exchange Flow (Total) chart. Source: CryptoQuantPut another way, the FTX episode has produced only a brief divergence in miner outflows relative to their one-year moving average. This is summarized in CryptoQuant’s Miner Position Index (MPI).Bitcoin Miner Position Index (MPI) chart. Source: CryptoQuantA taste of things to come?As Cointelegraph reported, Bitcoin miners last experienced “distress” — in terms of on-chain data — in August.Related: Elon Musk says BTC ‘will make it’ — 5 things to know in Bitcoin this weekThe Hash Ribbons indicator, which is specifically designed to track miner capitulation, has been out of its red zone since then.So far, nothing has managed to force a return to mass exiting by miners. This may yet change, as the latest Hash Ribbons chart data shows hash rate tendencies flattening out after several months of growth.Bitcoin Hash Ribbons chart. Source: LookIntoBitcoinThe views and opinions expressed here are solely those of the author and do not necessarily reflect the views of Cointelegraph.com. Every investment and trading move involves risk, you should conduct your own research when making a decision.

Čítaj viac

Bitcoin price hits $17K on US PPI as trader warns of ‘final capitulation’

Bitcoin (BTC) spiked to $17,000 at the Nov. 15 Wall Street open as fresh United States economic data continued to show inflation cooling.BTC/USD 1-hour candle chart (Bitstamp). Source: TradingView“Good” PPI boosts risk assetsData from Cointelegraph Markets Pro and TradingView followed BTC/USD as it came closer to multi-day highs.Volatility had returned an hour before the open as the U.S. Producer Price Index (PPI) came in below expectations.Core PPI was unchanged month-on-month, with the PPI overall up 0.2% versus the 0.4% forecast. Year-on-year PPI was 8% versus the 8.3% forecast.The data, already in stark contrast to last month’s PPI, follows on from October’s Consumer Price Index (CPI) readout last week, this also showing that price increases in the U.S. were slowing.An ostensibly good sign for crypto along with risk assets, lower numbers theoretically increase the likelihood of an earlier pivot in hawkish economic policy from the Federal Reserve.“Good CPI & Good PPI,” Michaël van de Poppe, founder and CEO of trading firm Eight, reacted.Others were more suspicious of the results in light of such aggressive quantitative tightening (QT) measures.“The PPI is the inflation number Fed uses to make decisions,” popular analyst Venturefounder wrote in part of a Twitter analysis. “Market rallies on the news, inflation may have peaked but I think the most alarming part is after record QT for almost a year the PPI is still at 8%.”U.S. Producer Price Index (PPI) chart. Source: Bureau of Labor StatisticsStocks naturally appreciated the latest economic changes, with the S&P 500 and Nasdaq Composite Index up 1.7% and 2.4%, respectively, at the open.The already precarious U.S. dollar index (DXY), meanwhile, felt the pressure, briefly dropping below 105.5 to its lowest levels since mid-August.U.S. dollar index (DXY) 1-day candle chart. Source: TradingViewBullish divergences meet the “final capitulation” riskFor Bitcoin, optimism was still hard to find in analytical circles.Related: Edward Snowden says he feels ‘itch to scale back in’ to $16.5K BitcoinNonetheless, for trader and analyst Seth, a fresh bullish divergence on the weekly chart was something to feel confident about.“Bears took credit for the FTX Blackswan. Not many knew 2nd largest Exchange was going Bankrupt!” accompanying Twitter comments stated.Bleaker news came from fellow analyst Matthew Hyland, whose previous warning of a bearish chart cross came true.“The previous two crosses resulted in -46% and -57% moves AFTER the cross was confirmed,” he reiterated about the three-day chart’s moving average convergence/divergence (MACD) indicator.BTC/USD annotated chart. Source: Matthew Hyland/TwitterIl Capo of Crypto, still eyeing a deeper macro low, meanwhile, added that the “final capitulation is likely.”The views and opinions expressed here are solely those of the author and do not necessarily reflect the views of Cointelegraph.com. Every investment and trading move involves risk, you should conduct your own research when making a decision.

Čítaj viac

BTC losses get real as Bitcoin SOPR metric hits lowest since March 2020

Bitcoin (BTC) sellers are nursing their largest overall losses since March 2020, one on-chain metric suggests.Data from on-chain analytics firm Glassnode confirms that Bitcoin’s spent output profit ratio (SOPR) has now fallen to two-year lows.BTC on-chain losses mountAs Bitcoin holders attempt to pull funds from exchanges into non-custodial wallets, those moving coins around are doing so at multi-year high losses.SOPR divides the realized value of coins in a spent output by their value at creation. In other words, as Glassnode summarizes, “price sold / price paid.”As Cointelegraph reported, SOPR fluctuates around 1, and tends to be below that level during Bitcoin bear markets and above it in bull markets.This is logical, as unrealized losses increase through the bear market phase, leading to relatively larger overall realized losses once coins are sold.As such, the end of bear markets tends to see lower SOPR. As of Nov. 14, the metric’s 7-day moving averag was at 0.9847 — its lowest since the March 2020 COVID-19 cross-market crash.Bitcoin spent output profit ratio (SOPR) chart. Source: GlassnodeSOPR has further implications for BTC price action. Should BTC/USD start gaining, hodlers will have an incentive to sell at cost price or slightly above to avoid losses. This leads to a supply glut, which without buyers logically forces the price lower again.SOPR thus acts as a useful forecasting tool for potential price trends, with 1 once again being the important line in the sand when it comes to hodlers turning to sellers.“Due to the fundamental nature of underlying metrics on which the SOPR relies on, it would be fair to speculate that the Spent Output Profit Ratio is influencing price changes,” Renatio Shirakashi, the metric’s creator, stated in an introduction to it in 2019. “This can be of considerable significance, since most current indicators are lagging indicators.”March 2020 briefly saw SOPR dip to just 0.9486, still not as low as the end of the 2018 bear market, which produced a score of 0.9416.Bitcoin spent output profit ratio (SOPR) chart. Source: Glassnode4 million wallets now hodl at least 0.1 BTCMeanwhile, those engaged in “buying the dip” are doing so even at the smallest level.Related: Elon Musk says BTC ‘will make it’ — 5 things to know in Bitcoin this weekFurther Glassnode data shows that the number of wallets containing at least 0.1 BTC ($1,700) has now passed 4 million.While almost constantly rising this year, the trend saw a marked acceleration as BTC/USD fell due to the FTX scandal.Bitcoin addresses with 0.1 BTC or more chart. Source: GlassnodeThe views and opinions expressed here are solely those of the author and do not necessarily reflect the views of Cointelegraph.com. Every investment and trading move involves risk, you should conduct your own research when making a decision.

Čítaj viac

Edward Snowden says he feels ‘itch to scale back in’ to $16.5K Bitcoin

Bitcoin (BTC) returned to $16,500 at the Nov. 14 Wall Street open as bulls tried and failed to break higher.BTC/USD 1-hour candle chart (Bitstamp). Source: TradingViewSnowden hints BTC price echoes March 2020Data from Cointelegraph Markets Pro and TradingView showed BTC/USD ranging below $17,000 on the day after a dismal weekly close.The largest cryptocurrency had failed to show convincing signs of recovery after losing more than 25% the week prior thanks to the debacle around exchange FTX.That debacle was ongoing at the time of writing, with revelations fanning out to include other firms with significant exposure to the defunct exchange.With little light at the end of the tunnel visible, BTC price action remained unsurprisingly weak.“Markets consolidating,” Michaël van de Poppe, founder and CEO of trading platform Eight, summarized. “Would assume we’d be at $10K actually, after the terrible news we’ve received past weeks.”Trader and analyst Rekt Capital, meanwhile, warned of support-resistance flips in the making thanks to the weekly close, Bitcoin’s lowest in two years.“These are BTC Monthly levels shown on the Weekly timeframe,” he tweeted alongside a chart of important focal levels. “From this chart, we can see that $BTC has performed a new Weekly Close below the Monthly level of ~$17300. Initial signs of this level flipping into new resistance this week.”BTC/USD annotated chart. Source: Rekt Capital/TwitterOther posts on the day warned of the potential for “additional downside wicking” on BTC/USD while noting that historically, prior bear markets were still worse in terms of the pair’s descent from cycle highs.An interesting counterpoint came from Edward Snowden. In a tweet of his own, he signaled that he would be a BTC buyer at current levels, a sentiment he last publicly posted after the March 2020 COVID-19 cross-market crash.“There’s still a lot of trouble ahead, but for the first time in a while I’m starting to feel the itch to scale back in,” he stated.A second tweet stressed that the previous one was “not financial advice.”The dollar gives a “perfect” route to BTC upsideStocks offered little respite to crypto bulls on the day, with the S&P 500 and Nasdaq Composite Index down 0.3% and 0.8%, respectively, during the first hour.Related: Elon Musk says BTC ‘will make it’ — 5 things to know in Bitcoin this weekThe U.S. dollar index (DXY) continued consolidation of its own while refusing to add to the prior weeks’ significant retracement.Popular trading account Game of Trades noted that the daily chart’s relative strength index (RSI) for the DXY had set a new record low for 2022.U.S. dollar index (DXY) annotated chart. Source: Game of Trades/Twitter“SPX is showing strength and DXY is crashing,” a hopeful Bloodgood, another well-known Twitter trader, wrote in part of a fresh update on the day.“Perfect situation to see some upside.”BTC/USD annotated chart. Source: Bloodgood/TwitterThe views and opinions expressed here are solely those of the author and do not necessarily reflect the views of Cointelegraph.com. Every investment and trading move involves risk, you should conduct your own research when making a decision.

Čítaj viac

Elon Musk says BTC 'will make it' — 5 things to know in Bitcoin this week

Bitcoin (BTC) starts a new week on shaky ground after its lowest weekly close in two years.The largest cryptocurrency, considerably weakened after last week’s implosion of exchange FTX, continues to grapple with the fallout.In what is becoming an increasingly erratic market, investors are unsure what will happen next as more firms sound the alarm over solvency and regulators step up investigations in the crypto space.The mood among the majority is intensely fearful, and even some of the industry’s best-known names warn that it has been set back several years as a result of last week’s events.At the same time, for Bitcoin, it is business as usual. FTX is not the first such debacle it has weathered, and under the hood, the network remains as robust as ever.Cointelegraph takes a look at the factors set to influence BTC price action in the coming days as the average hodler gets to grips with major losses and ongoing volatility.Crypto braces for fresh FTX falloutWhile little is for certain in the current crypto market environment, it is safe to say that FTX and its aftermath is now the number one source of Bitcoin price volatility.The weekly chart says it all — a -$5,500 “red” candle for the seven days through Nov. 13 to the lowest weekly close since mid-November 2020, data from Cointelegraph Markets Pro and TradingView shows.BTC/USD 1-week candle chart (Bitstamp). Source: TradingViewAt the time of writing, BTC/USD is still around that close — $16,300 reappearing as a relief bounce after the pair wicked to just $15,780 on Bitstamp overnight.BTC/USD 1-hour candle chart (Bitstamp). Source: TradingViewThe story is far from over when it comes to FTX, as firms with exposure to the exchange and related entities find themselves in trouble.As such, commentators forecast, there may be repeat performances in the coming days and weeks as the knock-on effects put more and more crypto names out of business.Exchanges are particularly on the radar, with Crypto.com, Kucoin and others becoming the source of suspicion over liquidity.On the day, a spike in withdrawal transactions at Crypto.com and Gate.io led to warnings that it may be the latest exchange seeing a “bank run” as investors seek to take control of their funds.Data from on-chain analytics firm CryptoQuant showed 1,500 BTC leaving Gate.io on Nov. 13, with Nov. 14 currently at nearly 800 BTC and rising.Bitcoin outflows (Gate.io) chart. Source: CryptoQuantMore broadly, data showed exchange BTC reserves at an estimated 2.09 million BTC, CryptoQuant noting that due to the turmoil it may not reflect the true state of affairs.The last time that reserves were so low was in early 2018.Bitcoin exchange reserves chart. Source: CryptoQuantBitcoin bounces from $15,700 as Musk puts faith in BTCAgainst the backdrop of ongoing uncertainty, making BTC price predictions is thus no easy task.Turning to the moving average convergence divergence (MACD), analyst Matthew Hyland warned that the BTC/USD 3-day chart was about to repeat a bearish setup, which led to losses both times it appeared in 2022.“Bitcoin 3-Day MACD is in position to cross Bearish tomorrow for the first time since April,” he wrote. “It can be avoided if BTC can get positive price action before the 3-Day closes. Previous two crosses in the past year resulted in further downward price action.”BTC/USD annotated chart. Source: Matthew Hyland/ TwitterHyland nonetheless noted that after the 2014 Mt. Gox hack, Bitcoin took almost a year to find a macro price bottom after the initial shock.“It hasn’t even been 11 days since FTX closed up,” he added.Fellow analyst Il Capo of Crypto meanwhile argued that the market was prepared for a “final capitulation,” which may come sooner rather than later.This, he said in a series of tweets, would come in the form of a “bull trap” first then firm rejection, sending the market to new lows.For altcoins, he said, the comedown would amount to “40-50% on average.”On shorter timeframes, popular trader Crypto Tony feared that even the lowest weekly close in two years might fail to hold as support.“Nice breakout, but if we cannot hold the swing low at $16,400 then this was just a fake out and we wait for a test lower,” he commented about the recovery from $15,780 intraday lows.The move came as Twitter CEO, Elon Musk, came out in tacit support.“BTC will make it, but might be a long winter,” he wrote on the day in a Twitter debate.Twitter debate (screenshot). Source: TwitterA further short-term price catalyst came in the form of largest exchange Binance opting to create a dedicated recovery fund to help shield businesses.  Quiet macro week sees focus on stocks correlationThe picture outside of crypto further underscores the extent to which FTX has marked a “black swan” event for the industry.While Bitcoin and altcoins were busy shedding in excess of 25% in days, United States stock markets recovered from losses earlier in the month. As such, as research firm Santiment notes, there is a clear divergence occurring between Bitcoin and risk assets, this helping break a correlation that has endured throughout the past year.“As the trading work week closes, the week’s story is the distinct separation between crypto (after FTX’s fall from grace) & equities,” it summarized in a tweet last week. “Should $BTC traders’ trust recover after unfortunate events, there is a bullish divergence forming with the SP500.”BTC, ETH vs. stocks, gold correlation annotated chart. Source: Santiment/ TwitterMarkets commentator Holger Zschaepitz additionally noted the widening gap in performance of Bitcoin versus the Nasdaq.”Gap in weekly performance of sliding Bitcoin, rallying Nasdaq largest since 2020. Crypto universe shrank to the equivalent of 1% of global equities,” part of new comments read on the day. That decreasing correlation may come at a useful time macro-wise, as U.S. dollar strength makes some erratic moves of its own.The U.S. dollar index (DXY), having attempted a rebound past 107, failed prior to the Nov. 14 Wall Street open, with the implication that risk assets should rise as a result. Any return towards recent highs, however, and the picture could swiftly look very different.The intraday DXY lows nonetheless saw the index return to support not tested since mid-August.U.S. dollar index (DXY) 1-day candle chart. Source: TradingViewCommenting on the longer-term performance, however, popular trading outfit Stockmoney Lizards said that DXY had broken a parabolic curve in place since 2021.“Correction will be good for Bitcoin,” part of Twitter comments added.U.S. dollar index (DXY) annotated chart. Source: Stockmoney Lizards/ Twitter”Buy the dip” fever hits as miner sales slowWhile many existing hodlers are attempting to withdraw coins from exchanges or figure out how to nurse losses, not everyone is sitting still.On-chain data suggests that as BTC/USD hit multi-year lows last week, investors both big and small took the opportunity to “buy the dip.”According to on-chain analytics firm Glassnode, wallets containing between 1 and 10 BTC saw a dramatic increase.Bitcoin addresses with 1-10 BTC chart. Source: GlassnodeThe trend also appears to be playing out among the largest hodler cohort, the “mega whales” of Bitcoin. These entities with a wallet balance of 10,000 BTC or more are also growing, and now number almost 130, Glassnode shows.“Whales are accumulating at a pace never seen before,” popular social media commentator Crypto Rover reacted.Bitcoin addresses with 10,000 BTC or more chart. Source: GlassnodeA group firmly not in accumulation mode at present, meanwhile, is miners. After a sharp reduction in their reserves last week, the BTC hodled by miners tracked by CryptoQuant is still trending downward.From 1,858,271 BTC on Nov. 8, miners’ reserves now total 1,853,606 BTC as of the time of writing on Nov. 14.Despite this, reserves remain higher than at the start of 2022, and recent sales amount to an insignificant portion of miners’ overall position.Bitcoin miner reserves chart. Source: CryptoQuantSentiment data offers a modicum of hopePredictably, overall crypto market sentiment took a major hit thanks to FTX — but is it really all that bad?Related: $3 billion in Bitcoin left exchanges this week amid FTX contagion fearsAccording to the Crypto Fear & Greed Index, the industry may in fact be taking the slew of bad news in its stride.Over the weekend, the Index’s score touched a local low of 20/100 — firmly characterizing the market mood as one of “extreme fear.”That represents a 50% drop versus the peak of 40/100 seen on Nov. 6, these marking a three-month sentiment high.Nonetheless, 2022 has seen much lower scores, Fear & Greed reaching just 6/100 over the course of the year.Should further fallout hit, even a fresh 50% dive from current levels would only take sentiment to the area which normally marks macro price bottoms for BTC/USD — around 10/100.Crypto Fear & Greed Index (screenshot). Source: Alternative.meThe views and opinions expressed here are solely those of the author and do not necessarily reflect the views of Cointelegraph.com. Every investment and trading move involves risk, you should conduct your own research when making a decision.

Čítaj viac

Získaj BONUS 8 € v Bitcoinoch

nakup bitcoin z karty

Registrácia Binance

Burza Binance

Aktuálne kurzy