Autor Cointelegraph By William Suberg

Bitcoin price stays under $77K as US bond yields near 20-year highs

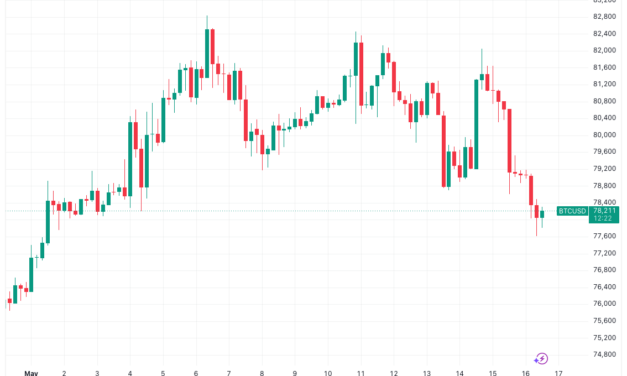
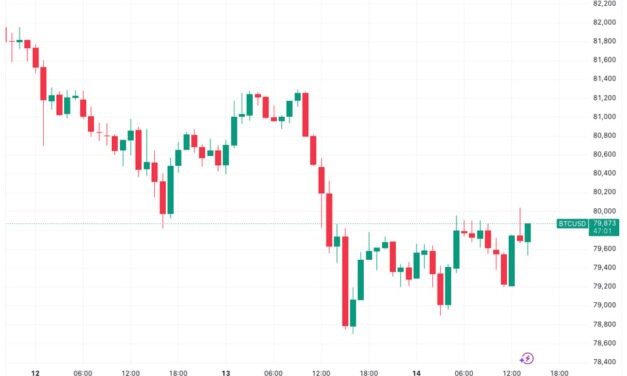
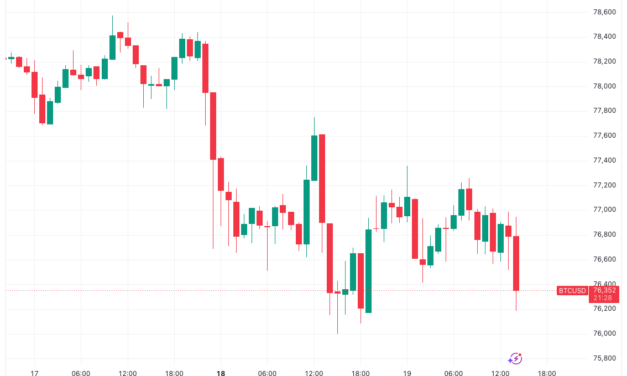
Bitcoin (BTC) consolidated near month-to-date lows on Tuesday as surging US bonds punished stocks and safe havens.Key points:Bitcoin joins risk assets feeling the pressure from skyrocketing US bond yields.Catalysts, such as high oil prices, continue to impact market sentiment with the US-Iran war stakes still high.Bitcoin is now at a “crucial level of support,” the latest market analysis warns.US 30-year yields reach highest since 2007Data from TradingView showed BTC/USD lingering below $77,000 around the Wall Street open while preserving the previous day’s floor.BTC/USD one-hour chart. Source: Cointelegraph/TradingViewMacro headwinds on the day continued to focus on US bond markets, with the 30-year yield hitting its highest levels since July 2007.This sparked downside pressure on stocks, along with gold and silver. XAU/USD fell below $4,500 to reach its lowest levels since late March.XAU/USD one-day chart. Source: Cointelegraph/TradingViewCommenting, Ole S. Hansen, head of commodity strategy at Saxobank, said that bonds reflected demand for “greater compensation for holding longer-dated debt amid war-driven energy inflation and mounting concerns over widening budget deficits.”“This development has sent gold below USD 4,500 support, highlighting the current market reaction function driven by oil, inflation expectations, bond yields, and central bank rate expectations,” he wrote in a reaction on X.US yield curve data. Source: Ole S. Hansen/XNews that US president Donald Trump had canceled strikes on Iran offered markets little relief.In a post on Truth Social, Trump added that gulf countries should be “prepared to go forward with a full, large scale assault of Iran, on a moment’s notice, in the event that an acceptable Deal is not reached” on the conflict.Source: Truth SocialBitcoin analysis sees “crucial” support holdingIn crypto circles, the outlook became gloomier. Trader and analyst Michaël van de Poppe warned of a double BTC price headwind of high bond yields and high oil prices.Related: BTC price ‘bull trap’ at $76.5K? Five things to know in Bitcoin this week“Neither of these are progressive for risk-on assets (including Bitcoin), which means that we clearly need to see those reverse in order to see strength pouring back into the ecosystem,” he told X followers.Van de Poppe said that Bitcoin itself did not “look great.”“Bitcoin is at a crucial level of support and it seems to be that it’s going to be holding,” a previous X post stated. “Anything lower of $75,000-76,000 might signal that the accumulation needs to take longer.”BTC/USDT one-day chart. Source: Michaël van de Poppe/X

Čítaj viac

BTC price ‘bull trap’ at $76.5K? Five things to know in Bitcoin this week

Bitcoin (BTC) starts a new week under pressure as support levels fade and macro gloom intensifies.Key points:Bitcoin falls below a key 21-week trend line after the weekly close, but hopes of a “bear trap” rebound remain.US-Iran war rhetoric continues to push oil higher, pressuring crypto markets.Those tensions could still be countered by strong PMI and Nvidia earnings data in the coming days.Bitcoin whales are acting as if the bottom is already in, per new analysis.Despite this, a surge in exchange inflows from a key investor cohort raises alarm over “capitulation.”  BTC price analysis sees relief bounce after sub-$77,000 dipBitcoin felt the pressure as the new weekly candle began, dropping to $76,500 — its lowest levels since May 1, per data from TradingView.After several support retests, BTC/USD began to fall through recently recovered ground, which included the 21-week exponential moving average (EMA) at $78,660.BTC/USD one-day chart with 21-week EMA. Source: Cointelegraph/TradingViewWith it, price fell back below the bull market support band.“Another weekly close at it for now, but to confirm a proper breakout you’d need to see a bounce now,” trader Daan Crypto Trades wrote in X analysis before the trip toward month-to-date lows. “If this ends up falling back below that $75K-$76K area and closes there on the weekly, then this was just a big deviation/dead cat bounce in my eyes.”BTC/USD one-week chart. Source: Daan Crypto Trades/XThe downside cost BTC long positions, with cross-crypto long liquidations for the 24 hours to the time of writing passing $670 million.Data from CoinGlass also shows potential liquidations building either side of spot price, providing fuel for liquidity grabs both up and down.BTC liquidation heatmap. Source: CoinGlassCommenting, trading account Cryptic Trades saw a bounce coming next due to the magnitude of liquidated longs.“$BTC has just tapped into the prior Breakout Zone at $75K-$76K,” it told X followers. “Expecting a bounce here, as the longs I covered in my prior alert also got flushed.”BTC/USD one-day chart. Source: Cryptic Trades/XAt the weekend, Cryptic Trades suggested that any downmove would have the markings of a classic “bear trap,” given rising open interest and negative funding rates.“This shows us that bears are DOUBLING DOWN right now and betting on a breakdown,” it wrote. “It also shows that even though the market structure remains intact, bears are shorting as if a breakdown already happened. That’s generally how bear-traps are formed.”US bond markets “collapsing in real time”While light on US macro data, the coming week is already shaping up to be a tricky one for crypto traders.Tensions over the US-Iran war are returning, with the prospect of the Strait of Hormuz oil route fully opening still absent.In a post on Truth Social over the weekend, US President Donald Trump wrote that the “clock is ticking” for Iran, without giving specific details.Source: Truth SocialAdditional reports claimed that Trump was convening a security meeting to discuss “military options in Iran,” per trading resource The Kobeissi Letter.Oil futures reacted sharply at the weekly open, with WTI crude reaching near two-week highs of $104.45.“The impact on energy prices from the war in the Middle East is pushing inflation to its highest level in years,” analytics resource Mosaic Asset Company commented in the latest edition of its regular newsletter, The Market Mosaic.CFDs on WTI crude oil one-day chart. Source: Cointelegraph/TradingViewLike others, Mosaic tied high oil prices to surging US inflation prints.“While a spike in energy prices are helping drive inflation higher, the most recent reports continue a trend of growing price pressures,” it continued.US bond markets, meanwhile, continue to sum up the about-turn in market sentiment, as “unsustainable” yield growth wipes out the odds of interest-rate cuts by the Federal Reserve.“On Friday, the 30-year Treasury yield jumped above the 5% level which is the high tested several times over the past couple years. A sustained breakout could have serious implications at a time when federal debt and deficit spending is surging,” Mosaic warned.US 30-year treasury yield chart. Source: Mosaic Asset CompanyKobeissi described the US bond market as “collapsing in real time.”“And, in a sudden turn of events, the odds of rate cuts have collapsed to 2% this year and US inflation is nearing 4%+,” it noted on X.PMI, Nvidia earnings give crypto bulls hopeAmid the chaos, a silver lining could come in the form of manufacturing data.The latest S&P Manufacturing Purchasing Managers Index (PMI) report, due out on Thursday, should ideally continue a breakout that began earlier in 2026.Bitcoin and risk assets reacted positively to the development, which ended several years of PMI contraction.Global PMI versus GDP data (screenshot). Source: S&P GlobalMajor tech earnings are also lining up to potentially offer markets a boost in the event that they surpass expectations. Nvidia will report on Wednesday — something that Kobeissi even calls the “biggest earnings event of the quarter.”Commenting on the outlook for market volatility, independent macro and market strategist Michael J. Kramer cautioned that bulls may ultimately suffer. “NVIDIA once again finds itself heavily overloaded with call positioning, and unless the stock sees a meaningful pullback ahead of earnings that helps reengage put demand, I think the most likely outcome is another post-earnings sell-off,” he wrote in an X thread on Sunday.Kramer predicted a surge in implied volatility toward Friday’s options expiry event.“So unless NVIDIA is able to truly blow traders away with its results, the stock likely faces the usual ‘sell-the-news’ reaction, or, as I like to call it, the mechanical unwind,” he reiterated.Bitcoin whales brush off hawkish Fed signalsIn its latest market overview, onchain analytics platform CryptoQuant examined the relationship between Fed policy and the actions of Bitcoin whales.These large-scale investors, often tied to “smart money” and a key yardstick for long-term market trajectory, could be signalling that the outlook is not as bad as sentiment shows.“Tracking their moves offers us a backdoor view into how the biggest players are reading the room, which in turn helps us stress-test and refine our own market thesis,” contributor Joohyun Ryu wrote in a QuickTake blog post this week. “To cut straight to the chase, the good news is that whale wallet balances haven’t shown any dramatic shifts.”BTC holdings per address tier (screenshot). Source: CryptoQuantAnalyzing whale holdings, Joohyun argued that despite the odds of rate cuts disappearing for both 2026 and 2027, there appears to be no real cause to reduce risk exposure. Some cohorts are even adding to their holdings.“On top of that, the ultimate mega-whales—those holding over 10K—are finally seeing their bags recover to levels we haven’t seen since last year,” he continued. “Judging by these trends, it looks like the whales are betting that the market has officially bottomed out. That said, this isn’t a full-blown buying frenzy just yet, so it’s still wise to proceed with caution.”Traditionally, financial tightening and an inflationary environment pressure crypto prices — a phenomenon most recently seen during the 2022 bear market.Long-term holders lose their nerveFor the time being, however, sell-side pressure remains a key threat to Bitcoin.Related: Bitcoin price history suggests 77% odds of new all-time high within a yearSpecifically, CryptoQuant notes a pronounced uptick in exchange inflows from wallets that bought BTC between six and 12 months ago.“Bitcoin is not facing a simple short-term correction, but a structurally driven crisis fueled by cascading leverage liquidations and deep spot-market fear.,” contributor Easy OnChain warned. “On-chain data shows a clear ‘cascading dumping’ pattern, where capitulation from long-term holders triggers panic selling among short-term investors.”Bitcoin exchange inflows data (screenshot). Source: CryptoQuantThe former cohort, hodling for up to 12 months, has accounted for 10.54% of exchange inflows since May 14 — more than 10 times normal levels.For CryptoQuant, this signals “large-scale capitulation.”“Historically, this reflects investors locking in major losses and exiting the market, creating severe spot-market selling pressure,” Easy On Chain continued, noting contagion spreading to speculators. “The current decline is therefore an internally driven market crisis caused by derivative liquidations, large-scale long-term holder capitulation, and cascading panic from short-term participants,” it added. “Until this toxic supply is fully absorbed and sentiment stabilizes, a rapid V-shaped recovery remains unlikely.”

Čítaj viac

Bitcoin analysis sees 'bear trap' as BTC price passes two-week lows under $78K

Bitcoin (BTC) circled $78,000 on Saturday after geopolitical headwinds erased most of its May gains.Key points:Bitcoin falls below $78,000 for the first time since the start of May.Oil-supply woes combine with existing nerves over US bond markets, adding to headwinds for risk assets.Support weakness has traders looking at $75,000 and under next, while optimists see a “bear trap” forming.Multiple hurdles “coming together” for crypto, risk assetsData from TradingView confirmed new lows of $77,614 on the day — the lowest levels since May 1.BTC/USD one-hour chart. Source: Cointelegraph/TradingViewDownside pressure stemming from concerns over US government bonds continued, with the US-Iran war also at the forefront of traders’ minds.Iran appeared to be pressing ahead with a toll system for transit through the Strait of Hormuz — the epicenter of a global oil-supply squeeze — while keeping US traffic out.As reported by trading resource The Kobeissi Letter among others, Hormuz would reportedly “remain closed to the operators of Project Freedom.”On Friday, analysis from Mosaic Asset Company spelled out the problems of the current geopolitical and macroeconomic climate for risk assets.“The prospect for another inflation wave is lining up with similarities to the surge in price levels into mid-2022,” it wrote in its latest Mosaic Chart Alerts blog post. “Disrupted supply chains from last year’s trade war, impact of war on energy markets, and stimulus via large federal budget deficits are coming together at the same time.”CFDs on US WTI crude oil one-hour chart. Source: Cointelegraph/TradingViewWTI crude oil finished the week trading above $100 per barrel.Bitcoin price action teases “bear trap”Among Bitcoin traders, there were ongoing mixed feelings about the bears’ strength below $80,000.Related: Bitcoin price history suggests 77% odds of new all-time high within a year“Over the last couple of days, the price has been going down slightly, while the open interest has climbed up. But things become interesting if we correlate this with Funding Rates, which have flipped negative,” X trading account Cryptic Trades wrote on X. “This shows us that bears are DOUBLING DOWN right now and betting on a breakdown. It also shows that even though the market structure remains intact, bears are shorting as if a breakdown already happened. That’s generally how bear-traps are formed.”BTC/USDT chart with open interest, funding rate data. Source: Cryptic Trades/XFor analyst Eric Coleman, a target for new local lows lay at around $75,000.“BTC went down after the breakdown retest of the ascending triangle,” he summarized alongside a chart showing relevant support/resistance flip levels.BTC/USDT four-hour chart. Source: Eric Coleman/XExamining exchange order-book liquidity, Daan Crypto Trades highlighted $71,000 as the nearest zone of interest below price.“The longer price compresses around this $80K region, the more liquidity will be building up on both sides which should result in a larger more aggressive move at some point,” he told X followers.BTC/USDT liquidation heatmap. Source: Daan Crypto Trades/X

Čítaj viac

Bitcoin risks ‘next downtrend’ as traders diverge on fate of $82K resistance

Bitcoin (BTC) risks starting its “next downtrend” as bulls fail to break beyond $82,000, the latest analysis warns.Key points:Bitcoin traders are beginning to sway toward a support retest or even a new “downtrend” for BTC/USD.Current price behavior has retained overhead resistance, with bulls unable to push through $82,000.Rangebound crypto markets spark $330 million in liquidations over 24 hours.Trader: BTC price will “likely break below” supportBitcoin traders are increasingly split on where BTC/USD will go next, but calls for lower levels are growing.“For now, price remains in range, within value, rotating just above the very key ‘range high,’” trading account JDK Analysis wrote in its latest updates on X.BTC/USD one-hour chart. Source: JDK Analysis/XAs Cointelegraph reported, that rangebound construction, in place through most of May, is bordered by a CME futures gap and a key 200-day trend line to the upside.With both staying in place for now, market participants are starting to assume that the bottom of the range will be retested instead.“Now it’s important to watch how price reacts at the support zone we already bounced from once before. In my opinion, we will likely break below it this time,” CGT Trader said. BTC/USD one-hour chart. Source: CGT Trader/XTrader BitBull went further, seeing the risk of a protracted period of downside BTC price pressure about to enter.“$BTC failed to reclaim the $82,000 level again,” they told X followers on Friday. “It seems like the next downtrend could start soon.”BTC/USDC one-day chart. Source: BitBull/XHopes for Bitcoin’s “massive catch-up” to stocks persistTrading circles are not without their more optimistic takes. Related: Bitcoin price history suggests 77% odds of new all-time high within a yearCryptic Trades predicts that BTC/USD will follow in the footsteps of US stock markets, which continue to post new all-time highs.“$BTC is going to play a massive catch-up in the upcoming weeks,” it summarized.Examining the Bollinger Bands volatility indicator, meanwhile, trader Cai Soren said that bulls “stepped in instantly” to defend support.Earlier, Cointelegraph noted bullish signals from the bands, which even caused their creator, John Bollinger, to act.“As long as support keeps holding, momentum still looks strong for continuation higher,” Soren forecast.BTC/USDT four-hour chart with Bollings Bands data. Source: Cai Soren/X Data from CoinGlass shows the impact of rangebound moves across crypto markets, with 24-hour liquidations roughly equal across both long and short positions.These totaled around $330 million at the time of writing.Crypto liquidation history (screenshot). Source: CoinGlass

Čítaj viac

Bitcoin holds key support for $85K breakout as S&P 500 hits new all-time high

Bitcoin (BTC) touched $80,000 around Thursday’s Wall Street open as US stocks hit fresh all-time highs and oil retested $100.Key points:Bitcoin rebounded to $80,000 while US stock markets hit new records, ignoring high inflation.Risk appetite is “skyrocketing,” analysis says, despite worries over central-bank policy tightening.Bitcoin can still head to $85,000 next, traders agree.Bitcoin recoups losses as US stocks ignore inflationData from TradingView showed BTC/USD recovering much of the previous day’s losses, which followed some of the highest US inflation data in four years. BTC/USD one-hour chart. Source: Cointelegraph/TradingViewUS stocks quickly shook off the numbers, despite the implications for future financial policy tightening. The S&P 500 posted its highest daily close on record, and continued to surge on Thursday. The Dow Jones Industrial Average revisited 50,000 points for the first time since early February.S&P 500 versus Dow Jones one-day chart. Source: Cointelegraph/TradingViewCommenting, trading resource The Kobeissi Letter reported “skyrocketing” risk appetite among investors.“Assets under management (AUM) in US leveraged ETFs are up to a record $177 billion. Since the March bottom, total leveraged ETF AUM has surged +$45 billion,” it wrote in its latest analysis on X.Leveraged ETF AUM data. Source: The Kobeissi Letter/XKobeissi used the same term to describe global money-supply growth — a crypto and risk-asset tailwind at odds with concerns that central banks were adopting a “hawkish stance.” “Meanwhile, US M2 money supply jumped +$1 trillion YoY, or +4.6%, to a record $22.7 trillion,” it continued. “Money supply growth is accelerating.”Global money supply data. Source: The Kobeissi Letter/XAs the US-Iran war rumbled on, oil prices seemed unable to crack new highs, with WTI crude retesting the $100 per barrel mark from above.CFDs on WTI crude oil one-day chart. Source: Cointelegraph/TradingView”Most important” BTC price support still in playLooking at BTC price action, trader Daan Crypto Trades saw the market at a “pivotal level.”Related: Bitcoin price history suggests 77% odds of new all-time high within a year“Hanging on to that ~$79.4K level which marked the previous highs in April,” he told X followers.An accompanying chart showed the 200-period simple (SMA) and exponential (EMA) moving averages trending higher toward the spot price.BTC/USDT perpetual contract four-hour chart. Source: Daan Crypto Trades/XOn the same topic, fellow trader CrypNuevo saw the potential for BTC/USD to head to new multi-month highs at the 50-week EMA should that support hold.“Bitcoin is at the most important level,” he agreed on Wednesday. “If it holds the range highs here, then it’ll push towards the 1W50EMA at $84k-$85k. But a failure to hold this level could trigger a rotation back to the mid-range, potentially exposing range lows if momentum doesn’t shift.”BTC/USDT one-day chart. Source: CrypNuevo/X

Čítaj viac

Získaj BONUS 8 € v Bitcoinoch

nakup bitcoin z karty

Registrácia Binance

Burza Binance

Aktuálne kurzy