Autor Cointelegraph By William Suberg

How low can the Bitcoin price go?

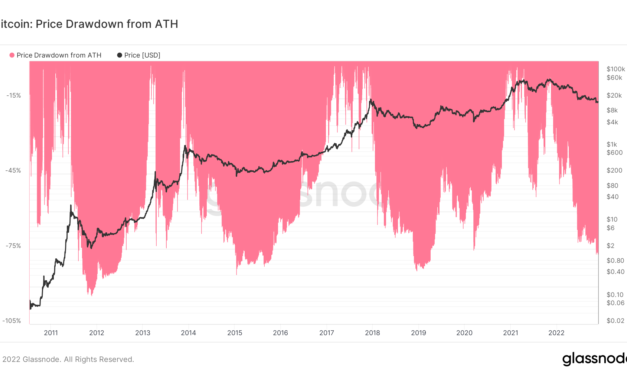
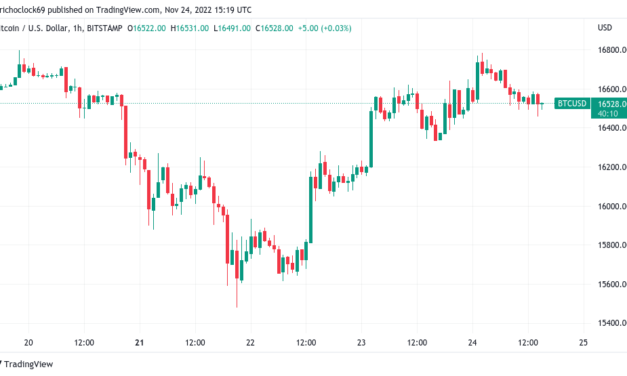
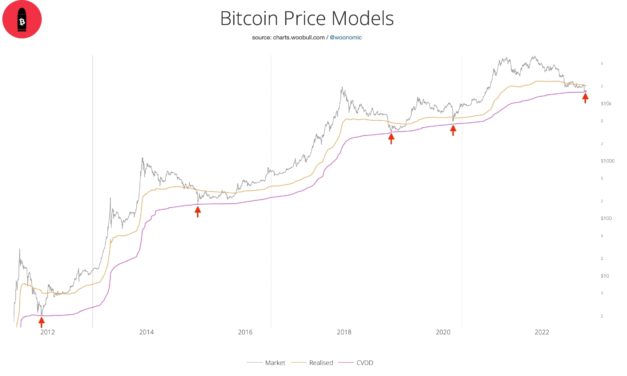
Bitcoin (BTC) has spent over a year in a downtrend since its $69,000 all-time highs in November 2021.BTC price performance has given investors up to 77% losses, but how much lower can BTC/USD really go?Bitcoin traders and analysts have long agreed that 2022 is the year of the largest cryptocurrency’s newest bear market.After coming off all-time highs to start the year at around $46,000, BTC/USD has offered little relief and has since returned to levels not seen since November 2020, data from Cointelegraph Markets Pro and TradingView confirms.That has placed the pair in historical bear market bottom territory — having lost a maximum of around 77% since the most recent peak, Bitcoin could have little room left to fall.This time, however, may be different. Cointelegraph takes a look at what some of the most popular crypto market commentators think when it comes to where Bitcoin will bottom.CryptoBullet: “Comfortable buying” around $16,000One well-known social media personality is sticking by a theory from earlier in 2022 — and it’s all about one particular on-chain metric.For CryptoBullet, Cumulative Value Days Destroyed (CVDD) still offers a key insight into macro BTC price bottoms.CVDD essentially counts how much “hodled” days a coin has accumulated when it moves to a new wallet. It is expressed as a ratio to the overall age of the market, divided by 6 million, which analytics resource Woobull explains is a “calibration factor.”Looking back in time, CVDD has acted as a significant line in the sand, and if this time is no different, BTC/USD could already be giving buyers the best possible profit opportunity.According to Woobull, CVDD currently lies at around $15,900.“I feel comfortable buying Bitcoin here at CVDD,” CryptoBullet told Twitter followers on Nov. 26. “Can it go lower? Of course it can. If another crypto company goes bankrupt or something like that $BTC will fall below CVDD, but not by much. The bulk of the downtrend is over.”Bitcoin Cumulative Value Days Destroyed (CVDD) annotated chart. Source: CryptoBullet/ TwitterFilbfilb: $6,500 as “worst case scenario”An old hand in the crypto market is constantly reevaluating just how bad the bears may bite this time around.Filbfilb, co-founder of trading suite Decentrader, recently told Cointelegraph that BTC/USD could see $10,000 around the new year if macro conditions worsen.That was before the FTX debacle, however, and the resulting fuel added to the bear market fire has caused him to reconsider.In a livestream together with fellow co-founder, Philip Swift, Filbfilb thus outlined areas of strong bid support as potential bottoms.These vary, however — a large “ladder” of bids lies just below spot price and focuses on $12,000-$14,000. At the same time, ultimate support could come as low as $6,000.Filbfilb additionally noted that a black swan event such as further crypto bankruptcies could trigger a spike through the upper support field, opening up the potential for $10,000 or lower next.A trip to the $6,000 zone, however, is “unlikely” under current circumstances, he advised.BTC/USD 1-week candle chart (Bitstamp) with liquidity heatmap data. Source: TradingViewMany eyes on the $14,000 prizeFilbfilb’s upper band of bid support on exchange order books is a popular target for an increasing number of commentators.Related: Will Bitcoin hit $110K in 2023? 3 reasons to be bullish on BTC nowAs Cointelegraph reported, $14,000 is now a significant spot on the radar, and entries around there are already being planned.That area would also bring BTC/USD losses versus all-time highs in line with those of previous bear markets.BTC/USD drawdown vs. all-time highs chart. Source: GlassnodeNot only that, but $13,900 forms a significant support line on weekly timeframes, trader and analyst Rekt Capital notes, one which has remained untested since the second half of 2020.BTC/USD annotated chart. Source: Rekt Capital/ TwitterThe views, thoughts and opinions expressed here are the authors’ alone and do not necessarily reflect or represent the views and opinions of Cointelegraph.

Čítaj viac

Bitcoin’s new ‘worst case scenario’ puts BTC bear market bottom near $6K

Bitcoin (BTC) still risks a drop to below $7,000 in this bear market, the latest worst-case scenario prediction warns.In its latest livestream broadcasted on Nov. 24, trading platform DecenTrader revealed targets for a BTC price bottom.Analyst flags “oldschool, rock-hard support” for BitcThe most recent in a series of BTC/USD forecasts, Decentrader co-founder Filbfilb mapped out a potential sub-$10,000 dip on the cards for the pair.“In my worst case scenario, I think that would be probably where we end up, like oldschool, rock-hard support,” he said about a bidding zone around $6,500.This is where buyers would “probably start refilling their bags,” he added, noting that that level was approximately double the 2018 bear market and March 2020 COVID-19 crash lows.While “unlikely” under current circumstances, Filbfilb nonetheless argued that more significant repercussions from the FTX implosion could remove bid support higher up the order book, opening up the door for such a capitulation event.“Until we have further information, that seems unlikely, and as I say, I think the fact that we haven’t dumped harder than we actually really could have done is a good sign for the bulls,” he continued.Given recent events, as Cointelegraph reported, BTC/USD has, in fact, managed to dip less compared with its previous all-time highs than during previous bear markets.BTC/USD price drawdown from all-time highs chart. Source: GlassnodeAn associated debate revolves around whether a deeper dive is necessary to match those bottoms and put an end to the current downtrend.Filbfilb commented that for Bitcoin to put in a bottom while avoiding the worst case scenario, crypto would need to “dodge some bullets” regarding FTX fallout, and macro markets would also need to stay strong.BTC price navigates bear market pitsElsewhere in the livestream, Decentrader co-founder Philip Swift, also the creator of data resource LookIntoBitcoin, explained other recent chart phenomena.Related: Will Bitcoin hit $110K in 2023? 3 reasons to be bullish on BTC nowAmong them was the increasing number of Bitcoin wallets that now contain at least 1 BTC, the tally soon set to cross one million for the first time.This is a direct result of exchange withdrawals in light of FTX, Swift said.Although 18 months ahead, the next Bitcoin block subsidy halving event in 2024 will also become a major narrative focus going forward, he added.That in turn will have “some positive effect on price in terms of media coverage and anticipation of that next halving event.”A comparative chart showed BTC/USD currently working through the lowest part of its four-year cycle, showing a strong correlation between 2014 and 2018.Bitcoin bull market comparison chart (screenshot). Source: DecentraderThe views, thoughts and opinions expressed here are the authors’ alone and do not necessarily reflect or represent the views and opinions of Cointelegraph.

Čítaj viac

Will Bitcoin hit $110K in 2023? 3 reasons to be bullish on BTC now

Bitcoin (BTC) may follow stocks on a “massive bull run” as the weekly chart delivers a unique sign of strength.The latest analysis from several well-known crypto names suggests it is time to give up the bear market narrative.Despite everyone talking about a new macro BTC price low, possibly at $12,000, new perspectives demand a rethink.Be it thanks to macro or just good old Bitcoin price cycles, there are three new reasons to flip bullish on Bitcoin in its current state near two-year lows.Stocks rally could produce $110,000 BTC priceFirst in line is a theory involving a macro market catalyst, courtesy of macro analyst, Henrik Zeberg.In a tweet from Nov. 24, Zeberg maintained that Bitcoin is still acting just like other risk assets — but notably, “not like gold.” With the FTX scandal weakening the correlation between BTC and stocks, there is nonetheless no reason to abandon the idea that it will return.For Zeberg, a rising tide lifts all boats, and a final rally throughout the risk asset field could take BTC/USD over $100,000.“Bitcoin moves as a Risk Asset (not like Gold!). When SPX explodes higher in Blow-Off Top towards 5700 – 6000 target area – Bitcoin should reach 90k – 110k,” he wrote:“Final rally before Deflationary Bust!”An accompanying chart appeared to put the rally beginning at the start of 2023.BTC/USD vs. S&P 500 annotated chart. Source: Henrik Zeberg/ TwitterIndicator bull div echoes March 2020Back to crypto-centric triggers and on-balance volume (OBV) is one of the indicators giving a taste of possible bullish times to come.According to popular trader Alan Tardigrade, now is the time to pay attention as the BTC/USD weekly chart has printed 20 weeks of bullish divergence. “This indicates the weakening of downtrend momentum,” part of accompanying Twitter comments read:“$BTC may pick up a Massive Rally.”BTC/USD annotated chart with OBV. Source: Alan Tardigrade/ TwitterA move to the upside would correspond to Bitcoin’s behavior after the March 2020 COVID-19 cross-market crash.OBV acts as a cumulative measure of buy and sell pressure by keeping a running tally of volume across a given time period. It is similar to cumulative volume delta, but encompasses more than simply bid and ask trades.Trader: RSI bull div is first for BitcoinOBV is not the only bullish divergence making waves in Bitcoin analytics circles.Related: Bitcoin exchanges see 180K BTC supply decrease amid Mt. Gox BTC salesFor Bitcoin trader and technical analyst Mags, a phenomenon playing out for the first time in Bitcoin’s history is the event to monitor going forward.Again consulting the weekly chart, Mags noted that the BTC/USD relative strength index (RSI) is now printing a bullish divergence on weekly timeframes — something never seen before, not even at previous bear market lows.“Every Bull Market Peak $BTC formed a bearish divergence on RSI followed by a bear market correction!” he explained:“This the first time ever BTC is printing a bullish divergence on WEEKLY. Probably nothing.”BTC/USD annotated chart with . Source: Mags/ TwitterThe views, thoughts and opinions expressed here are the authors’ alone and do not necessarily reflect or represent the views and opinions of Cointelegraph.

Čítaj viac

Bitcoin price still due $12K dip, says trader as ETF guru backs GBTC

Bitcoin (BTC) stayed undecided at the Nov. 24 Wall Street open as one trader reinforced a $12,000 BTC price target.BTC/USD 1-hour candle chart (Bitstamp). Source: TradingViewBTC price “main target” for bottom $12,000-$14,000Data from Cointelegraph Markets Pro and TradingView showed BTC/USD circling $16,500 as an eerie calm continued on the market.The pair nonetheless failed to convince analysts that better times were on the way, and popular commentator Il Capo of Crypto suggested that it was only a matter of time before downside resumed.On both high timeframes (HTF) and low timeframes (LTF), the picture looked bleak.“Htf: lower lows and lower highs after breaking a monthly redistribution range. Below June’s low and at supply zone. Ltf: weak trend caused by a short squeeze (bull trap). Volume dying,” he summarized to Twitter followers on the day. “12000-14000 remains the main target for a local bottom formation.”BTC/USD annotated chart. Source: Il Capo of Crypto/ TwitterAs Cointelegraph reported, multiple BTC price forecasts continue to call for a sub-$14,000 bear market bottom.Replying to Il Capo of Crypto, meanwhile, fellow analyst Gert van Lagen offered a potential upside resistance/ support flip at $18,100 as a bullish cue.BTC/USD rising from current levels to hold there, he wrote, would make the recent two-year low of $15,480 a “triple bottom” for 2022.“It qualifies indeed only if 18.1k gets broken,” Van Lagen stressed.Analyst: “99.9% chance” GBTC Bitcoin existsWithin crypto circles, the fate of Digital Currency Group (DCG), its subsidiary, Grayscale and the Grayscale Bitcoin Trust (GBTC) continued to constitute a major talking point.Related: Cathie Wood’s ARK Invest adds more Bitcoin exposure as GBTC, Coinbase stock hit new lowsOne of the latest contributions came from Bloomberg Intelligence exchange-traded fund (ETF) analyst James Seyffart, who in a dedicated Twitter thread said that despite market nerves, voluntary liquidation of the $10.5 billion GBTC was “unlikely.”“That just doesn’t seem like its on the table to me,” he wrote.Acknowledging frustration at the fund’s discount to the Bitcoin spot price, Seyffart concluded that ultimately, given the material available, there was a “99.9% chance” that it held the BTC it claimed via custodian Coinbase.The GBTC spot price discount was at 39.2% as of Nov. 24, data from monitoring resource Coinglass showed.GBTC premium vs. asset holdings vs. BTC/USD chart. Source: CoinglassThe views, thoughts and opinions expressed here are the authors’ alone and do not necessarily reflect or represent the views and opinions of Cointelegraph.

Čítaj viac

Bitcoin exchanges see 180K BTC supply decrease amid Mt. Gox BTC sales

Bitcoin (BTC) exchanges may have just seen the largest exodus of user funds ever, data suggests.Data from on-chain analytics firm Glassnode shows that on Nov. 23, major exchanges were down almost 179,000 BTC in monthly withdrawals.Major exchanges see record BTC withdrawalsWith FTX contagion still in the air, exchange users have been busy withdrawing funds to noncustodial wallets.As Cointelegraph reported, $3 billion worth of cryptocurrency left major platforms in the immediate aftermath of FTX imploding.That trend is ongoing, Glassnode shows, with its data capturing the largest-ever decrease in exchange BTC reserves for the 30 days to Nov. 23.Glassnode’s Exchange Net Position Change metric puts the 30-day change of the BTC supply held in exchange wallets at -178,683 BTC. The metric covers 20 exchanges, including FTX.Exchange BTC net position change chart. Source: GlassnodeOn a day-to-day basis, exchange user habits remain volatile. After seeing nearly 140,000 BTC in daily outflows on Nov. 9 alone, exchanges processed less in withdrawals, with a local low of under 19,000 BTC recorded for Nov. 19.Since then, however, the trend has reversed, and Nov. 23 outflows totaled more than 86,000 BTC, according to Glassnode.BTC total transfer volume from exchanges chart. Source: GlassnodeHitBTC gets Mt. Gox hack depositElsewhere, fellow on-chain analytics platform CryptoQuant raised the alarm about a major tranche of BTC from the 2014 hack of exchange Mt. Gox.Related: Crypto has survived worse than the fall of FTX: ChainalysisAccording to CEO, Ki Young Ju, the stolen BTC is on the move, with 65 BTC sent to exchange HitBTC.“7-year-old 10,000 $BTC moved today. No surprise, it’s from criminals, like most of the old Bitcoins. It’s the BTC-e exchange wallet related to the 2014 Mt. Gox hack. They sent 65 BTC to hitbtc a few hours ago, so it’s not a gov auction or something,” he tweeted.Ki called on HitBTC to freeze funds from the incoming wallet.Bitcoin exchange inflows (BTC last moved at least 7 years ago). Source: CryptoQuantSeparate research from Chainalysis meanwhile noted mass processing of Mt. Gox coins associated with exchange BTC-e, which itself shut down in 2017.Several exchanges, along with private wallets and others, have received BTC-e bitcoins in recent weeks, it explained in a blog post on Nov. 23.As Cointelegraph reported, movement of old coins in September also sparked panic, as the Mt. Gox rehabilitation process drew to an end.This article does not contain investment advice or recommendations. Every investment and trading move involves risk, and readers should conduct their own research when making a decision.

Čítaj viac

Získaj BONUS 8 € v Bitcoinoch

nakup bitcoin z karty

Registrácia Binance

Burza Binance

Aktuálne kurzy