Autor Cointelegraph By William Suberg

Bitcoin capitulation 4th-worst ever as BTC hodlers lose $10B in a week

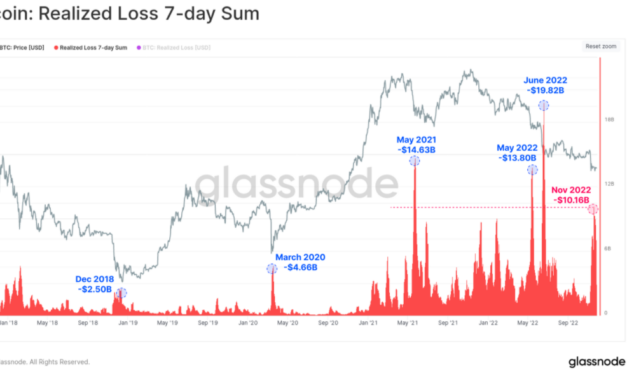
Bitcoin (BTC) hodlers have capitulated more than at almost any point in Bitcoin’s history this month.Data from on-chain analytics firm Glassnode confirms that the November 2022 BTC sell-off was the fourth-largest ever.Bitcoin investors see multi-billion-dollar lossesIn the latest edition of its weekly newsletter, “The Week On-Chain,” Glassnode got to grips with the impact of the FTX debacle on BTC investors.The results have been mixed, it reveals, with a major loss of confidence, on one hand, triggering loss-making divestment of funds, while “strong accumulation” has also occurred.For those entering BTC in current conditions, however, life has been anything but easy.“One consistent event which motivates the transition from a bear back towards a bull market is the dramatic realization of losses, as investors give up and capitulate at scale,” Glassnode explained. “November has seen the fourth largest capitulation event on record, recording a 7-day realized loss of -$10.16B. This is 4.0x larger than the peak in Dec 2018, and 2.2x larger than March 2020.”Bitcoin realized loss 7-day sum annotated chart (screenshot). Source: GlassnodeWhile the dollar-value capitulation can be explained thanks to BTC/USD trading five times higher than in late 2018 and 4.5 times higher than in March 2020, it is no secret that cold feet have characterized crypto markets since FTX imploded.As Cointelegraph reported, directly following the event, hodlers were sitting on 50% of the BTC supply at an unrealized loss.Glassnode referenced Bitcoin’s adjusted market-value-to-realized-value (MVRV) ratio, which shows that coins moving on-chain are returning loss-making levels rarely seen before in what it calls “peak under-performance.”Adjusted MVRV ratio is the relationship between the market value of BTC and its realized value, minus the profit impact of coins dormant for seven years or longer.“This metric is currently returning a value of 0.63 (average unrealized loss of 37%), which is very significant since only 1.57% of trading days in bitcoin history have recorded a lower Adjusted MVRV value,” the newsletter stated. “In other words, if we discount profit held across the presumably lost supply, the current market is the most underwater it has been since the near pico-bottom set in Dec 2018 and Jan 2015.”Bitcoin adjusted MVRV ratio annotated chart (screenshot). Source: GlassnodeBuying the dip like it’s December 2018“The Week On-Chain” nonetheless contains some good news for market participants.Related: Bitcoin shrugs off BlockFi, China protests as BTC price holds $16KDespite the previous losses, hodlers have been accumulating BTC aggressively since — and the trend is encompassing everyone, from the smallest “shrimps” to the largest whales.“From a comparative point of view, the recent strong accumulation score following the recent sell-off resembles that of late 2018,” Glassnode stated.It added that similar black swan events in Bitcoin’s past, including recent ones such as the collapse of Terra’s LUNA, sparked similar investor reactions.An accompanying chart, the seven-day moving average (MA) of the Accumulation Trend Score, showed current conditions as purple — characteristic of mass accumulation. Yellow, conversely, points to mass distribution of BTC on the market.Bitcoin Accumulation Trend Score (7-day MA) annotated chart (screenshot). Source: GlassnodeThe views, thoughts and opinions expressed here are the authors’ alone and do not necessarily reflect or represent the views and opinions of Cointelegraph.

Čítaj viac

Bitcoin shrugs off BlockFi, China protests as BTC price holds $16K

Bitcoin (BTC) held crucial $16,000 support into Nov. 29 as bulls weathered ongoing FTX fallout and macro triggers.BTC/USD 1-hour candle chart (Bitstamp). Source: TradingViewTrader teases BTC long as $16,500 reappearsData from Cointelegraph Markets Pro and TradingView confirmed BTC/USD leaving lower levels untouched overnight.The pair had seen a flash downturn after the Nov. 27 weekly close thanks to uncertainty from China over COVID-19 measures.A recovery nonetheless took the market higher, with $16,500 coming into play at the time of writing. As Cointelegraph reported, traders and analysts had warned that it was all but essential to preserve current support, with a violation opening up the road to $14,000 or lower.Popular trader Crypto Tony even felt comfortable going long BTC on the day.“Flipping the EQ would be a safer long entry, but keeping this open with a tight stop loss is the best way for me,” he revealed to Twitter followers.An accompanying chart identified support and resistance zones in play on midrange timeframes.BTC/USD annotated chart. Source: Crypto Tony/ TwitterEven fresh repercussions over the FTX debacle failed to dent Bitcoin’s performance. Meanwhile, these came in the form of a bankruptcy filing and lawsuit from crypto lender BlockFi.The latest in a chain reaction sparked by FTX going under, the news came alongside a surprise resumption of salary payments by the defunct exchange.“Makes sense after this bounce, as we’ve created a HL on Bitcoin and aiming at resistance again,” Michaël van de Poppe, founder and CEO of trading firm Eight, continued about a higher low (HL) on the 4-hour chart:“Taking out the range between $16.5-16.8K would trigger continuation towards $18K.”BTC/USD annotated chart. Source: Michaël van de Poppe/ TwitterChina woes cool ahead of Fed Powell speechChina meanwhile formed the main macro focus on the day, with anti-lockdown protests’ impact on market sentiment nonetheless seeming to ease.Related: New BTC miner capitulation? 5 things to know in Bitcoin this weekAsian markets bounced back strongly, with Hong Kong’s Hang Seng up 5.2% at the time of writing and the Shanghai Composite Index gaining 2.3%.Hang Seng Index (HSI) 1-hour candle chart. Source: TradingView“We do not expect China policy to publicly shift away from the Zero Covid stance, however, we could see some easing of the policy privately and in localized areas,” Mohit Kumar, an analyst at investment banking firm Jefferies, wrote in a note quoted by Bloomberg.Nov. 30 looked set to be the key trading day of the week, with Bitcoin’s monthly close accompanied by a speech from Jerome Powell, Chair of the United States Federal Reserve.The views, thoughts and opinions expressed here are the authors’ alone and do not necessarily reflect or represent the views and opinions of Cointelegraph.

Čítaj viac

Bitcoin will ‘teleport’ to $14K or worse if BTC breaks $16K — Analyst

Bitcoin (BTC) hovered above $16,000 on the Nov. 28 Wall Street open as analysts diverged on what to expect from the next market move.BTC/USD 1-hour candle chart (Bitstamp). Source: TradingViewBitcoin spot price near key supportData from Cointelegraph Markets Pro and TradingView showed BTC/USD maintaining the $16,000 support level at the time of writing amid misgivings over China’s impact on risk assets.After a modestly higher weekly close, the pair still lacked volatility as one commentator warned of a “teleport” toward $12,000 should $16,000 break.“When it breaks below 16k, it teleports to 12k-14k,” Il Capo of Crypto insisted.Popular Twitter account Credible Crypto asked where the volatility had gone, while Crypto Tony likewise identified $16,000 as a line in the sand for his own trading strategy.“Finally some movement .. Stop loss firmly remains at $16,000, but will close if hit and look for shorts if we then proceed to close below the support zone and flip into resistance,” part of a tweet read on the day. BTC/USD annotated chart. Source: Crypto Tony/TwitterFellow trader Pentoshi meanwhile focused on macro triggers as Chinese protests over the country’s COVID-19 containment strategies weighed on sentiment. The S&P 500, he predicted, was due a rejection next, setting the tone for a long-term downtrend to continue.S&P 500 1-week candle chart. Source: TradingView$19,500 could become the new BTC price ceilingOthers drew attention to the upcoming monthly close amid a lack of catalysts elsewhere at the start of the week.Related: New BTC miner capitulation? 5 things to know in Bitcoin this weekBeyond a source of potential volatility, trader and analyst Rekt Capital noted that Bitcoin’s monthly closing price would determine its longer-term price range.“When BTC lost the ~$19500 level as support… It broke down into the ~$13900-$19500 Monthly Range,” he explained on the day. “Monthly Candle Close is coming up soon. A Monthly Close below ~$19500 would likely confirm the ~$13900-$19500 Range as its new playground.”BTC/USD annotated chart. Source: Rekt Capital/TwitterBTC/USD was down around 21% for the month of November at the time of writing, marking its worst November performance since its last bear market year in 2018. BTC/USD monthly returns chart (screenshot). Source: CoinglassCointelegraph previously outlined potential bottom targets for the pair, among them those based on performance during previous bear markets.The views, thoughts and opinions expressed here are the authors’ alone and do not necessarily reflect or represent the views and opinions of Cointelegraph.

Čítaj viac

New BTC miner capitulation? 5 things to know in Bitcoin this week

Bitcoin (BTC) prepares to exit a grim November just above $16,000 — what could be on the menu for BTC price this week?In a time of what analyst Willy Woo has called “unprecedented deleveraging,” Bitcoin is far from out of the woods after losing over 20% this month.The impact of the FTX implosion remains unknown, and warning signs continue to flow in even after the first wave of crypto business bankruptcies.In particular this week, eyes are on miners, who are seeing profits squeezed by falling spot price and surging hash rate.Upheaval is in the air, and should another “capitulation” among miners occur, the entire ecosystem could be in for a further shock.As “max pain” looms for the average hodler, Cointelegraph takes a look at some of the main factors affecting BTC/USD in the short term.Bitcoin miners due “capitulation” — analystLike others, Bitcoin miners are seeing a major squeeze when it comes to selling accumulated BTC at a profit. It remains to be seen exactly how much financial pain the average miner is in, but one classic metric is preparing to call “capitulation” once more.Just months after the last such period, Hash Ribbons is warning that conditions are again becoming unsustainable.Hash Ribbons uses two moving averages of hash rate to infer conclusions about miner participation in the Bitcoin network. Crossovers of the trend lines denote capitulatory and recovery phases.For Kripto Mevismi, a contributor to on-chain analytics platform CryptoQuant, the time is approaching for the former to reappear.“So right now bitcoin difficulty is really high for miners so that means; costs are getting higher and doing business in this kind of environment is getting harder,” he wrote in a blog post. “That’s why miners do not work in full force. If they have efficient- new generation mining machines, they put them into work but that’s all. Inflation is high and people feels effect of living costs, bitcoin price is declining, mining cost and difficulty is getting higher. Tough environment for miners.”Bitcoin Hash Ribbons chart. Source: LookIntoBitcoinKripto Mevismi added that a significant change in mining difficulty could help the situation. Estimates from BTC.com for the next adjustment on Dec. 6 put the difficulty drop at 6.4% at the time of writing. Should it go to fruition, it will be the largest such drop since July 2021.BTC.com and others likewise estimate that hash rate is now declining from record levels as miners wind down operations.Bitcoin network fundamentals overview (screenshot). Source: BTC.comBTC/USD eyes volatility into monthly closeBTC/USD managed to stave off significant weekly losses at the latest candle close on Nov. 27.At around $16,400, the weekly close was a whisker higher than the previous week, with the pair still circling two-year lows, data from Cointelegraph Markets Pro and TradingView shows.BTC/USD 1-week candle chart (Bitstamp). Source: TradingViewWith a lack of volatility characterizing intraday price action, traders and analysts remain cautious on the next step.“It’s a long holiday weekend so expect things to get interesting as we move towards the Weekly and Monthly close,” on-chain analytics resource Material Indicators wrote in part of a tweet last week.A subsequent post reiterated that the Nov. 30 close would likely spark fresh instability, with BTC/USD currently 21.25% down versus the start of the month.This makes November 2022 Bitcoin’s worst November since its previous bear market year in 2018, data from Coinglass confirms.BTC/USD monthly returns chart (screenshot). Source: CoinglassOn shorter timeframes, popular trader Crypto Tony meanwhile highlighted $16,000 as a key zone to flip for higher levels to enter next, while keeping mindful of the longer-term trend.BTC/USD annotated chart. Source: Crypto Tony/ Twitter“Lower highs along with consolidating below a major resistance zone. If you want to enter safely, wait for a flip of the lows,” he summarized at the weekend.BTC/USD annotated chart. Source: Crypto Tony/ TwitterAs Cointelegraph extensively reported, Bitcoin’s next bear market bottom is the discussion point of the moment at present, and certain targets have become more popular than others.One vocal commentator calling for further downside, Il Capo of Crypto, thus reiterated his opinion that $12,000 could be next for BTC/USD.Highlighting the relationship between perpetual futures trading volume and spot price, he warned that current market structure was not supportive of further gains.“12000-14000 is likely. 40-50% drop for altcoins,” he stressed.Under the Bitcoin sea, hodlers accumulateBig or small, the population of the Bitcoin ecosystem is “aggressively” adding to its BTC exposure this month. In a positive sign for a future supply squeeze — where demand comes up against a larger portion of illiquid supply — accumulation appears to be gathering pace.According to on-chain analytics firm Glassnode, it is retail investors mostly responsible for the current trend.The smaller investors, referred to variously as “crabs” and “shrimps” depending on wallet balance, are increasing in numbers.“Bitcoin Shrimps (< 1$BTC) have added 96.2k $BTC to their holdings since FTX collapsed, an all-time high balance increase. This cohort now now hold over 1.21M $BTC, equivalent to 6.3% of the circulating supply,” Glassnode showed in a Twitter thread about the phenomenon.Bitcoin shrimp net position change chart. Source: Glassnode/ TwitterA further post noted:“Crabs (up to 10 $BTC) have also seen aggressive balance increase of 191.6k $BTC over the last 30-days. This is a convincing all-time-high, eclipsing the July 2022 peak of 126k $BTC/month.”Bitcoin "crab" net position change chart. Source: Glassnode/ TwitterAs Cointelegraph reported, part of the increase in smaller wallet numbers could be down to exchange users withdrawing funds to private storage.Woo flags inbound "max pain"For Willy Woo, the analyst behind popular statistics resource Woobull, on-chain metrics are pointing to Bitcoin’s next macro bottom being imminent.Highlighting three of them this weekend, Woo showed that to all intents and purposes, Bitcoin is behaving exactly as it did in the pit of previous bear markets.The portion of the BTC supply held at an unrealized loss, for example, is approaching macro lows, a phenomenon covered by the “Max Pain” model.“Bitcoin bottom is getting close under the Max Pain model. Historically BTC price reaches macro cycle bottoms when 58%-61% of coins are underwater (orange). Green shading adjusts for the coins locked up inside GBTC Trust,” Woo explained alongside a chart. Bitcoin Max Pain annotated chart. Source: Willy Woo/ TwitterContinuing, he noted that the MVRV Ratio value for BTC/USD is also targeting a “buy” zone, which has historically given investors maximum profit potential.MVRV is Bitcoin’s market cap divided by realized cap — the aggregate price at which each Bitcoin last moved. The resulting number has delivered buy and sell zones corresponding to price extremes.“MVRV ratio is deep inside the value zone,” Woo’s commentary stated. “Under this signal we were in already bottoming (1) until the latest FTX white swan debacle brought us back into a buy zone (2).”Bitcoin MVRV annotated chart. Source: Willy Woo/ TwitterWoo’s third chart, Cumulative Value Days Destroyed (CVDD), was recently covered by Cointelegraph.“Use these charts at your own discretion, we are in an unprecedented time of deleveraging,” he added, cautioning that “Past cycles do not necessarily reflect future ones.”Macro mood rocked by China protestsSome key economic data from the United States is due this week, but crypto analysts are more focused on China. With an already fragile status quo hanging on inflation trends, unrest in the world’s factory could unsettle market performance, some warn.China is in the grip of a wave of protests against the government’s policy on COVID-19, with multiple cities defying lockdowns to demand an end to “COVID zero.”With this in mind, risk assets could be in for a rough ride if the situation spirals out of control.“Crucial area of Bitcoin couldn't break, so we're still consolidating within that range. On support now,” Michaël van de Poppe, founder and CEO of trading firm Eight, explained. “If this is lost, I'd expect new lows to be seen on the markets, probably depending on China & FTX contagion this week.”Even mainstream media were warning of potential repercussions on the day, with John Toro, head of trading at exchange Independent Reserve, telling Bloomberg that “elevated contagion risk is being profiled into the cryptocurrency complex.”Asian stock markets were modestly down on the day, with Hong Kong’s Hang Seng and the Shanghai Composite Index down 1.6% and 0.75%, respectively at the time of writing.Hang Seng Index 1-day candle chart. Source: TradingViewBitcoin bottoms in crude oilOn a related macro note, Bitcoin is now in line for “outperformance” in U.S. dollar terms, one well-known analyst has said.Related: Bitcoin may need $1B more on-chain losses before new BTC price bottomIn WTI crude oil terms, BTC price action is already at a macro low — and history calls for a resurgence, which includes a significant appreciation trend against USD.“We're finally at channel bottom,” TechDev confirmed at the weekend. “Bitcoin's crude oil (energy) purchasing power topped in April 2021. Now looks poised for another leg of outperformance (and rise in USD value).”BTC/WTI annotated chart. Source: TechDev/ TwitterAn accompanying chart drew specific parallels to Bitcoin’s performance at the pit of the last bear market in late 2018.As Cointelegraph reported, meanwhile, TechDev is far from the only voice calling for upside to characterize BTC price action going into the new year.The views, thoughts and opinions expressed here are the authors’ alone and do not necessarily reflect or represent the views and opinions of Cointelegraph.

Čítaj viac

Bitcoin 'millionaire' wallets drop 80% in year of BTC price bear market

Bitcoin (BTC) millionaires are becoming an increasingly rare breed as numbers fall 80% in a year.According to the latest data from on-chain analytics firm Glassnode, there are now just 23,000 wallets with a BTC balance worth $1 million or more.1 year, 90,000 fewer million-dollar BTC walletsIn yet another indication of how far the crypto market has fallen since Bitcoin’s last all-time highs, Bitcoin millionaires have been seriously feeling the pinch.Glassnode, which tracks multiple cohorts of BTC wallets, confirms that as of Nov. 25, there were 23,245 with a balance worth over $1 million. Contrast that with the scene from Nov. 8, 2021, when the tally hit its peak as BTC/USD approached its latest $69,000 all-time high — then, there were 112,898 “millionaire” wallets.Bitcoin wallets with a balance of $1 million or more chart. Source: GlassnodeSuch addresses have fallen in line with spot price itself, subject to modest selling by owners at various points of Bitcoin’s year-long bear market.Millionaire wallet numbers are down around 79% in that period, while BTC/USD saw a maximum drawdown of 77% this month, data from Cointelegraph Markets Pro and TradingView shows.BTC/USD 1-week candle chart (Bitstamp). Source: TradingViewBitcoin address numbers in “up only” modeAs Cointelegraph reported, meanwhile, the picture looks somewhat different in BTC terms. Since the FTX implosion, certain classes of wallet have been accumulating.Related: How low can the Bitcoin price go?In addition, as noted by co-founders of trading suite Decentrader this week, exchange users withdrawing funds to private storage and consolidating wallets likely account for the significant increase in wallets with 1 BTC or more.As of Nov. 27, these totaled over 952,000 — a record in Bitcoin’s history.Bitcoin wallets with a balance of 1 BTC or more chart. Source: GlassnodeGlassnode nonetheless shows that even the smallest classes of investor — those with 0.01 BTC or more in their wallets — have also grown in numbers recently.Overall, however, addresses with a non-zero balance have been in decline since Nov. 18, its data shows — a comparatively rare trend break last seen in April 2021.Bitcoin addresses with a non-zero balance chart. Source: GlassnodeThe views, thoughts and opinions expressed here are the authors’ alone and do not necessarily reflect or represent the views and opinions of Cointelegraph.

Čítaj viac

Získaj BONUS 8 € v Bitcoinoch

nakup bitcoin z karty

Registrácia Binance

Burza Binance

Aktuálne kurzy