Autor Cointelegraph By William Suberg

Bitcoin bear market will bottom when two-month RSI metric hits zero, trader predicts

Bitcoin (BTC) should repeat history and put in a bear-market bottom when a classic indicator hits zero, a trader says.Key points:Bitcoin classic two-month stochastic RSI signals are valid this bear market, Max Crypto said.The bear market will be over once the indicator reaches zero again.RSI divergences provided advance notice of the BTC price rebound beyond $64,000 this month.Bitcoin stochastic RSI bottom signal “will happen again”In an X post at the weekend, Max Crypto went on record to forecast the end of the 2026 bear market when the stochastic relative strength index (RSI) hits a new swing low.”Stoch” RSI is a derivative of RSI, a popular leading indicator, with a greater bias on recent price moves.“Every time the 2M Stoch RSI had a bullish cross and dropped to 0, $BTC bottomed,” Max Crypto wrote in accompanying commentary. “This happened in 2014, 2018, and 2022, and it will happen again.”BTC/USD two-month chart with stochastic RSI data. Source: Cointelegraph/TradingViewTwo-month stoch RSI measures 4.81, having dropped into its sub-30 “oversold” zone during March, data from TradingView confirms. Current levels were last observed just over three years ago.Stoch RSI has already formed a focus for market participants this year, with daily moves previously drawing comparisons to the 2022 bear market. In April, crypto trader Quantum Ascend described BTC price history as “playing out nearly perfectly.”Bear-market RSI cues keep comingTurning to traditional RSI data, traders continue to look for bullish cues as BTC/USD treads water above $60,000.Related: BTC price bull market to begin in September? Five things to know in Bitcoin this weekOn Sunday, trader and investor BitcoinHyper eyed a bullish divergence against the S&P 500.At the start of June, daily RSI dropped to just 15, marking one out of just six of what trader Osemka later called “extremely powerful selling events.”“There’s been one case where extreme $BTC RSI (1D at 15) failed to break the lows and only managed to sweep it. That was at the end of accumulation range in 2015,” he continued on Tuesday. “I’m mentioning it now since we have also only swept the low on such powerful move down.”BTC/USD one-day chart with RSI data. Source: Osemka/XOsemka implied that a deeper RSI retracement could still emerge, marking a price reversal in-line with previous bear markets.Bitcoin’s return above $64,000 this month, meanwhile, came after bullish RSI divergences across multiple time frames.

Čítaj viac

Bitcoin threatens $62K in risk-asset rout as Donald Trump says US will 'run' closed Hormuz Strait

Bitcoin (BTC) fell further into Monday’s Wall Street open as markets reacted to the US-Iran escalation.Key points:Bitcoin falls toward $62,000 as losses intensify on nerves over the US-Iran war.Donald Trump says that the US should “run” the Strait of Hormuz as a tug-of-war with Iran continues.BTC price action is described as “very weak”, but a $70,000 rebound prediction remains in place.Oil rises amid “aggressive” BTC shortingData from TradingView showed BTC/USD edging closer to $62,000 amid what a trader described as “massive” short trading.BTC/USD one-hour chart. Source: Cointelegraph/TradingViewUS stocks were broadly in the red at the open, with the Nasdaq Composite Index down 1% at the time of writing.Speaking to Fox on the day, US President Donald Trump said that the US would be taking over the Strait of Hormuz, a key international oil route, which Iran closed at the weekend.“We’re going to keep the strait, and we’ll probably run it. ‌We’ll become the guardian of the strait. Maybe we’ll call it the ‘guardian angel’ of the strait. And we should be reimbursed for that,” he said.Oil prices stayed higher, with WTI crude circling $75 per barrel.CFDs on US WTI crude oil one-hour chart. Source: Cointelegraph/TradingViewBitcoin saw pressure, with sellers firmly in control after an initial drop following the weekly close.“Massive shorting into this pre NY-open drop. Price is now sitting directly at mVWAP, a key level bulls need to defend!” analytics account JDK Analysis wrote in a post on X.The post referred to the volume-weighted average price across exchanges, warning that $60,000 could reappear.“With spot also selling, this still looks very weak. But if New York brings real spot demand and mVWAP holds, a bounce could trap a large number of sellers,” JDK added.BTC/USD chart with order-book data. Source: JDK Analysis/XOthers also noticed the downward trend, with commentator Exitpump earlier reporting a “crazy amount of aggressive shorting” while open interest continued to rise.Bitcoin upside targets still see $70,000 returningThose making the case for a rebound on the day included trader Roman, who retained his new bullish bias.Related: BTC price bull market to begin in September? Five things to know in Bitcoin this weekIn an X post, Roman highlighted several price metrics, including the relative strength index (RSI) and volume, showing downside exhaustion.“I believe a move higher is coming it all just comes down to formation and how we get there,” he wrote. “Lots of HTF & LTF indications for 70-75k area + exchange data is showing that more spot is being bought than sold. It’s a matter of when not if.”BTC/USD one-day chart. Source: Roman/XEarlier, Cointelegraph reported on various expectations of continued BTC price upside this month before bearish continuation, ultimately ending in a Q3 macro bottom.

Čítaj viac

BTC price bull market to begin in September? Five things to know in Bitcoin this week

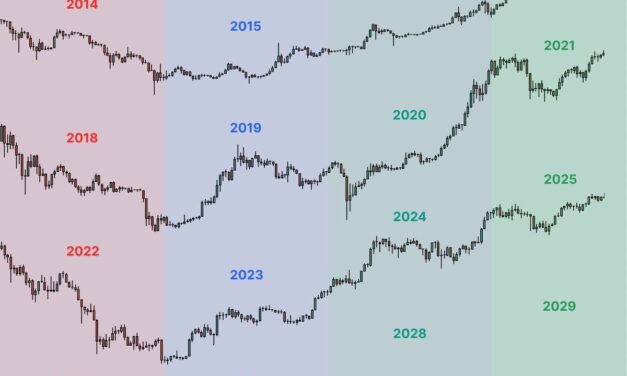
Bitcoin (BTC) starts the new week with a bump as traders brace for more macro volatility.Key points:Bitcoin gets knocked back toward $62,000, but a trader is already eyeing the end of the bear market by September.A new BTC price “death cross” forms the latest signal that the bear market may have just months left to run.The US-Iran war is back as the Strait of Hormuz closes to oil traffic, prompting risk-asset headwinds.US CPI and PPI data is due out, while Fed chair Kevin Warsh will outline future policy to lawmakers.A major distribution event involving midsize Bitcoin hodlers shows fractured sentiment across investor cohorts.Bitcoin bear-market bottom due “around September or October”Bitcoin continues to circle its lowest levels since Q3 2024, but one theory is already calling for the return of the bull market as soon as September.In an X post on Monday, trader Ryker called the entire four-year cycle of bull and bear markets into question.“I disagree with this chart,” they wrote alongside a comparison of previous market phases for BTC/USD stretching back to 2013.Ryker argued that since consensus sees the 2026 bear-market bottom as still to come, market makers will frontrun sentiment and initiate a long-term rebound in advance, leaving as many traders off-side as possible.“Most people believe that the next Bitcoin bull cycle will begin in 2027. However, market makers know exactly what the crowd is thinking,” they continued. “I predict that Bitcoin will start surging around September or October of this year, and the crowd will miss the buy opportunity. You shouldn’t trust this chart.”BTC/USD one-week chart comparison. Source: Ryker/XThe idea comes as multiple BTC price indicators begin to flash reversal signals for the first time since the end of the last bear market in late 2022.As Cointelegraph reported, however, history suggests that the bear market is simply too young to reverse before the end of the year, with current progress at around 70%.Trader confirms classic BTC price bear-market “death cross”Bitcoin saw sell-side pressure immediately after the weekly close, dropping to local lows near $62,500, per data from TradingView.BTC/USD one-hour chart. Source: Cointelegraph/TradingViewThis reinforced the area around $64,000 as short-term resistance, with multiple attempts to break higher all ending in failure last week.“Crypto choppy, so are stocks,” trader Daan Crypto Trades wrote in his latest analysis on X.“Bitcoin remains rangebound between this ~$61K-$65K region and is right in the middle here.”BTC/USD one-hour chart. Source: Daan Crypto Trades/XFellow trader Lennaert Snyder saw little chance of even a rematch with range highs, putting $63,600 as the next entry point for a BTC short position.“Orderflow also confirms spot and perps are selling and funding rates are still quite high, so some downward pressure would be healthy,” he commented on Monday about exchange order-book data.Snyder described BTC/USD dropping to fresh lows under $57,800 as the “most healthy scenario.”BTC/USDT four-hour chart. Source: Lennaert Snyder/XA more optimistic take came from trader Jelle, who maintained hope of a near-term rebound to $70,000.On longer time frames, Jelle noted the recent “death cross” on the weekly chart potentially forming a reliable foundation for sustained upside.This involves the 50-week and 100-week simple moving averages (SMAs), and with the last death cross coming in September 2022, just months before the last bear-market bottom.“In the past, by the time this signal flashed, Bitcoin’s bear market was nearly ending. More and more signs confirming my belief that accumulation season is back,” Jelle told X followers.BTC/USD one-week chart with 50, 100SMA. Source: Cointelegraph/TradingViewHormuz closure rocks oil, stocks in crypto headwindThe US-Iran war is already back as a major macro volatility driver this week.Over the weekend, Iran declared the Strait of Hormuz — a key global oil route — closed until further notice.This followed a series of escalatory events that broke the fragile ceasefire agreement previously in effect, and markets reacted in kind.US WTI crude oil returned to $75 per barrel on Monday, up nearly 12% versus its July lows.CFDs on US WTI crude oil one-hour chart. Source: Cointelegraph/TradingViewReacting, Nic Puckrin, CEO and cofounder of crypto education platform Coin Bureau, flagged other signs of stress as a result of the resurgent conflict.“US 2yr T-bill yields just shot above 2.35% – the highest level in 16 months!” he wrote in a post on X. “The Iran situation is pushing up oil prices & inflation expectations. It’s saying: Interest rates are going to be higher for longer.”US two-year Treasury yield chart. Source: Nic Puckrin/XPuckrin referred to two-year US Treasury note yields and their potential impact on financial policy, with higher interest rates traditionally being a headwind for crypto and risk assets.While US stock futures saw a cautious start to the week, the frequency of negative Iran headlines appeared to show in their comparatively muted reaction to the oil-supply threat. As such, some market participants brushed off the potential for a deeper market retracement based solely on Middle-East cues.“This correction has, in my opinion, little to do with everything in the Middle East,” crypto trader and analyst Michaël van de Poppe argued. Van de Poppe instead put the focus on Japanese bond markets as the yen circled multidecade lows versus the US dollar. “It has a lot more to do with the Japanese Yield jumping again,” he continued. “I expect to see a breakdown in Yield over the next 1-2 weeks, which would automatically lead to a positive breakout in Bitcoin.”BTC/USDT one-day chart. Source: Michaël van de Poppe/XFed’s Warsh to testify with CPI, PPI data dueAgainst the background of Iran instability, US markets will also need to surf key macro data releases in the coming days.Chief among these are the June prints of the Consumer Price Index (CPI) and Producer Price Index (PPI). Both mark the final releases before the Federal Reserve meets to decide on interest-rate changes at the end of the month.As Cointelegraph reported, the Iran knock-on effect has been reflected in US inflation reports for several months, making any surprise readings in CPI or PPI a key potential risk-asset volatility catalyst.US CPI 12-month % change. Source: Bureau of Labor Statistics“We have a highly eventful week ahead of us,” trading resource The Kobeissi Letter summarized to X followers.Almost immediately after CPI on Tuesday, new Fed chair Kevin Warsh will present a semiannual monetary policy report to the House Financial Services Committee.Warsh has walked a tightrope since taking over in May, juggling rising inflation with pressure from US president Donald Trump to cut rates. At his first interest-rate meeting, however, he remained on the hawkish side, avoiding dropping clear hints that policy could be relaxed. According to CME Group’s FedWatch Tool, markets currently see rates staying the same until September, when majority consensus calls for a 0.25% hike.Fed target rate probabilities (screenshot). Source: CME GroupIn analysis published late last week, trading resource Mosaic Asset Company described rates being caught in a “tug-of-war,” while pointing instead to US 30-year Treasury yields as a source of friction going forward.“A breakout in long-term rates may present obstacles for the rally, but the S&P 500 is nearing completion of a short-term bullish chart pattern,” it warned.This week also sees around 10% of S&P 500 companies reporting earnings.S&P 500 chart data. Source: Mosaic Asset CompanyMidsize BTC hodler selling hits multimonth highsNew insights into Bitcoin hodler selling adds to the case for a BTC price rebound in July.Related: Bitcoin whales sent BTC price to $64K as Coinbase Premium broke key level: CryptoQuantPublished by onchain analytics platform CryptoQuant on Monday, data covering addresses holding between 100 and 1,000 BTC shows a major new distribution event.“Bitcoin wallets holding between 100 and 1,000 BTC recorded net distribution of about 67,000 BTC on July 13, the cohort’s strongest selling activity since February 19, when distribution reached roughly 47,000 BTC,” contributor Amr Taha wrote in a blog post.Over the past three months, the cohort’s activity has been in a state of flux, with late April conversely seeing conspicuous accumulation.Taha, however, notes that these 100-1,000 BTC entities tend to reduce exposure before bullish BTC price reversals.“Historically, extreme accumulation by this cohort appeared near local Bitcoin price highs in January and April 2026, while the strong distribution recorded after February 19 was followed by a price rebound,” he continued.“The current signal does not confirm a market bottom, but it places Bitcoin near another historically significant shift in mid-sized investor behavior.”Bitcoin exchange inflow data (screenshot). Source: CryptoQuantCryptoQuant data also shows that inflows to both Binance and Coinbase Prime actually cooled in mid-July.Last week, Cointelegraph reported on profit-taking by short-term holders as BTC/USD rose to $64,000 — something that analysis likewise described as a feature “characteristic of a bull market.” 

Čítaj viac

Bitcoin price gains nearly 10% in July, but traders still see BTC copying 2022 bear market

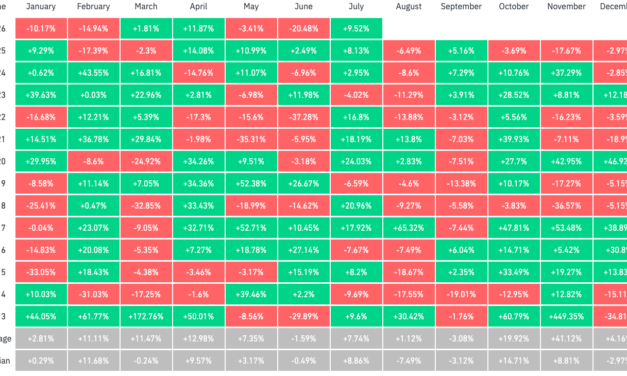
Bitcoin (BTC) is seeing its best month of July since 2022, but analysis warns that the result could be firmly bearish.Key points:Bitcoin is nearing double-digit gains for July, but market reactions draw comparisons to 2022.Bear-market patterns call for downside to resume next month before a Q4 bottom.$70,000 remains a target for the current bounce.Analyst sees BTC price “picking up” for rest of July before reversalData from CoinGlass shows that at 9.5%, BTC/USD is setting a four-year record for July gains.Bitcoin’s last bear-market year, in 2022, saw price end July nearly 17% higher after significant 38% losses the month prior. What happened in August, however, showed that calls for bullish continuation at the time were premature. BTC/USD fell by around 14%, followed by a further 3% drop in September. This time, market participants are thus predictably cautious over short-term price strength.“$BTC Has been pretty much in line with its average July performance so far. But of course it is still early,” trader Daan Crypto Trades commented on the CoinGlass numbers in an X post on Saturday.Daan Crypto Trades noted that even taking bull markets into account, Q3 is Bitcoin’s weakest quarter, with average gains of just 6%.“This has to do a lot with slow markets, low liquidity and volumes during the Summer time,” he added.BTC/USD monthly returns (screenshot). Source: CoinGlassAlso concerned about seasonality is trader and analyst Rekt Capital, who notes that BTC price performance in 2026 is matching its previous bear markets closely.“If history repeats, things are likely going to pick up for Bitcoin and its Summer relief rally in the second half of July,” he told X followers this week.BTC/USD one-month chart. Source: Rekt Capital/XAs Cointelegraph reported, Rekt Capital sees August canceling out this month’s gains in preparation for a classic bear-market bottom later in the year.$70,000 on the radar for July BTC price bounceOther market participants are meanwhile preparing targets for the rest of July, with $70,000 becoming popular.Related: Bitcoin returns to $64.3K with new 3-week BTC price highs imminent“Interesting few days ahead,” Peter Anthony, creator of the House of Crypto YouTube channel, forecast while analyzing the daily chart.Another trader eyed the area between $67,000 and $73,000 for a short entry, also predicting a “bullish July, then Bearish August until Q4.”“Q4 is when the real volatility takes place for BTC (both directions),” Daan Crypto Trades concluded. “Will this year be the same?”Earlier, Cointelegraph flagged multiple onchain indicators now flashing bear-market bottom signals for the first time in four years.Overall demand, meanwhile, has shown only partial signs of recovery.

Čítaj viac

Bitcoin whales sent BTC price to $64K as Coinbase Premium broke key level: CryptoQuant

Bitcoin (BTC) demand shifts are “behind” the price rebound to $64,000, new analysis claims.Key points:New Bitcoin price analysis says that US whales are behind the latest spate of BTC price relief. The Coinbase Premium is above its 14-day moving average, a key sign of strength.Research from Bitcoin Suisse suggests that “something changed” on the market this week. Bitcoin Coinbase Premium still negative despite trend line reclaimIn a blog post on Friday, onchain analytics platform CryptoQuant attributed Bitcoin’s July upside to US-based whales.Specifically, the Coinbase Premium — the difference in price between Coinbase’s and Binance’s BTC/USDT pairs — is showing early signs of buy-side momentum “regaining strength.”“The Coinbase Premium Index for both BTC and ETH remains in negative territory, but both have bounced off their local lows,” contributor Burak Kesmeci wrote. “On top of that, both metrics managed to reclaim their SMA14. This is what’s behind Bitcoin’s move from 58K to 64K, and Ethereum’s rally from $1,500 to $1,750.”Bitcoin Coinbase Premium Index with 14-day SMA. Source: CryptoQuantKesmeci referred to the Coinbase Premium Index’s 14-day simple moving average. As Cointelegraph reported, the Index has spent much of 2026 in negative territory, implying weak demand from both large and small investors on the largest US crypto exchange.“Once again, U.S. whale activity is proving to be the leading data point for trend direction. Short-, medium-, and long-term regime shifts can all be read through this metric,” Kesmeci continued.The Index currently sits at -0.08, per CryptoQuant data, having last flipped positive on daily time frames more than two months ago.“The current picture is a catalyst for a short-term bounce — but for a real long-term regime change, this metric needs to break above zero,” Kesmeci concluded.Bitcoin Suisse: “Bottom signal framework flashing” As Cointelegraph reported, institutional demand is also on the radar for market participants.Related: BTC speculators in focus as analysis says ‘textbook Bitcoin bottom’ is underwayThe US spot Bitcoin exchange-traded funds (ETFs) saw their first net inflows after a record-breaking $2.7 billion losing streak.Data from UK-based investment company Farside Investors nonetheless shows investor sentiment remains sensitive to even small BTC price moves.On Thursday, a third straight day of net outflows totaled $95.3 million.US spot Bitcoin ETF netflows (screenshot). Source: Farside InvestorsAnalyzing a basket of metrics, crypto finance provider Bitcoin Suisse included ETF flow data as one signal that the status quo on the market has changed.“Eight weeks of ETF outflows. Bitcoin at a 21-month low. This week, something shifted,” it told X followers in a thread on Friday.Bitcoin Suisse described a “bottom signal framework flashing” while the Crypto Fear & Greed Index remained in its lowest “extreme greed” zone.

Čítaj viac

Získaj BONUS 8 € v Bitcoinoch

nakup bitcoin z karty

Registrácia Binance

Burza Binance

Aktuálne kurzy