
Autor Cointelegraph By William Suberg

Bitcoin hits $65.5K as more surprise US inflation data sparks three-week BTC price high

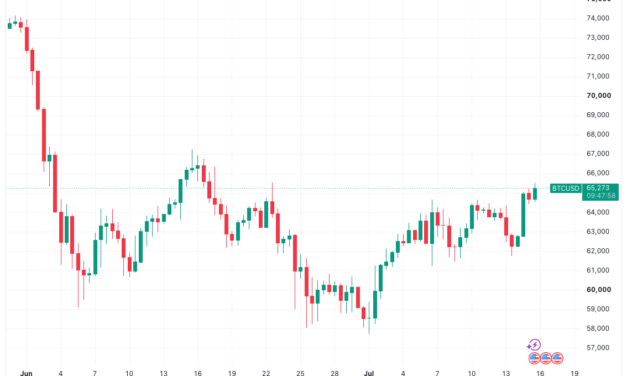
Bitcoin (BTC) saw three-week highs on Wednesday as US inflation data beat expectations for a second day.Key points:Bitcoin sees copycat bullish price action as US inflation data cools for a second day running.Risk assets get a more positive outlook as Fed rate-cut odds drop.Traders stay conservative over Bitcoin’s ability to continue higher.Bitcoin gains after “much better-than-expected” US PPIData from TradingView showed BTC/USD reaching $65,500 for the first time since June 22.BTC/USD 12-hour chart. Source: Cointelegraph/TradingViewThe June print of the Producer Price Index (PPI) came in cool at 5.5% year-on-year after a 0.3% monthly decrease, per data from the Bureau of Labor Statistics (BLS).“The June decline in the index for final demand can be attributed to prices for final demand goods, which fell 1.4 percent. In contrast, the index for final demand services moved up 0.2 percent,” an official news release stated.PPI one-month % change. Source: BLSReacting, economist Mohamed El-Erian was upbeat on the outlook for risk assets and Federal Reserve policy.“These much better-than-expected figures are set to boost equities and further temper market expectations for upcoming interest rate hikes,” he wrote in a post on X.PPI joined Tuesday’s Consumer Price Index (CPI) release, which surprised to the downside despite macro pressure from the US-Iran war and its impact on oil prices.“Inflation expectations continue to decline,” trading resource The Kobeissi Letter added, referencing bets on a Fed interest-rate hike from users of prediction service Polymarket.The latest data from CME Group’s FedWatch Tool also showed change afoot in expectations for the Fed’s September decision, with a 0.25% hike no longer the most likely option.Fed target rate probability comparison for September FOMC meeting (screenshot). Source: CME GroupBTC price momentum battles bear-market historyAssessing current BTC price action, market participants avoided overly bullish takes.Related: Bitcoin gets new $80K August target: Watch these BTC price levels next“Liquidity sitting above at the $65.6K mark and most importantly, the $67.2K mark,” trader Daan Crypto Trades wrote on X, referring to exchange order-book liquidity.“Breaking above the latter would turn this into a bigger move and we can start targeting the $70K+ region again and truly position Bitcoin in the middle of its $60K-$80K range.”BTC/USDT perpetual contract four-hour chart. Source: Daan Crypto Trades/XTrader and analyst Rekt Capital noted that BTC was approaching its 50-month exponential moving average (EMA) — a level from which the price should be rejected if bear-market history were to repeat.“If we follow the same statistical pattern seen over the past 12 months, BTC would likely derisk for the remainder of the month and push back down,” trader Killa added on the topic.BTC chart. Source: Killa/X

Čítaj viac
Bitcoin gets new $80K August target: Watch these BTC price levels next

Bitcoin (BTC) can hit up to $80,000 by August, a new prediction says as data lays out key nearby BTC price levels.Key points: Bitcoin can continue to $70,000 and higher next month if it clears nearby resistance, says new analysis.Market participants identify the most significant support and resistance levels now circling spot price.A macro tide could be the spark to ignite the next move higher this week.BTC price roadmap sees $68,000 within two weeksIn an X update on Wednesday, crypto trader and analyst Michaël van de Poppe said that BTC/USD was successfully defending “crucial” support.“It’s holding the crucial level at $61,000 and flipping important MAs for support, indicating that there’s more momentum on the horizon,” he wrote, referring to moving average trend lines. “I’m expecting to see a rally to $68,000 in the next 1-2 weeks, followed by a continuation towards $75,000-80,000 in August.”BTC/USDT one-day chart. Source: Michaël van de Poppe/XVan de Poppe’s first target coincides with exchange order-book liquidity hurdles that price would encounter if it were to break out of its local range.Updating X followers on whale orders, monitoring resource CoinGlass showed the area at $67,000 and above as key for the cohort. Support, meanwhile, sat principally between $63,500 and $63,800.BTC/USDT 15-minute chart with whale orders. Source: CoinGlassOthers remained cautious, with declining spot-market volume causing suspicion about the strength of the latest gains.“Wouldn’t get excited about this pump, this can easily end up being a failed auction above value area,” commentator Exitpump warned on Tuesday.BTC/USDT perpetual contract one-hour chart. Source: Exitpump/XPreviously, trader and analyst Rekt Capital warned that July strength should reverse by August as Bitcoin repeats standard bear-market behavior.QCP Capital: Crypto market still needs “conviction”In market research issued on Monday, trading company QCP Capital suggested that a macro “catalyst” could be all that was needed to propel crypto higher.Related: Bitcoin bear market will bottom when two-month RSI metric hits zero, trader predictsAs Cointelegraph reported, the coming days will see the release of key US inflation data prior to the Federal Reserve’s decision on interest-rate changes at the end of the month. Tuesday’s data came in below expectations, helping to send Bitcoin back toward $65,000.“Should this week’s macro data and earnings continue to validate the bullish narrative, improving risk sentiment could spill over into digital assets as investors rotate into markets that have lagged the broader equity rally,” QCP wrote. “Until then, crypto appears caught between supportive long-term fundamentals and a market still waiting for conviction.”

Čítaj viac

Bitcoin jumps on lowest US CPI since 2020 as traders stay wary of $64K failure

Bitcoin (BTC) spiked past $64,000 into Tuesday’s Wall Street open as US inflation saw a surprise sudden downturn.Key points:Bitcoin returns to near the top of its local trading range on US inflation data.The biggest drop in CPI since April 2020 boosts crypto and risk assets.Traders remain in wait-and-see mode over whether local resistance will break.US CPI ignores Iran pressure with snap dropData from TradingView showed BTC/USD gaining more than 2% on the day as the June print of the Consumer Price Index (CPI) came in below expectations.BTC/USD one-hour chart. Source: Cointelegraph/TradingViewAt 3.5% versus the anticipated 3.8%, CPI posted its largest monthly decline since April 2020, per data from US Bureau of Labor Statistics (BLS). Energy led the drop despite headwinds from the US-Iran war and the closure of the Strait of Hormuz oil route.“The index for energy fell 5.7 percent in June after rising 3.9 percent in May, 3.8 percent in April, and 10.9 percent in March,” an official news release stated. “The energy index was the largest contributor to the monthly all items decrease, more than offsetting increases in other indexes including those for shelter and food.”US CPI 12-month % change. Source: BLSRisk assets reacted positively, with US stocks in the green and crypto showing particular relief.Market expectations of future Federal Reserve financial policy changes also turned dovish, with the odds of interest-rate hikes dropping sharply. The latest data from CME Group’s FedWatch Tool nonetheless maintained consensus for a 0.25% hike at the Fed’s September meeting.Fed target rate probabilities (screenshot). Source: CME Group“This print should help temper what had become an excessively hawkish market tilt to the monetary policy outlook,” economist Mohamed El-Erian wrote in a response on X.Trader warns of BTC price rejectionBitcoin traders remained cautious with local resistance above $64,000 still in place.Related: Bitcoin bear market will bottom when two-month RSI metric hits zero, trader predicts In ongoing market analysis, X commentator Exitpump noted short positions getting “squeezed” as a result of the CPI print.“Sellers haven’t been able to push price lower because of strong passive demand and now seeing shorts closing out slowly forcing price to grind up,” it summarized. “Still a range trading environment.”BTC/USD one-day chart. Source: Exitpump/XThe latest data from CoinGlass put 24-hour crypto short liquidations at just over $220 million.BTC/USD vs. crypto liquidations (screenshot). Source: CoinGlassContinuing, trader Killa said that they would eye “signs of exhaustion” should the BTC price take out the local highs.“There’s still a liquidity pool sitting above 64.8K, but right now we’re testing the weekly open. If we can’t reclaim and hold the weekly open, this is likely just a lower high before we move down to test the $60K region,” an X post read.

Čítaj viac

Bitcoin bear market will bottom when two-month RSI metric hits zero, trader predicts

Bitcoin (BTC) should repeat history and put in a bear-market bottom when a classic indicator hits zero, a trader says.Key points:Bitcoin classic two-month stochastic RSI signals are valid this bear market, Max Crypto said.The bear market will be over once the indicator reaches zero again.RSI divergences provided advance notice of the BTC price rebound beyond $64,000 this month.Bitcoin stochastic RSI bottom signal “will happen again”In an X post at the weekend, Max Crypto went on record to forecast the end of the 2026 bear market when the stochastic relative strength index (RSI) hits a new swing low.”Stoch” RSI is a derivative of RSI, a popular leading indicator, with a greater bias on recent price moves.“Every time the 2M Stoch RSI had a bullish cross and dropped to 0, $BTC bottomed,” Max Crypto wrote in accompanying commentary. “This happened in 2014, 2018, and 2022, and it will happen again.”BTC/USD two-month chart with stochastic RSI data. Source: Cointelegraph/TradingViewTwo-month stoch RSI measures 4.81, having dropped into its sub-30 “oversold” zone during March, data from TradingView confirms. Current levels were last observed just over three years ago.Stoch RSI has already formed a focus for market participants this year, with daily moves previously drawing comparisons to the 2022 bear market. In April, crypto trader Quantum Ascend described BTC price history as “playing out nearly perfectly.”Bear-market RSI cues keep comingTurning to traditional RSI data, traders continue to look for bullish cues as BTC/USD treads water above $60,000.Related: BTC price bull market to begin in September? Five things to know in Bitcoin this weekOn Sunday, trader and investor BitcoinHyper eyed a bullish divergence against the S&P 500.At the start of June, daily RSI dropped to just 15, marking one out of just six of what trader Osemka later called “extremely powerful selling events.”“There’s been one case where extreme $BTC RSI (1D at 15) failed to break the lows and only managed to sweep it. That was at the end of accumulation range in 2015,” he continued on Tuesday. “I’m mentioning it now since we have also only swept the low on such powerful move down.”BTC/USD one-day chart with RSI data. Source: Osemka/XOsemka implied that a deeper RSI retracement could still emerge, marking a price reversal in-line with previous bear markets.Bitcoin’s return above $64,000 this month, meanwhile, came after bullish RSI divergences across multiple time frames.

Čítaj viac

Bitcoin threatens $62K in risk-asset rout as Donald Trump says US will 'run' closed Hormuz Strait

Bitcoin (BTC) fell further into Monday’s Wall Street open as markets reacted to the US-Iran escalation.Key points:Bitcoin falls toward $62,000 as losses intensify on nerves over the US-Iran war.Donald Trump says that the US should “run” the Strait of Hormuz as a tug-of-war with Iran continues.BTC price action is described as “very weak”, but a $70,000 rebound prediction remains in place.Oil rises amid “aggressive” BTC shortingData from TradingView showed BTC/USD edging closer to $62,000 amid what a trader described as “massive” short trading.BTC/USD one-hour chart. Source: Cointelegraph/TradingViewUS stocks were broadly in the red at the open, with the Nasdaq Composite Index down 1% at the time of writing.Speaking to Fox on the day, US President Donald Trump said that the US would be taking over the Strait of Hormuz, a key international oil route, which Iran closed at the weekend.“We’re going to keep the strait, and we’ll probably run it. ‌We’ll become the guardian of the strait. Maybe we’ll call it the ‘guardian angel’ of the strait. And we should be reimbursed for that,” he said.Oil prices stayed higher, with WTI crude circling $75 per barrel.CFDs on US WTI crude oil one-hour chart. Source: Cointelegraph/TradingViewBitcoin saw pressure, with sellers firmly in control after an initial drop following the weekly close.“Massive shorting into this pre NY-open drop. Price is now sitting directly at mVWAP, a key level bulls need to defend!” analytics account JDK Analysis wrote in a post on X.The post referred to the volume-weighted average price across exchanges, warning that $60,000 could reappear.“With spot also selling, this still looks very weak. But if New York brings real spot demand and mVWAP holds, a bounce could trap a large number of sellers,” JDK added.BTC/USD chart with order-book data. Source: JDK Analysis/XOthers also noticed the downward trend, with commentator Exitpump earlier reporting a “crazy amount of aggressive shorting” while open interest continued to rise.Bitcoin upside targets still see $70,000 returningThose making the case for a rebound on the day included trader Roman, who retained his new bullish bias.Related: BTC price bull market to begin in September? Five things to know in Bitcoin this weekIn an X post, Roman highlighted several price metrics, including the relative strength index (RSI) and volume, showing downside exhaustion.“I believe a move higher is coming it all just comes down to formation and how we get there,” he wrote. “Lots of HTF & LTF indications for 70-75k area + exchange data is showing that more spot is being bought than sold. It’s a matter of when not if.”BTC/USD one-day chart. Source: Roman/XEarlier, Cointelegraph reported on various expectations of continued BTC price upside this month before bearish continuation, ultimately ending in a Q3 macro bottom.

Čítaj viac

Získaj BONUS 8 € v Bitcoinoch

nakup bitcoin z karty

Registrácia Binance

Burza Binance

Aktuálne kurzy

