Autor Cointelegraph By William Suberg

Bitcoin bottom countdown nears 50 days after BTC supply in loss passed 50%

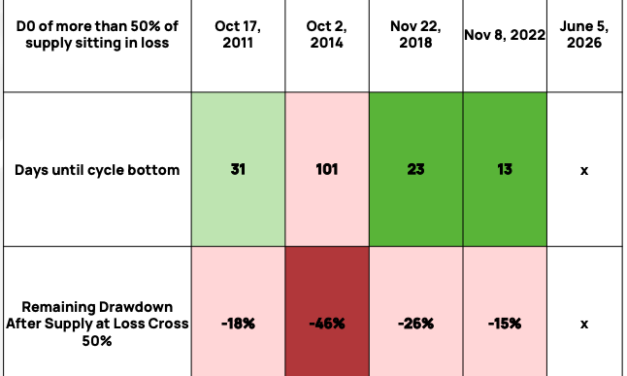
Bitcoin (BTC) has been counting down to its next bottom for nearly two months, a classic onchain metric suggests.Key points:BTC supply in loss passed 50% for the first time this bear market in early June.In previous bear markets, that event sparked a countdown to a new BTC price macro bottom.Separate data hints that the bull market’s “emotional premium” has now gone.Supply in loss countdown already Bitcoin’s second-longestIn its H1 2026 Round-Up report, crypto research company K33 Research flagged more than 50% of the BTC supply now being held at a loss.A typical bear-market feature, supply in loss has become a yardstick for progress toward macro bottoms for BTC/USD.K33 data shows that once supply in loss passes the 50% mark, the bottom has come no more than 101 days later. Bear markets have provided various time frames, with the shortest bottom “window” lasting just 13 days in 2022.The 2018 bear market required 23 days to reach its floor, while in 2014, Bitcoin continued to decline for 101 days after the 50% supply-in-loss mark was hit. In 2026, supply in loss repeated standard bear-market behavior, crossing 50% on June 5. Since then, 42 days have elapsed, making this year’s bottom window Bitcoin’s second-longest ever.BTC supply in loss and days until bear-market bottom (screenshot). Source: K33 ResearchIn accompanying commentary, K33 observed that returns over the year following the phenomenon “tend to be very solid.”Earlier this month, Axel Adler Jr., a contributor to onchain analytics platform CryptoQuant, estimated that supply in loss was around two months away from levels that correspond to bear-market bottoms.CryptoQuant data puts supply in loss at 46% as of July 17.“Distribution of capital” teases silver liningContinuing, CryptoQuant eyed what it described as “rare” readings from Bitcoin investor cost-basis models.Related: Bitcoin $107K buyers providing ‘early signals’ of 2026 bear-market bottom: GlassnodeThe realized cap variance (RCV) model, which measures the difference between realized cap and market cap, currently sits in the bottom six percent of its historical range.“Instead of tracking price alone, it isolates the variance between realized cap and market cap relative to its own rolling history, capturing how stretched or compressed investor cost basis has become versus current valuation,” contributor Crazzyblockk explained in a QuickTake blog post on Thursday. “When that variance compresses into deeply negative z-score territory, the emotional premium built during rallies has largely been priced out. The metric doesn’t read narrative, it reads the distribution of capital.”Bitcoin RCV data (screenshot). Source: CryptoQuantAt -2.35, standardized RCV’s Z-score is once again pointing to the final stages of the Bitcoin bear market.“Every prior stretch where the model spent extended time below a -2.0 z-score, late 2018, mid-2022, early 2015, preceded forward twelve-month returns north of 75%,” the post noted. “The most extreme reading in this dataset, -4.68 in November 2018, landed almost exactly on Bitcoin’s cycle bottom near $3,792.”

Čítaj viac
Bitcoin price dips on US stocks sell-off as Micron losses pass 30%

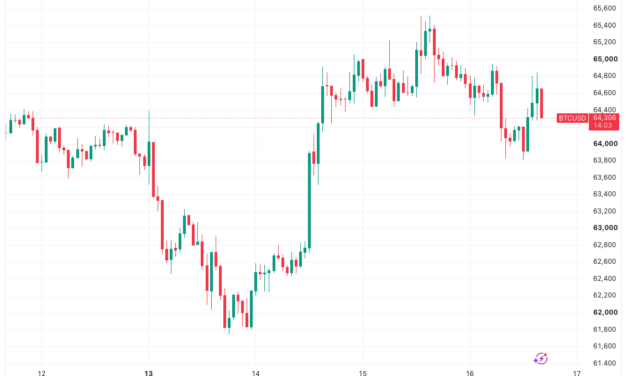
Bitcoin (BTC) cooled off with US stocks on Thursday as tech selling tempered gains from low inflation.Key points:Bitcoin follows US stocks as they come off local highs sparked by bullish US inflation data.Tech sell pressure contributes to slowing momentum as retail investors take profits.The BTC price rebound is seen rejecting at overhead resistance.Tech selling puts the brakes on crypto, risk-asset upsideData from TradingView showed BTC/USD circling $64,500, down 1.5% from its three-week highs seen the day prior.BTC/USD one-hour chart. Source: Cointelegraph/TradingViewThese had accompanied two straight days of lower-than-expected US inflation data, with both the Consumer Price Index (CPI) and Producer Price Index (PPI) dropping in June.While crypto and equities initially gained, tech stocks came under pressure on Thursday, with the closely-watched Micron Technologies down 15%.“Micron is now down over -30% since its June 22nd record high,” trading resource The Kobeissi Letter commented in a response on X.Micron Technologies one-day chart. Source: Cointelegraph/TradingViewKobeissi additionally noted profit-taking in action by retail tech-stock investors, with sales of Tesla and Apple hitting $200 million over the past two weeks.“Meanwhile, the total retail turnover in single stocks rose to a record $370 billion, up from $220 billion at the start of 2026,” it continued. “Retail investors are locking in gains following a historic tech rally.”Retail investor equity sales data. Source: The Kobeissi Letter/XEarlier, Cointelegraph reported on Bitcoin speculators cashing in on the recent local highs.“Rejection” becomes new BTC price keywordTurning to BTC price action itself, the mood among market participants remained conservative on the day.Related: Bitcoin $107K buyers providing ‘early signals’ of 2026 bear-market bottom: GlassnodeCommentator Exitpump flagged anchored volume-weighted average price (AVWAP) as measured from Bitcoin’s run to $82,000 in early May, as the level to end the current rebound.“Price is finally going to retest the AVWAP from 82K top that lead to strong local downtrend. To me such retest should cap the upside and give stronger rejection,” they told X followers.BTC/USD four-hour chart. Source: Exitpump/XTrader and analyst Rekt Capital argued that BTC/USD was “showing initial signs of rejection” from its 50-month exponential moving average (EMA) at $65,900.Rekt Capital reiterated the concept of current price behavior copying the 2022 bear market, having already warned that the next macro bottom would not come until later in the year.

Čítaj viac

Bitcoin $107K buyers providing ‘early signals’ of 2026 bear-market bottom: Glassnode

Bitcoin (BTC) “cycle peak buyers” could already be pointing the way to the next bear-market bottom.Key points:Bitcoin hodlers who bought BTC one to two years ago are cooling selling pressure.The cohort’s realized losses have led to market bottoms once their uptrend reverses, Glassnode data shows.Speculators’ cost basis reinforces the next BTC price battleground at $69,000.Glassnode: Bitcoin realized loss reversal “worth watching closely”In an X post on Friday, Cryptovizart, the pseudonymous lead research analyst at onchain analytics platform Glassnode, showed a classic bottom signal potentially repeating.The latest in a series of such signals, the latest puts buyers who bought BTC in the latter part of the bull market in focus.“One of the metrics I watch most closely when trying to gauge a bear market’s end is, Realized Loss volume (in USD) by the 1-2 year holders,” Cryptovizart wrote.Here, coins moving onchain at a loss last did so between July 2024 and July 2025. During that time, BTC/USD increased from around $62,800 to $107,000, placing the majority of investors underwater on their allocation.“As frustration builds with sustained price underperformance, this cohort tends to progressively increase loss realization,” the post continues.“Historically, bear markets have not found durable footing until this specific group exhausts its sell pressure.”Bitcoin realized losses for 1-2 year hodlers (30-day moving average). Source: Cryptovizart/XAn accompanying chart shows a spike in realized losses on a 30-day rolling basis, with the tally recently passing $75 million before beginning a reversal. For Cryptovizart, that feature is key.“When the 30D-SMA of their realized loss cools and rolls over, it has often been among the clearest early signals that the heaviest distribution phase is behind the market,” they added.“Worth watching closely.”Focus shifts to $69,000 BTC price showdownHodler realized losses are not the only onchain metric on the radar when it comes to timing the next macro BTC price floor. Related: Bitcoin gets new $80K August target: Watch these BTC price levels nextAs Cointelegraph reported, stochastic relative strength index (RSI) values on two-month time frames are creating classic market reversal conditions.In the latest edition of its regular newsletter, The Week Onchain, Glassnode flagged Bitcoin speculators’ aggregate cost basis as bulls’ next resistance hurdle.At around $69,000, the cost basis for short-term holders (STHs) also coincides with old all-time highs from the 2021 bull market.“The first meeting with that level will likely draw a strong reaction, because the people most inclined to sell are the ones about to be made whole,” it read.“A convincing reclaim would give the recovery room to run; a rejection keeps the range intact.”BTC/USD chart with cost-basis levels (screenshot). Source: Glassnode

Čítaj viac

Bitcoin hits $65.5K as more surprise US inflation data sparks three-week BTC price high

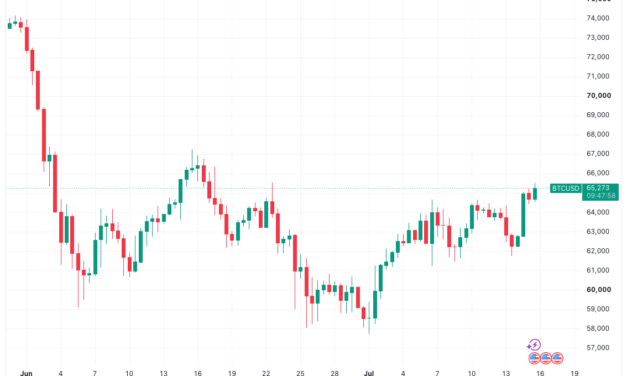
Bitcoin (BTC) saw three-week highs on Wednesday as US inflation data beat expectations for a second day.Key points:Bitcoin sees copycat bullish price action as US inflation data cools for a second day running.Risk assets get a more positive outlook as Fed rate-cut odds drop.Traders stay conservative over Bitcoin’s ability to continue higher.Bitcoin gains after “much better-than-expected” US PPIData from TradingView showed BTC/USD reaching $65,500 for the first time since June 22.BTC/USD 12-hour chart. Source: Cointelegraph/TradingViewThe June print of the Producer Price Index (PPI) came in cool at 5.5% year-on-year after a 0.3% monthly decrease, per data from the Bureau of Labor Statistics (BLS).“The June decline in the index for final demand can be attributed to prices for final demand goods, which fell 1.4 percent. In contrast, the index for final demand services moved up 0.2 percent,” an official news release stated.PPI one-month % change. Source: BLSReacting, economist Mohamed El-Erian was upbeat on the outlook for risk assets and Federal Reserve policy.“These much better-than-expected figures are set to boost equities and further temper market expectations for upcoming interest rate hikes,” he wrote in a post on X.PPI joined Tuesday’s Consumer Price Index (CPI) release, which surprised to the downside despite macro pressure from the US-Iran war and its impact on oil prices.“Inflation expectations continue to decline,” trading resource The Kobeissi Letter added, referencing bets on a Fed interest-rate hike from users of prediction service Polymarket.The latest data from CME Group’s FedWatch Tool also showed change afoot in expectations for the Fed’s September decision, with a 0.25% hike no longer the most likely option.Fed target rate probability comparison for September FOMC meeting (screenshot). Source: CME GroupBTC price momentum battles bear-market historyAssessing current BTC price action, market participants avoided overly bullish takes.Related: Bitcoin gets new $80K August target: Watch these BTC price levels next“Liquidity sitting above at the $65.6K mark and most importantly, the $67.2K mark,” trader Daan Crypto Trades wrote on X, referring to exchange order-book liquidity.“Breaking above the latter would turn this into a bigger move and we can start targeting the $70K+ region again and truly position Bitcoin in the middle of its $60K-$80K range.”BTC/USDT perpetual contract four-hour chart. Source: Daan Crypto Trades/XTrader and analyst Rekt Capital noted that BTC was approaching its 50-month exponential moving average (EMA) — a level from which the price should be rejected if bear-market history were to repeat.“If we follow the same statistical pattern seen over the past 12 months, BTC would likely derisk for the remainder of the month and push back down,” trader Killa added on the topic.BTC chart. Source: Killa/X

Čítaj viac

Bitcoin gets new $80K August target: Watch these BTC price levels next

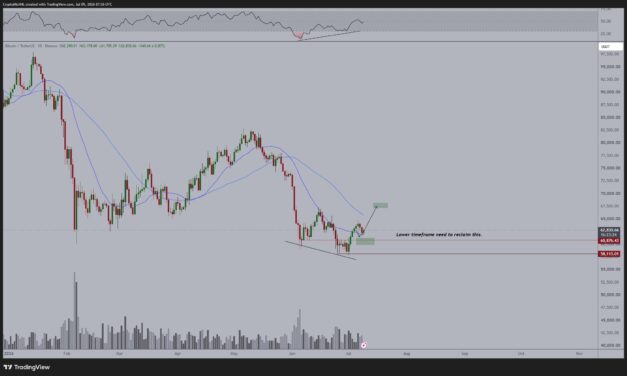
Bitcoin (BTC) can hit up to $80,000 by August, a new prediction says as data lays out key nearby BTC price levels.Key points: Bitcoin can continue to $70,000 and higher next month if it clears nearby resistance, says new analysis.Market participants identify the most significant support and resistance levels now circling spot price.A macro tide could be the spark to ignite the next move higher this week.BTC price roadmap sees $68,000 within two weeksIn an X update on Wednesday, crypto trader and analyst Michaël van de Poppe said that BTC/USD was successfully defending “crucial” support.“It’s holding the crucial level at $61,000 and flipping important MAs for support, indicating that there’s more momentum on the horizon,” he wrote, referring to moving average trend lines. “I’m expecting to see a rally to $68,000 in the next 1-2 weeks, followed by a continuation towards $75,000-80,000 in August.”BTC/USDT one-day chart. Source: Michaël van de Poppe/XVan de Poppe’s first target coincides with exchange order-book liquidity hurdles that price would encounter if it were to break out of its local range.Updating X followers on whale orders, monitoring resource CoinGlass showed the area at $67,000 and above as key for the cohort. Support, meanwhile, sat principally between $63,500 and $63,800.BTC/USDT 15-minute chart with whale orders. Source: CoinGlassOthers remained cautious, with declining spot-market volume causing suspicion about the strength of the latest gains.“Wouldn’t get excited about this pump, this can easily end up being a failed auction above value area,” commentator Exitpump warned on Tuesday.BTC/USDT perpetual contract one-hour chart. Source: Exitpump/XPreviously, trader and analyst Rekt Capital warned that July strength should reverse by August as Bitcoin repeats standard bear-market behavior.QCP Capital: Crypto market still needs “conviction”In market research issued on Monday, trading company QCP Capital suggested that a macro “catalyst” could be all that was needed to propel crypto higher.Related: Bitcoin bear market will bottom when two-month RSI metric hits zero, trader predictsAs Cointelegraph reported, the coming days will see the release of key US inflation data prior to the Federal Reserve’s decision on interest-rate changes at the end of the month. Tuesday’s data came in below expectations, helping to send Bitcoin back toward $65,000.“Should this week’s macro data and earnings continue to validate the bullish narrative, improving risk sentiment could spill over into digital assets as investors rotate into markets that have lagged the broader equity rally,” QCP wrote. “Until then, crypto appears caught between supportive long-term fundamentals and a market still waiting for conviction.”

Čítaj viac

Získaj BONUS 8 € v Bitcoinoch

nakup bitcoin z karty

Registrácia Binance

Burza Binance

Aktuálne kurzy