Autor Cointelegraph By William Suberg

Bitcoin price hits $65K wall as stocks battle ‘record’ institutional tech sell-off

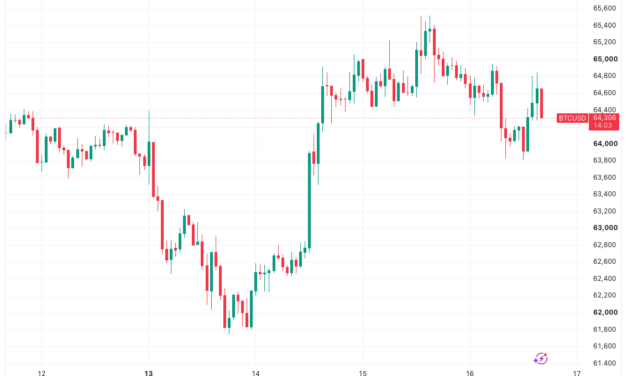
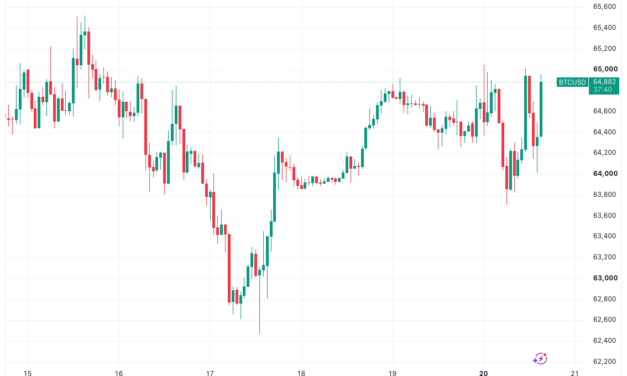
Traders balked on Bitcoin (BTC) at $65,000 on Monday as crypto and risk-assets remained under pressure.Key points:Bitcoin staged several unsuccessful attempts to break and hold $65,000.US stocks face pressure from both the Iran war and an ongoing institutional tech sell-off.Bitcoin traders stay positive on the odds of BTC/USD heading closer to $70,000 next.Crypto stocks face “record pace” of US tech-stock sellingData from TradingView showed BTC price volatility returning around Monday’s Wall Street open.BTC/USD one-hour chart. Source: Cointelegraph/TradingViewUS equities faced multiple headwinds to start the week, with the US-Iran war quashing risk appetite and a tech-stock sell-off gaining strength.Trading resource The Kobeissi Letter reported that hedge funds were selling tech stocks “at a record pace.”“Hedge funds have sold information technology stocks in 6 of the last 8 weeks. This brings total 8-week sales to the largest in at least 10 years,” it said in a post on X, citing Goldman Sachs data.US tech stock investment trend data. Source: The Kobeissi Letter/XTo be sure, the S&P 500 Index and Nasdaq Composite Index were both modestly higher at the time of writing, while the Dow Jones was down 0.3% on the day.Oil prices remained above $80 per barrel as the Strait of Hormuz looked set to stay closed amid intensifying rhetoric from both the US and Iran.CFDs on US WTI crude oil one-day chart. Source: Cointelegraph/TradingViewIn a post on Truth Social at the weekend, US president Donald Trump called for Iran to be included in a sanctions package initially focused on Russia.Source: Truth SocialBitcoin price upside hits $65,000 roadblockBTC price action found little room for upside as the $65,000 mark became a point of repeated momentum failure.Related: Trader maintains $67K BTC price target: Five things to know in Bitcoin this week“The $65K level has capped price for the entirety of July so far,” trader Daan Crypto Trades wrote in an X post.“But I do think the longer price spends here, the more likely the $65K level is to break. Especially with the higher lows being made over the past 3 weeks.”BTC/USD four-hour chart. Source: Daan Crypto Trades/XDaan Crypto Trades joined those who saw the next likely upside target at just above $67,000. He said this was where BTC/USD would “break into a bullish market structure.”Others referenced seasonality directing current price behavior, with summer traditionally devoid of major moves up or down.“The markets are in a summer break, it feels like,” crypto trader and analyst Michael van de Poppe told his roughly 819,000 X followers while discussing largest altcoin Ether (ETH).In a separate post, Van de Poppe gave a BTC price target of between $67,500 and $69,000 for the “coming weeks.” Earlier, he saw August offering even higher levels of up to $80,000, a level last seen in mid-May.BTC/USDT one-day chart. Source: Michaël van de Poppe/X

Čítaj viac

Trader maintains $67K BTC price target: Five things to know in Bitcoin this week

Bitcoin (BTC) starts the last full week of July holding key support while macro clouds continue to gather.Key points:Bitcoin preserves its 200-week trend line at the weekly close, leading to short-term BTC price targets of up to $67,000.US-Iran war rhetoric ramps up, with oil prices hitting five-week highs ahead of a week of corporate earnings reports.Bitcoin spot demand retreats from its early-July uptick despite ETF inflows.Bitcoin’s Puell Multiple heads higher, but analysts are wary of calling a “generational low.”Crypto market sentiment hits highest levels since the start of June.Trader sees “further relief” for Bitcoin bullsIn a familiar move, Bitcoin saw sell-side pressure soon after the weekly close going into Monday morning, with local lows reaching $63,700, data from TradingView confirms.BTC/USD one-hour chart. Source: Cointelegraph/TradingViewDespite this, traders are becoming increasingly optimistic on shorter time frames as range lows continue to hold.“Wouldn’t surprise me if we see some further relief this week – towards 65-67k,” trader Jelle predicted in his latest analysis posted Monday morning on X.BTC/USD one-day chart. Source: Jelle/XTrader Daan Crypto Trades noted that BTC/USD had sealed its third consecutive weekly close above the 200-week simple moving average (SMA), currently at $63,322.“To really get this interesting you want to see a strong push higher now to retrace that last leg down and get back above the Weekly 200EMA,” he told X followers, referring to the 200-week exponential moving average (EMA) at $68,521.“Until then, we’re just caught in this $60K choppy price range.”BTC/USD one-week chart. Source: Daan Crypto Trades/XOthers doubled down on bullish conviction, with trader Roman again flagging multiple bullish divergences across BTC price metrics, including the relative strength index (RSI), a classic leading indicator.Contrasting the optimism was seasonality, with BTC price cycle history demanding another year of bear-market moves.“Bitcoin is more than halfway through its second year in the current BTC Four Year Cycle. 2025 proved to be the year of the $BTC Bull Market peak. And 2026 has proven itself to be the year of the Bitcoin Bear Market,” trader and analyst Rekt Capital summarized. “2027 will be the Bottoming Out year to precede an entirely brand new future Bitcoin Bull Market.”BTC/USD 12-month chart. Source: Rekt Capital/XAs Cointelegraph reported, Rekt Capital now calculates the current bear market to be just over 70% complete.Iran worries send oil prices higherGeopolitical risk is top of the agenda for risk-asset traders this week as the US-Iran war escalates once again.Iran’s foreign minister warned of potentially “unresolvable” nuclear disputes while US President Donald Trump called on lawmakers to add Iran to a sanctions bill that was initially directed at Russia. Source: Truth SocialOil futures surged at the weekly open, with WTI crude at five-week highs above $80 per barrel and Brent crude topping $90.CFDs on US WTI crude oil one-day chart. Source: Cointelegraph/TradingViewAs Cointelegraph reported, the return of the conflict saw the swift closure of the Strait of Hormuz, a key global oil route, that was briefly cleared for traffic as part of the now-failed US-Iran peace deal.The latest Iran events provide volatile backdrop to the week’s macro outlook, which focuses on major corporate earnings as tech stocks face new headwinds.In the coming days, Tesla, Alphabet and Intel will all report, providing a potential short-term volatility catalyst across risk assets.“Earnings season is officially in full-swing,” trader resource The Kobeissi Letter summarized in a thread on X.Following last week’s lower-than-expected US inflation data, meanwhile, Trump was buoyant, calling the numbers “great news.”“As Investment pours into our Country, Factory Construction surges, Manufacturing Jobs rise, and Prices fall, there is so much to be proud of — The Golden Age of America is here!” he wrote in a post on Truth Social.Markets remained conservative on policy changes from the Federal Reserve, with the latest data from CME Group’s FedWatch Tool showing consensus for a 0.25% interest-rate hike in September.Fed target-rate probabilities for September FOMC meeting (screenshot). Source: CME GroupBitcoin spot demand returns lowerLackluster spot-market demand remains a key stumbling block on the road to bull-market recovery, research says.In a blog post on Monday, onchain analytics platform CryptoQuant revealed that a modest supply increase at the start of July had already dissipated. “Bitcoin’s 30-day Spot Demand recovered sharply to around -80K BTC in early July but has since deteriorated again to nearly -170K BTC,” contributor ScenarioX wrote. Bitcoin demand data (screenshot). Source: CryptoQuantEarlier, Cointelegraph reported on spot demand staying negative while recovering significantly on a rolling 30-day basis as BTC/USD hit $64,000. At the same time, futures markets saw a more pronounced influx of interest.This was reflected in net flows to the US spot Bitcoin exchange-traded funds (ETFs), which were positive for four out of five days last week, per data from UK-based investment manager, Farside Investors.“Despite this significant decline in spot demand, Bitcoin’s price has remained relatively stable, mainly due to easing short-term selling pressure and short covering in the derivatives market,’ ScenarioX said.“However, derivatives demand remains insufficient to support a sustainable uptrend on its own. This leaves the market in a structurally fragile state, where renewed spot selling could trigger a sharp downside move.”US spot Bitcoin ETF netflows (screenshot). Source: Farside InvestorsCryptoQuant suggested that the market could still continue to gain “for a while” before futures demand was exhausted.“However, the rally without meaningful spot demand is likely to end in a significant long liquidation event,” ScenarioX warned.Puell Multiple lows fail to convinceA classic BTC price metric is showing signs of a reversal this month, but CryptoQuant warns that it is too early to talk of a “generational low.”The Puell Multiple, which measures the USD value of newly issued BTC each day relative to its 365-day moving average, continues to head higher after seeing macro lows in early June.“A low reading means miner income is well below normal,” CryptoQuant contributor TheChessOnChain explained in a blog post.Bitcoin Puell Multiple. Source: CryptoQuantPuell in turn reflects on Bitcoin miners’ financial stability, and June’s 0.87 reading was the lowest since September 2024. Zooming out, however, each BTC price cycle has delivered higher lows for Puell, potentially boosting that latter reading’s chances of forming the next floor.“These bottoms are getting shallower, and the four-year supply cut (the halving) is not the cause: the metric scales both sides of its ratio, so cutting new supply cancels out. The real driver: price falls less each cycle (down 83% in 2018, 77% in 2022, less since), so miner income never sinks as deep,” TheChessOnChain said.Bitcoin Puell Multiple data (screenshot). Source: CryptoQuantWhile Puell lows do not strictly correspond to BTC price bear-market bottoms, TheChessOnChain suggests that waiting for new lower readings — including the metric’s classic deep value territory — may be a flawed strategy.“The 2024 and 2026 lows came with price still high, so they are Puell lows, not price bottoms. Waiting for the classic sub-0.5 zone, where miners sell at a loss, may mean waiting for a level that no longer prints,” they said. “Today reads as easing miner pressure, not a generational low. It turns decisive only if it holds beneath recent lows for weeks.”Crypto sentiment gauge nears two-month highDespite macro headwinds brewing over the weekend, crypto market sentiment continues to post a steady recovery.Related: Bitcoin bottom countdown nears 50 days after BTC supply in loss passed 50%The latest readings of the Crypto Fear & Greed Index show panic slowly dissipating among the broader investor base.On Monday, the gauge measured 29/100 — still within its “fear” bracket but at its highest levels since the start of June. For much of the intervening period, crypto was gripped by “extreme fear.”Crypto Fear & Greed Index (screenshot). Source: Alternative.meIn commentary on the rebound last week, research platform Santiment underscored its timing with the return of ETF inflows.“After a long outflow stretch throughout May and June, this shift signals ETF demand is back and confidence in crypto is starting to pick up again,” it wrote on X.Santiment argued that “encouraging” US inflation data had helped boost risk appetite, while “crypto policy optimism added another reason for sidelined buyers to re-enter.”

Čítaj viac

Bitcoin price sags under $62.5K as Iran strikes add to US stocks pressure

Bitcoin (BTC) dipped below $62,500 at Friday’s Wall Street open as stocks took a fresh hit from the US-Iran war.Key points:Bitcoin gives traders a sense of deja-vu as local highs spark rejection and rangebound moves continue.The US-Iran war pushes stocks and crypto lower.A bear-market trend line is now in place as resistance, copying historical patterns.BTC price action stays “very choppy”Data from TradingView showed BTC/USD extending losses with up to 2% daily downside.BTC/USD one-hour chart. Source: Cointelegraph/TradingViewUS stocks opened in the red, with the Nasdaq Composite Index also down nearly 2% at the time of writing. Fresh military strikes on Iran fueled the risk-asset retreat, while tech stocks continued to see selling pressure.Trading resource The Kobeissi Letter also flagged weakness arising from earnings disappointments, with Netflix shedding over 10% to start the US session.“The stock is now down -50% over the last 12 months and trading at its lowest level since August 2024,” it noted in a post on X.Netflix stock one-day chart. Source: Cointelegraph/TradingViewAfter hitting three-week highs, BTC price action fell back into its established range as traders saw copycat moves.“Market just keeps repeating same things,” commentator Exitpump wrote on X. “Dump into passive demand, OI increases with shorts piling up while spot starts buying which leads to bounce.”BTC/USDT five-minute chart with order-book data. Source: Exitpump/XTrader Daan Crypto Trades argued that current behavior was “typical” of summer.“Very choppy few days up, few days down kind of price action the last few weeks. No real action anywhere really,” he summarized.BTC/USD four-hour chart. Source: Daan Crypto Trades/XBitcoin seals key bear-market repeatTrader Jelle, meanwhile, remained optimistic, seeing range lows holding.Related: Bitcoin bottom countdown nears 50 days after BTC supply in loss passed 50%“Still think this looks good for a relief rally in the next weeks – which would give the market room to drop into October without nuking much deeper,” he told X followers.BTC/USD one-day chart. Source: Jelle/XIn updates on the bear market’s progress, trader and analyst Rekt Capital suggested that Bitcoin’s long-term downtrend was now in its final stages.BTC/USD, he wrote, had flipped its 50-month exponential moving average (EMA) to resistance, repeating bear-market history to set up its drop to a long-term floor.“The necessary technical milestone has been achieved,” he confirmed. “Which technically indicates that the majority of the anticipated move has already happened.”BTC/USD one-month chart with 21, 50EMA. Source: Rekt Capital/XAs Cointelegraph reported, Rekt Capital saw the July relief bounce ending with the onset of next month.

Čítaj viac

Bitcoin bottom countdown nears 50 days after BTC supply in loss passed 50%

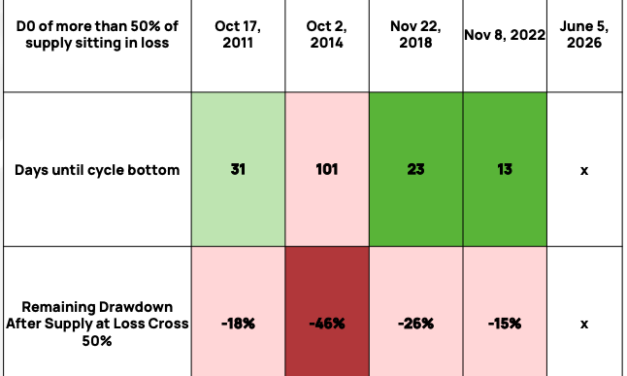
Bitcoin (BTC) has been counting down to its next bottom for nearly two months, a classic onchain metric suggests.Key points:BTC supply in loss passed 50% for the first time this bear market in early June.In previous bear markets, that event sparked a countdown to a new BTC price macro bottom.Separate data hints that the bull market’s “emotional premium” has now gone.Supply in loss countdown already Bitcoin’s second-longestIn its H1 2026 Round-Up report, crypto research company K33 Research flagged more than 50% of the BTC supply now being held at a loss.A typical bear-market feature, supply in loss has become a yardstick for progress toward macro bottoms for BTC/USD.K33 data shows that once supply in loss passes the 50% mark, the bottom has come no more than 101 days later. Bear markets have provided various time frames, with the shortest bottom “window” lasting just 13 days in 2022.The 2018 bear market required 23 days to reach its floor, while in 2014, Bitcoin continued to decline for 101 days after the 50% supply-in-loss mark was hit. In 2026, supply in loss repeated standard bear-market behavior, crossing 50% on June 5. Since then, 42 days have elapsed, making this year’s bottom window Bitcoin’s second-longest ever.BTC supply in loss and days until bear-market bottom (screenshot). Source: K33 ResearchIn accompanying commentary, K33 observed that returns over the year following the phenomenon “tend to be very solid.”Earlier this month, Axel Adler Jr., a contributor to onchain analytics platform CryptoQuant, estimated that supply in loss was around two months away from levels that correspond to bear-market bottoms.CryptoQuant data puts supply in loss at 46% as of July 17.“Distribution of capital” teases silver liningContinuing, CryptoQuant eyed what it described as “rare” readings from Bitcoin investor cost-basis models.Related: Bitcoin $107K buyers providing ‘early signals’ of 2026 bear-market bottom: GlassnodeThe realized cap variance (RCV) model, which measures the difference between realized cap and market cap, currently sits in the bottom six percent of its historical range.“Instead of tracking price alone, it isolates the variance between realized cap and market cap relative to its own rolling history, capturing how stretched or compressed investor cost basis has become versus current valuation,” contributor Crazzyblockk explained in a QuickTake blog post on Thursday. “When that variance compresses into deeply negative z-score territory, the emotional premium built during rallies has largely been priced out. The metric doesn’t read narrative, it reads the distribution of capital.”Bitcoin RCV data (screenshot). Source: CryptoQuantAt -2.35, standardized RCV’s Z-score is once again pointing to the final stages of the Bitcoin bear market.“Every prior stretch where the model spent extended time below a -2.0 z-score, late 2018, mid-2022, early 2015, preceded forward twelve-month returns north of 75%,” the post noted. “The most extreme reading in this dataset, -4.68 in November 2018, landed almost exactly on Bitcoin’s cycle bottom near $3,792.”

Čítaj viac

Bitcoin price dips on US stocks sell-off as Micron losses pass 30%

Bitcoin (BTC) cooled off with US stocks on Thursday as tech selling tempered gains from low inflation.Key points:Bitcoin follows US stocks as they come off local highs sparked by bullish US inflation data.Tech sell pressure contributes to slowing momentum as retail investors take profits.The BTC price rebound is seen rejecting at overhead resistance.Tech selling puts the brakes on crypto, risk-asset upsideData from TradingView showed BTC/USD circling $64,500, down 1.5% from its three-week highs seen the day prior.BTC/USD one-hour chart. Source: Cointelegraph/TradingViewThese had accompanied two straight days of lower-than-expected US inflation data, with both the Consumer Price Index (CPI) and Producer Price Index (PPI) dropping in June.While crypto and equities initially gained, tech stocks came under pressure on Thursday, with the closely-watched Micron Technologies down 15%.“Micron is now down over -30% since its June 22nd record high,” trading resource The Kobeissi Letter commented in a response on X.Micron Technologies one-day chart. Source: Cointelegraph/TradingViewKobeissi additionally noted profit-taking in action by retail tech-stock investors, with sales of Tesla and Apple hitting $200 million over the past two weeks.“Meanwhile, the total retail turnover in single stocks rose to a record $370 billion, up from $220 billion at the start of 2026,” it continued. “Retail investors are locking in gains following a historic tech rally.”Retail investor equity sales data. Source: The Kobeissi Letter/XEarlier, Cointelegraph reported on Bitcoin speculators cashing in on the recent local highs.“Rejection” becomes new BTC price keywordTurning to BTC price action itself, the mood among market participants remained conservative on the day.Related: Bitcoin $107K buyers providing ‘early signals’ of 2026 bear-market bottom: GlassnodeCommentator Exitpump flagged anchored volume-weighted average price (AVWAP) as measured from Bitcoin’s run to $82,000 in early May, as the level to end the current rebound.“Price is finally going to retest the AVWAP from 82K top that lead to strong local downtrend. To me such retest should cap the upside and give stronger rejection,” they told X followers.BTC/USD four-hour chart. Source: Exitpump/XTrader and analyst Rekt Capital argued that BTC/USD was “showing initial signs of rejection” from its 50-month exponential moving average (EMA) at $65,900.Rekt Capital reiterated the concept of current price behavior copying the 2022 bear market, having already warned that the next macro bottom would not come until later in the year.

Čítaj viac

Získaj BONUS 8 € v Bitcoinoch

nakup bitcoin z karty

Registrácia Binance

Burza Binance

Aktuálne kurzy