Autor Cointelegraph By William Suberg

Bitcoin has hit 'max fear' below $67K as analysis sees BTC price rebound

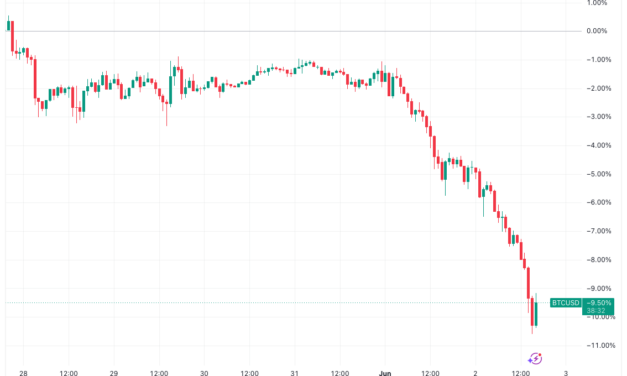
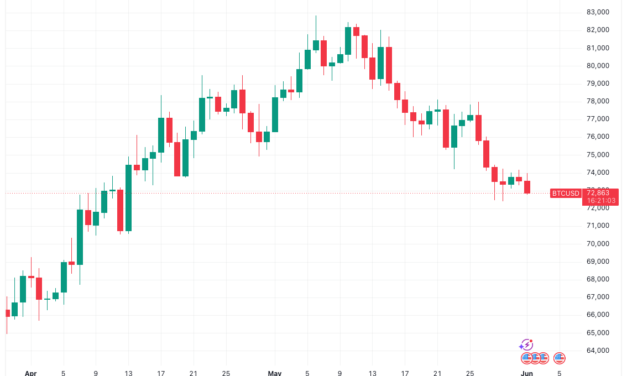
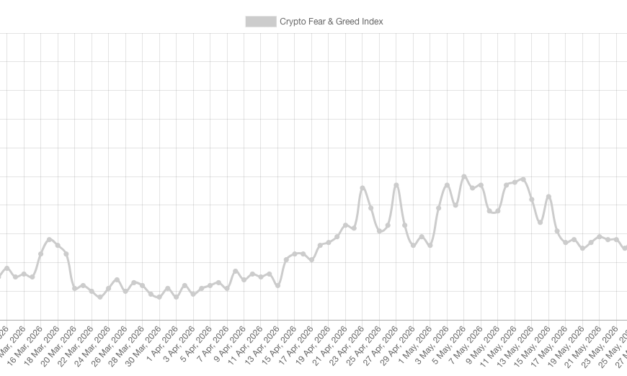
Bitcoin (BTC) is due a “relief bounce” next as crypto market sentiment hits two-month lows.Key points:The Crypto Fear & Greed Index hits “extreme fear” with its lowest score since early April.Analysis sees “max fear” accompanying Bitcoin’s drop toward $65,000.A game of “catch-up” should ensue later, with BTC price action targeting stock market records.Analysis: Crypto Fear & Greed Index crash “a good sign”In X analysis on Wednesday, commentary account Cryptic Trades flagged a collapse in the Crypto Fear & Greed Index.“A relief rally on $BTC IS COMING,” it wrote. “We’ve reached max fear, which is a good sign.”Crypto Fear & Greed Index (screenshot). Source: Alternative.meFear & Greed uses a basket of indicators to produce a normalized sentiment gauge for crypto between one and a hundred. Readings below 25 are classed as reflecting “extreme fear” among investors.On Wednesday, the Index stood at 11/100 — its lowest level since April 5. Since Monday, its score has more than halved, with Monday measuring 29/100, already within the “fear” bracket.The Index’s last local highs came on May 12, when BTC/USD traded above $80,000. A week prior, Fear & Greed had returned to “neutral” territory for the first time since January.Cryptic Trades acknowledged that to “remain cautious” is now the best approach.“Engagement is low, the sentiment is terrible, the social media interest has collapsed, and bearishness is everywhere. Ironically, that is exactly why I continue to remain bullish on the high timeframes,” a previous X post read.Bitcoin to rotate to “catch-up asset” amid stocks recordsAs Cointelegraph reported, Bitcoin has stood out as an underperformer in recent weeks, losing ground while US stocks hit new all-time highs.Related: Trump says Iran will ‘work out well’: Five things to know in Bitcoin this weekThe S&P 500 finished Tuesday’s trading session on yet another record, per data from TradingView.S&P 500 one-day chart. Source: Cointelegraph/TradingViewThe grim divergence has not been lost on crypto market participants, but Cryptic Trades sees cause for optimism as a result.“At some point, once the macro and geopolitical backdrop becomes more stable and the AI narrative softens, I expect liquidity to begin rotating toward assets that have lagged behind,” it argued. “When that happens, I believe crypto has the potential to become one of the main catch-up assets.”BTC/USD one-day chart. Source: Cointelegraph/TradingView

Čítaj viac

Bitcoin gets new $50K target after BTC price crashes 6% in a day

Bitcoin (BTC) losses passed 6% after Wednesday’s Wall Street open as a cascade of liquidations gathered pace.Key points:Bitcoin falls below $67,000 for the first time since the first week of April as losses pile on.Liquidations hit $1.25 billion over 24 hours as analysis sees the mid-$50,000 range returning.BTC/USD appears to repeat a bear flag breakdown from earlier in the year.BTC price dives to $66,950 in liquidation cascadeData from TradingView showed BTC/USD dropping as low as $66,948 on Bitstamp.BTC/USD one-hour chart. Source: Cointelegraph/TradingViewThat level marked the pair’s lowest since April 5, erasing months of gains as 24-hour cross-crypto liquidations hit $1.25 billion.Crypto liquidation history (screenshot). Source: CoinGlassContinuing a grim divergence from other risk assets, Bitcoin collapsed as the S&P 500 set yet another all-time high.BTC/USD vs. S&P 500 one-day chart. Source: Cointelegraph/TradingView“Investors are Macro Risk-Off, fleeing into Stablecoins and moving away from Bitcoin,” trader and analyst Rekt Capital wrote in a response on X.BTC/USD one-month chart. Source: Rekt Capital/XRekt Capital saw price targeting its 50-month exponential moving average (EMA) at $66,250 next.“There could be a limited reaction from there on contact but over time Bitcoin is likely to breakdown from this EMA and continue macro downside in this Bear Market,” he added.Source: KalshiAs prediction service Kalshi saw $50,000 returning, commentator Exitpump put the spotlight on record open interest contributing to an “insane amount of spot selling.”“I think this can end with a big red candle wiping out all the underwater longs from the system,” it warned X followers. “Maybe we hit low 60Ks or even mid 50Ks.”BTC/USDT 12-hour chart with exchange order-book data. Source: Exitpump/XBitcoin bear flag returns to the spotlightContinuing, CollinTalksCrypto, creator of the social media channel of the same name, brought back a familiar chart feature to explain the BTC price weakness.Related: Trump says Iran will ‘work out well’: Five things to know in Bitcoin this weekBTC/USD, he argued, was simply continuing a previous breakdown pattern, having exited a bear flag structure.“Many wanted to overcomplicate this with ‘this time is different,’ but bitcoin is just doing the same thing it always does in bear markets. It breaks down,” an X post read. “And it definitely takes longer than 4 months (Oct- >Feb $60k), despite the hopium to want otherwise. I think it’s more likely than many still want to admit that we see lower lows this year.”BTC/USD one-day chart. Source: ColinTalksCrypto/XColinTalksCrypto described the BTC price chart as “pretty straightforward.”

Čítaj viac

Bitcoin price falls under $70K as crypto markets liquidate $800M

Bitcoin (BTC) traded below $70,000 for the first time in two months on Tuesday as sellers stayed in control.Key points:Bitcoin drops under $70,000 to new two-month lows.Analysis sees 200-day trend lines coming back into play as bulls fail to rescue BTC price action.Stocks continue to post record highs while crypto stays bearish on US-Iran events.BTC price analysis warns of “bearadise” as support thinsData from TradingView showed new BTC price lows of $69,631 on Bitstamp.After failing to follow stock markets higher, BTC/USD increased its divergence from other risk assets to fall by nearly 2% on the day.BTC/USD one-hour chart. Source: Cointelegraph/TradingViewCrypto long positions paid the price, with total 24-hour liquidations on Bitcoin and altcoins nearing $800 million at the time of writing, per data from CoinGlass.Crypto liquidation history (screenshot). Source: CoinGlass“The pressure is building,” trader Ardi responded to the latest price moves in a post on X. “We’ve seen BTC lose multiple key support levels in the space of 24 hours, and is now breaking below an already steep downward channel.”Ardi described the loss of $72,500 as “key.”“Once support starts breaking across multiple timeframes, the market usually starts moving toward the next major liquidity pivot. For me, that sits around $68.7K,” he continued. “Unless BTC can reclaim this breakdown quickly, I think we’ll be heading there shortly.”BTC/USD one-day chart. Source: Ardi/XOn Monday, trading resource Material Indicators flagged concerning signals from one of its proprietary trading tools.“We still need to watch levels to determine if this is going to develop into a base building consolidation, or the next leg down,” it told X followers. “The fact that price just fell through another Timescape level is another sign of weakness.  The real test comes at the Q2 2026 Timescapes in the $68k – $69k range.”BTC/USD one-month chart. Source: Material Indicators/XMaterial Indicators added that continued downside could bring the 200-day simple moving average into play.“If bulls lose that range – pack your bags for Bearadise,” it added.Stocks surge while crypto discounts Iran peaceBitcoin faced multiple headwinds, including uncertainty over the US-Iran ceasefire deal, which on Monday appeared unlikely to succeed. Related: Trump says Iran will ‘work out well’: Five things to know in Bitcoin this weekUS President Donald Trump then revealed that talks were “continuing, at a rapid pace” between both sides.The S&P 500 posted a fresh all-time high before cooling after passing 7,600 points for the first time.S&P 500 one-hour chart. Source: Cointelegraph/TradingViewCommenting, trading resource The Kobeissi Letter noted that the index could see its first 10 straight weeks of gains since 1985.“That’s +$11.7 TRILLION in market cap since March 30th” it added about current upside.

Čítaj viac

Bitcoin drops to 7-week low under $71K as US-Iran ceasefire hopes fade

Bitcoin (BTC) hit new seven-week lows on Monday amid a collapsing peace deal between the US and Iran.Key points:Bitcoin falls quickly as it appears that Iran is withdrawing from peace negotiations.Oil spikes while stocks avoid volatility, but not even solid US PMI data can save BTC price action.Analysis warns that Bitcoin may bring back its old 2024 peak as new resistance.BTC price nears $70,000 on new Iran woesData from TradingView showed BTC/USD nearing $71,000 for the first time since mid-April.BTC/USD one-day chart. Source: Cointelegraph/TradingViewThe pair suffered as it appeared that a 60-day ceasefire to halt the US-Iran war would not go ahead.“Talk about a turn of events,” trading resource The Kobeissi Letter reacted on X. Kobeissi referenced changing rhetoric around the peace negotiations, which US President Donald Trump had suggested were imminent as recently as the weekend.“Exactly 9 days ago, President Trump said a deal with Iran was coming ‘shortly,’” it continued. “Today, Iran has officially backed out of all negations with the US and is threatening to block both the Strait of Hormuz and Bab el-Mandeb. It’s going to be an eventful month.”CFDs on US WTI crude oil one-day chart. Source: Cointelegraph/TradingViewUS WTI crude oil neared $95 on the back of the latest developments, putting renewed attention on inflationary forces.Stocks, however, managed to avoid major losses, continuing a trend of “pricing in” turbulence around Iran.S&P 500 one-hour chart. Source: Cointelegraph/TradingViewBitcoin thus failed to enjoy a relief bounce on US manufacturing data, which remained in an uptrend — something that had supported BTC price action since February.The May print of the Institute for Supply Management (ISM) Manufacturing Purchasing Managers’ Index (PMI) came in at 54%, marginally below expectations but still 1.8% higher than in April.“A Manufacturing PMI® above 47.5 percent, over a period of time, generally indicates an expansion of the overall economy. Therefore, the May Manufacturing PMI® indicates the overall economy grew for the 19th straight month,” ISM commented.US manufacturing PMI data (screenshot). Source: ISMBitcoin risks flipping 2024 highs to resistanceBitcoin traders were predictably nervous about the latest down move, seeing pressure continuing in the short term.Related: Trump says Iran will ‘work out well’: Five things to know in Bitcoin this weekCommenting, trading account Cryptic Trades told X followers that $71,800 was of key importance, now failing to hold back sellers.“$BTC must hold above this level in order to keep the bullish outlook intact. Else, it would be a clear structural and trend invalidation,” it warned.BTC/USD one-day chart. Source: Cryptic Trades/XTrader and analyst Rekt Capital noted that the price was rejecting near old all-time highs from 2024 at around $73,800.“Unless Bitcoin reclaims the 2024 ATHs soon, this sequence of technical events increases the chances of Bitcoin revisiting the 2021 All Time Highs for a retest,” he predicted.BTC/USD one-month chart. Source: Rekt Capital/X

Čítaj viac

Trump says Iran will 'work out well:' Five things to know in Bitcoin this week

Bitcoin (BTC) heads into June with new local lows as the US-Iran war drives crypto market nerves.Iran ceasefire hopes hang in the balance as military strikes return, but US president Donald Trump appears confident that “it will all work out well in the end.”BTC price weakness quickly returns after the May close, with $72,000 liquidity on the radar.US employment data could still deliver a classic BTC price tailwind.Bitcoin long-term holders are putting February’s $60,000 lows in doubt as a reliable floor.Sentiment research calls for a flush of overly optimistic traders’ positions next.Trump on Iran: “Just sit back and relax”News of strikes on Iranian targets keep the Middle East conflict firmly on the radar as a source of crypto market volatility this week.Exchanges of fire meant that BTC price action quickly came under pressure following the monthly close, dropping below $73,000.BTC/USD one-day chart. Source: Cointelegraph/TradingViewThe latest events further brought into question the odds of a ceasefire being signed, with this notionally meant to last at least 60 days.“Iran really wants to make a deal, and it will be a good one for the U.S.A. and those that are with us,” US president Donald Trump wrote in a post on Truth Social on Monday.Trump referenced hurdles in the form of political dissent at home — rather than specific problems involving Iran itself — as the reason for the lack of progress.He concluded:“Just sit back and relax, it will all work out well in the end – It always does!”Source: Truth SocialDespite Bitcoin feeling the heat, US stocks looked set to continue a trend of divergence with crypto as the new week began. S&P 500 futures opened the week up by around 0.25%.Commenting on the factors driving the equities rally, which last week saw repeat new all-time highs, trading resource Mosaic Asset Company put AI firmly in focus.“The narrative driving the stock market has hardly changed in recent weeks,” it wrote in the latest edition of its regular analysis series, Mosaic Chart Alerts. “Optimism around a potential peace deal between the U.S. and Iran helps to spark a rally in the major indexes. For the most part, there has been very little substance behind the headlines, but that hasn’t stopped the rally in stocks linked to the AI infrastructure buildout.”Bitcoin price caught between liquidity and CME gapBitcoin started the first week of June with a bump as US-Iran war tensions quickly spilled over into BTC price action.Data from TradingView shows a trip below $73,000 just hours after the weekly and monthly candle close.BTC/USD one-hour chart. Source: Cointelegraph/TradingView“For now price is stuck within this mini-range since last week,” trader Daan Crypto Trades summarized in his latest analysis on X. “~$74.2K keeps rejecting price as resistance while ~$72.7K is held as support. Those are the levels to watch in the short term.”BTC/USDT perpetual contract one-hour chart. Source: Daan Crypto Trades/XTrader CW suggested that the price was targeting nearby high-liquidity levels on exchange order books, notably a position closer to $72,000.“The buy wall for $BTC whales is at 72k and the sell wall is at 80k,” they added.BTC order-book liquidation heatmap. Source: CW/XA silver lining came from the weekly close itself, which preserved what trader and analyst Rekt Capital said would be a key level for bulls — $73,000.“If Bitcoin manages to Weekly Close above $73k then price will be one step closer to confirming the Double Bottom breakout & be positioned to try to trend continue,” he told X followers at the weekend.To the upside, trader CrypNuevo flagged a lone CME Group’s Bitcoin futures near $75,000 as a potential short-term BTC price target.CME Bitcoin futures 15-minute chart. Source: CrypNuevo/XAs Cointelegraph reported, CME gaps became a thing of the past last week as its futures market started to trade 24 hours a day, seven days a week.CrypNuevo said that they were looking for a “W”-shaped reversal pattern for price on low time frames.PMI leads potential BTC price boost sourcesThe coming week sees inflation data yield to employment cues as the labor market becomes traders’ key focus.Monday starts with the May print of the Institute for Supply Management (ISM) Manufacturing Purchasing Managers’ Index (PMI) — one of two core PMI releases this week.ISM has been in a fresh uptrend since earlier in the year, when it ended a three-year period of contraction and immediately delivered a tailwind to Bitcoin price performance.Commenting, entrepreneur and investor Mark Chadwick had some good news for crypto bulls. Based on business cycles, recent PMI figures could preclude a new period of gains.“Expansion zones perfectly align with previous Alt Seasons – and we’re about to expand! The data backs it up too: ISM PMI has been above 50 for 3 straight months. Above 50 = expansion,” he wrote in an X post alongside data from pseudonymous analyst TechDev.BTC/USD versus employment cycle. Source: Mark Chadwick/XThe coming days also see US nonfarm payrolls numbers, providing a snapshot of the labor market against a backdrop of rising inflation.In a note of caution, Mosaic Asset Company reminded readers of last week’s high Personal Consumption Expenditures (PCE) inflation report.“For investors hoping that the boost in inflation could be temporary from the jump in energy prices, the report contained bad news,” it continued. “The core goods figure that excludes food and energy rose by 2.8% and is one of the biggest increases in decades outside of the pandemic aftermath.”US PCE index % change (screenshot). Source: Bureau of Economic AnalysisBitcoin long-term holders may produce a new bear-market lowBitcoin holder trends mean that the BTC price bottom may well still be ahead in the 2026 bear market.New findings from onchain analytics platform CryptoQuant cast doubt on the BTC price rebound from multiyear lows near $60,000.“A rebound during a downtrend is hard to read as a bottom, because even within it the LTH (long-term holder) UTXO share keeps rising rather than declining,” contributor AbstractRyu wrote in a Quicktake blog post on Monday.The post compares unspent transaction outputs (UTXOs) involving coins dormant for more than or less than six months, with the former classed as LTH coins. “On Realized Cap – UTXO Age Bands (%), there are only two ways the LTH (6m+) share grows: existing holdings age in place without being spent, or STH (short-term holder) coins cross the six-month mark and reclassify as LTH,” it explains. “Neither reflects fresh demand reviving turnover. That is why a rising share, on its own, is hard to read as bullish.”Bitcoin UTXO age data (screenshot). Source: CryptoQuantAs such, even BTC/USD rebounding by $20,000 versus its local lows is not enough to insure the market against a new macro floor. For this, LTH activity must pick up via some form of “distribution” phase.“At present, the LTH band share has not declined at all, even through the rebounds marked by the blue circles,” AbstractRyu concluded alongside an explanatory chart. “Distribution has not begun, and last month’s rebound, too, was likely a dead-cat bounce. The bottom is not yet in.”Bitcoin “long-leaning bias” in need of a flushBitcoin continues to field concerns over a “long squeeze” thanks to overly bullish bets on BTC price action.Related: Bitcoin price record 90-day uptrend ‘resembles bull market rally:’ New analysisIn an analysis over the weekend, CryptoQuant contributor Nino flagged positive funding rates as an ongoing signal to be “cautious” in the current market.Funding rates, as Cointelegraph reported, have flipped net positive, indicating a “long-leaning bias” among traders. Now, on a three-day rolling basis, funding is approaching its highest levels since the start of the year — even as price action itself tracks sideways.“Recent market observations suggest that the 72-period moving average cluster for funding rates is showing a positive bias, approaching levels reminiscent of the peak seen in late January 2026,” Nino summarized. “Coupled with the current stagnation in price action, this dynamic could imply an accumulation of long positions that have yet to translate into sustained upward momentum.”Bitcoin funding rate data (screenshot). Source: CryptoQuantThe implication is that price could redress the balance of longs and shorts by liquidating the former with a drop to new local lows.“Consequently, the short-term outlook appears somewhat cautious, raising the possibility of a near-term downward leg as the market might need to clear potential excess leverage,” Nino added.In its own analysis, crypto sentiment platform Santiment described the overall market mood as its most “lopsided positive” of 2026 so far.“The current euphoria contrasts sharply with the bearish ETF flow picture and warrants caution,” it advised.

Čítaj viac

Získaj BONUS 8 € v Bitcoinoch

nakup bitcoin z karty

Registrácia Binance

Burza Binance

Aktuálne kurzy