Autor Cointelegraph By William Suberg

Bitcoin will get ‘lift’ from Hyperliquid, Robinhood in next crypto bull market: Bitwise exec

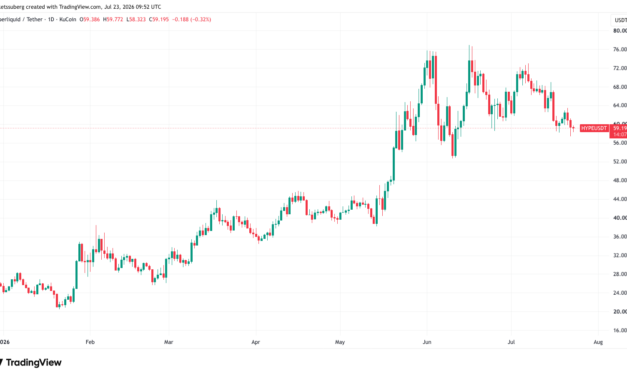
Bitcoin (BTC) is “finally showing signs of a bottom,” but the next bull market will have a different source.Key points:TradFi integrations, particularly Hyperliquid and Robinhood, will drive the next crypto bull market, says Bitwise’s Matt Hougan.The resulting tide should “lift” the largest cryptocurrencies with it, including Bitcoin and Ether.Apparent demand for BTC is already showing signs of reversal, per Bitwise data.Hyperliquid, Robinhood catalyst to “lift most of” crypto sectorIn a blog post on Wednesday, Matt Hougan, chief investment officer at crypto asset manager Bitwise, revealed his picks for what will “lift” BTC price action going forward.BTC/USD is gaining ground against US stocks, Hougan notes, but investors should look elsewhere for the next long-term crypto comeback.“So how should you start positioning for the new bull market?” he queried. “By looking at two entities that are leading this convergence from opposite sides: Hyperliquid (HYPE) and Robinhood (HOOD).”For Hougan, the bull market will depend on crypto-focused integrations that bring the market’s inherent benefits, such as 24/7 trading, to the TradFi realm.“Today, nearly half the volume on Hyperliquid is in conventional assets like oil, silver, and the S&P 500. It’s expanding into spot commodities, prediction markets, and options,” he said about Hyperliquid.HYPE/USDT one-day chart. Source: Cointelegraph/TradingViewHougan also sees competition from traditional financial players, like the Robinhood Chain layer-2 network, as a key catalyst to bring about a broader crypto renaissance.“I suspect the coming bull market will be big enough to lift most of the sector,” he said. “I’m bullish on the majors—Bitcoin, Ethereum, Solana, etc.—and on crypto equities. But there are two types of investments I think are particularly well positioned.”HOOD/USD one-day chart. Source: Cointelegraph/TradingViewThe Bitwise executive has remained optimistic on Bitcoin and the wider market throughout 2026, in February predicting that the end of crypto winter would come “sooner rather than later.”“Here’s the good news: We’re closer than you think,” he wrote at the time.Bitcoin apparent demand reverses higherAs Cointelegraph reported, Bitcoin traders broadly agree that while some bottom signals are already flashing, the bear market has several months or more left to run.Related: Bitcoin analysis eyes ‘serious volume’ after Binance sees 9K BTC daily outflowSpot demand remains weak and has become a key talking point, even on shorter time frames. Here, however, Bitwise also sees a potential shift underway.In an X post on Thursday, European head of research, Andre Dragosch, described “re-accelerating” apparent demand.Apparent demand measures the difference between newly-mined BTC and the supply inactive for at least one year. Bitcoin apparent demand data. Source: Andre Dragosch on X.com

Čítaj viac
Bitcoin price avoids major Iran jitters as S&P 500 ‘short squeeze’ on horizon

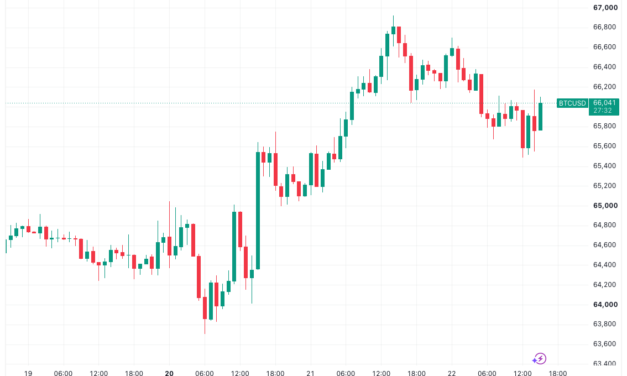
Bitcoin (BTC) held higher on Wednesday as crypto and risk assets continued to brush off US-Iran war tensions.Key points:Bitcoin limits its comedown from five-week highs despite fresh escalation in the US-Iran war.US stocks also ignore the potential risks, as analysis warns that shorts could pay as a result.A Bitcoin trader sees BTC/USD outperforming the S&P 500 going forward.Bitcoin, stocks digest Trump pledge to “destroy” Iran power plantsData from TradingView showed BTC/USD down 1% on the day, having earlier hit five-week highs near $67,000.BTC/USD one-hour chart. Source: Cointelegraph/TradingViewCrypto and US stocks continued Tuesday’s direction, which saw them ignore escalation in the Middle East, including direct strikes by both Iran and the US.US president Donald Trump threatened attacks on Iranian bridges and energy infrastructure, which had only a mild impact on market performance.“From this point forward, any time the Islamic Republic of Iran shoots at a ship in the Strait of Hormuz, whether it be by Missile, Rocket, Drone, or any other device or weapon, the United States will bomb and destroy ONE BRIDGE OR POWER PLANT, including those located next to, or in, the Capital City of Tehran,” he wrote in a post on Truth Social.Only oil prices saw volatility on the day, with WTI and Brent crude reaching $88.60 and $95.50, respectively, both at their highest since June 11.CFDs on WTI crude oil vs. CFDs on Brent crude oil one-day chart.Source: Cointelegraph/TradingViewStocks’ bullish momentum prompted trading resource The Kobeissi Letter to suggest that those betting on a market reversal could see more pain.“Short interest in the S&P 500 is up to ~3.7% of its free float, near the highest in data going back to 2010. Short interest in the Russell 3000 is up to ~6.1%, also near an all-time high,” it reported on Tuesday alongside data from Bloomberg.“Both metrics have steadily increased since the start of 2025.”S&P 500 index short-interest data. Source: The Kobeissi Letter on X.comKobeissi suggested that a “short squeeze” could result, punishing late short positions.Trader sees BTC price outperforming stocksAs for Bitcoin, traders continued to wait for a more decisive move, with $67,000 a particular focus. At time of publication, it was at roughly $65,975, with 24-hour trading volume topping $30.3 billion, according to CoinMarketCap data.Related: Bitcoin analysis eyes ‘serious volume’ after Binance sees 9K BTC daily outflow“Breaking above that point would make for a daily bullish market structure break putting in a higher high,” trader Daan Crypto Trades told X followers earlier Wednesday. “This is the first daily higher high since the push up in May.”BTC/USDT four-hour chart. Source: Daan Crypto Trades on X.comTo be sure, some traderseyed pronounced BTC price strength against the S&P 500.“$BTC vs. US stocks is seeing a strong weekly bullish divergence and is at the brink of an RSI trend breakout,” an X post by Osemka read, referring to the relative strength index (RSI) leading indicator. “Divergent lows are 5 months apart, similar to literal 2022 lows. $BTC should outperform the US stock market nicely for the foreseeable future from the most mis-priced territory in history, as the lows should already be in.”BTC/USD vs. S&P 500 one-week chart. Source: Osemka on X.comAs Cointelegraph reported, broad consensus continues to favor Bitcoin’s next bear-market low coming later this year or in early 2027.

Čítaj viac

Bitcoin analysis eyes ‘serious volume’ after Binance sees 9K BTC daily outflow

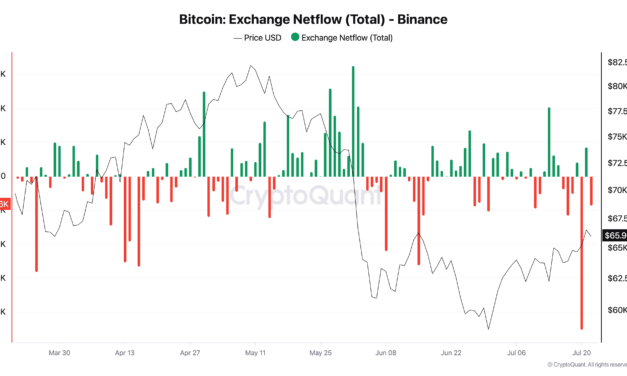
Bitcoin (BTC) buyers are showing “better absorption” at $65,000 after Binance saw its largest net outflow in nearly two years.Key points:Bitcoin exchange outflows are back on the radar after Binance sees net 9,000 BTC daily withdrawals.Seller absorption is improving, even amid sideways price action, analysis says.Institutional appetite persists with net positive ETF inflows.Binance 9,000 BTC daily outflow raises eyebrowsNew research from onchain analytics platform CryptoQuant released on Wednesday confirms that daily BTC withdrawals from the world’s biggest exchange are outpacing inflows.“This usually reflects that short-term supply pressure on Binance is easing to some extent, as $BTC is not being sent to the exchange aggressively for potential selling,” contributor Rei Researcher wrote.CryptoQuant data shows that on a day-by-day basis, Binance netflows toggle between positive and negative after a string of positive days which ended in early June.Binance BTC netflows. Source: CryptoQuantOne date, however stands out: On Tuesday, Binance saw a net outflow of more than 9,000 BTC, the largest single-day tally since November 2024.“When outflows hit this size, someone is moving serious volume into self-custody. Coins off exchanges are coins that won’t be sold into the order book,” fellow contributor Ruga Research commented in a separate post.Binance BTC netflows. Source: CryptoQuantRuga said that on rolling 30-day time frames, netflows continue to repeat a pattern of fluctuations, and the latest spike could still reverse.“Can this one fail? Absolutely. Momentum has been indecisive around the zero line for two weeks. It hasn’t committed. And what happens next, honestly, nobody knows,” he wrote, referring to the mixed net positive and negative inflow days. “But someone just moved 9,030 BTC off the largest exchange while momentum recovers from extreme negative territory. That combination has historically resolved to the upside.”Exchange flows don’t mean new BTC uptrend Rei Researcher also avoided suggesting that a major BTC price trend change could come as a result.Related: Bitcoin $107K buyers providing ‘early signals’ of 2026 bear-market bottom: Glassnode“The notable point is that negative netflow is appearing while $BTC price has recovered to around $65K–$66K. This suggests that the market is showing better absorption compared to the previous weak phase,” he explained. “However, negative netflow does not automatically confirm a new uptrend. It needs to be accompanied by spot demand, volume, and a more stable price structure.”US spot Bitcoin ETF netflows (screenshot). Source: Farside InvestorsAs Cointelegraph reported, consensus currently sees a full bull-market rebound hamstrung by a lack of sufficient spot demand.Only derivatives are seeing a turnaround compared to recent months, in part evidenced by net inflows to the US spot Bitcoin exchange-traded funds (ETFs). 

Čítaj viac

Bitcoin nears seven-week high as stocks ignore Iran strikes, Trump 10% tariff plans

Bitcoin (BTC) built on gains at Tuesday’s Wall Street open as crypto echoed resilient US stock markets.Key points:BTC price action approached $67,000 despite new geopolitical and macroeconomic pressures.Neither the US-Iran war nor proposed international trade tariffs were able to disrupt risk-asset upside.Bitcoin needed a reclaim of its 21-week simple moving average to challenge the bear market, analysis warned.Bitcoin, stocks ignore Iran war, fresh US tariffsData from TradingView showed BTC/USD approaching $67,000, closing in on seven-week highs.BTC/USD one-hour chart. Source: Cointelegraph/TradingViewUpward momentum that began the day showed little signs of stopping despite macro conditions that seem to favor a risk-off mindset.The US-Iran war saw further escalation on the day as Iran struck Amazon facilities in Bahrain in response to US strikes, while the Strait of Hormuz oil route remained closed.As a result, WTI crude oil prices reached their highest levels in over a month, nearing $85 per barrel.CFDs on WTI crude oil one-day chart. Source: Cointelegraph/TradingViewMultiple media reported US president Donald Trump plans to introduce new 10% international trade tariffs. These would follow 50% measures imposed on Canada this week.Despite these notional headwinds for crypto and risk assets, traders attributed the lack of bearish reactions to expectations that the situation would ultimately resolve in markets’ favor.“Markets are pricing in peace,” YouTube channel host Crypto Rover summarized in a post on X to their 1.6 million followers.Caleb Franzen, creator of Bitcoin and macro analysis resource Cubic Analytics, was confident about the near-term trend in the S&P 500 index.“I reiterate… I have zero fear, concern, or worry with S&P 500 futures looking like this,” he told X followers on Monday.S&P 500 futures one-day chart. Source: Caleb Franzen/XTo be sure, words of caution came from figures such as JPMorgan CEO, Jamie Dimon, who warned that markets were treating current risks too lightly.BTC price needs 21-week trendline reclaim: AnalystWhile some traders looked for a retest of levels up to and including $70,000, Keith Alan, cofounder of trading resource Material Indicators, was conversely cautious on the BTC price outlook.Related: Trader maintains $67K BTC price target: Five things to know in Bitcoin this weekDespite a “golden cross” involving the 21-day and 50-day simple moving averages (SMAs) on Monday, the bear market, he warned, had gone nowhere.“Bear Markets don’t always look like Bear Markets, especially in lower timeframes,” he wrote in his latest X analysis.“The macro trend will be challenged if Bitcoin pushes above the 21-Week SMA. Until that happens, the Bear Market remains intact.”BTC/USD one-day chart with 21-week, 50-week SMA. Source: Cointelegraph/TradingViewThe 21-week SMA stood at $69,720 at the time of writing, coinciding with Bitcoin’s then-all-time high from 2021.Alan acknowledged that there was “no real resistance” until $67,250.

Čítaj viac

Bitcoin price gains to $66.3K as range breakout attempt sparks one-month high

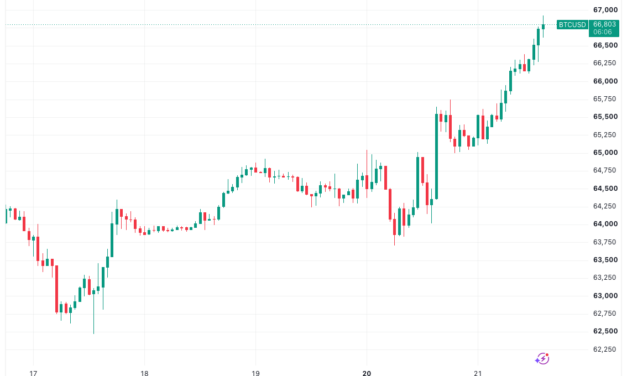
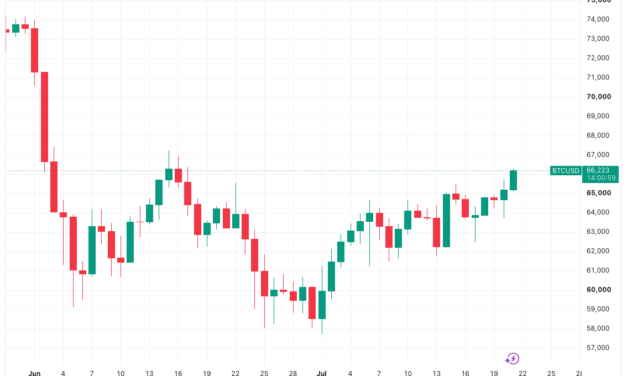
Bitcoin (BTC) passed one-month highs on Tuesday as price action defied the odds to top $66,000.Key points:Bitcoin broke through resistance to hit $66,000 for the first time in more than a month.Traders see as much as 6% BTC price gains if further nearby upside targets are reached.Month-end derivatives positioning underscores crypto risk confidence slowly returning.BTC price 6% upside could come “very quickly”: TraderBTC/USD hit highs of $66,306 on Bitstamp, according to TradingView data. That’s a level last seen on June 17.BTC/USD one-hour chart. Source: Cointelegraph/TradingViewA series of rejections around the $65,000 mark had failed to quash traders’ enthusiasm, with calls for $67,000 or higher gaining momentum. Those short-term predictions continued on the day, with key psychological levels around $70,000 now on the horizon.“$BTC reclaimed the range lows, and is now pushing higher – as expected,” trader Jelle wrote in his latest analysis on X.“The area between 65 and 67k is resistance from the Q1 range, but given how we sliced through it on the way down – it might not put much of a fight up here either. Eyes on those 70k range highs if so.”BTC/USD one-day chart. Source: Jelle/XShort liquidations began to mount as the BTC price broke through range highs, with data from CoinGlass putting 24-hour cross-crypto liquidations at around $200 million.BTC/USD vs. crypto liquidations (screenshot). Source: CoinGlass“$BTC has reclaimed the $65,000 level. The next key resistance is $67,500-$68,000, which means Bitcoin has some room to pump,” trader Ted Pillows said. “If BTC manages to reclaim the $68,000 resistance too, it could rally another 5%-6% very quickly.”BTC/USDT one-day chart. Source: Ted Pillows/XConcerns had accompanied the start of the latest move, with commentator Exitpump seeing closing short positions fueling the upside.“There’s very little real buying interest here,” they warned X followers while analyzing derivatives markets.BTC derivatives hint at risk-on returnObserving options trends, trading company and market maker QCP Capital flagged “some demand” for higher Bitcoin bets into the end of July.Related: Trader maintains $67K BTC price target: Five things to know in Bitcoin this weekHere, it noted the US Federal Reserve would hold its next meeting on interest-rate changes, with chair Kevin Warsh potentially offering fresh insight into future policy.As Cointelegraph reported, market expectations remain that the Fed will leave rates unaltered before September. CME Group’s FedWatch Tool shows 83.4% probability that policy makers will stick with the current target range of 3.50-3.75% at their July 29 meeting. For the Sept. 16 FOMC meeting, there’s a 53.8% probability of a hike to 3.75-4.00%.“There has been some demand for month-end BTC upside,” Monday’s QCP Market Colour analysis said. “This positioning leaves dealers short upside gamma into the 28 to 29 July FOMC meeting, increasing the potential for an accelerated move higher should tensions around the Strait of Hormuz ease.”QCP referred to the US-Iran war once again closing a key global oil route.

Čítaj viac

Získaj BONUS 8 € v Bitcoinoch

nakup bitcoin z karty

Registrácia Binance

Burza Binance

Aktuálne kurzy