Autor Cointelegraph By William Suberg

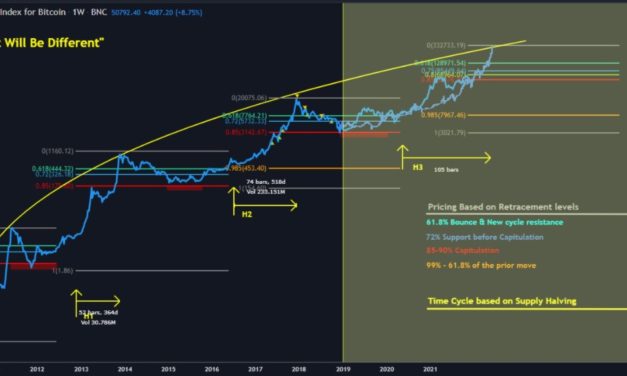
Bitcoin can hit $333K 'parabolically' if this BTC price fractal plays out

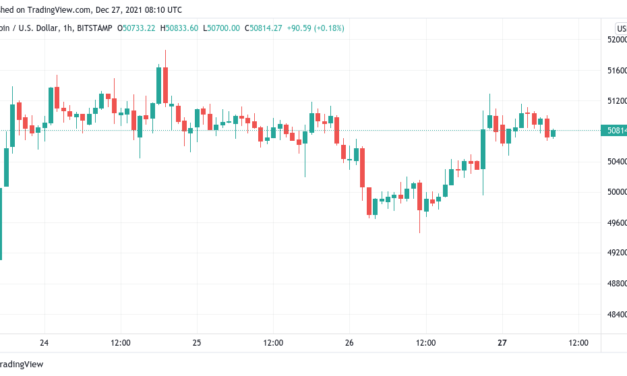
Bitcoin (BTC) could target a massive $333,000 by May 2022 if the U.S. Federal Reserve provides a “perfect storm” of low rates, a new prediction argues.Updating an uncannily accurate price forecast on Dec. 27, filbfilb, co-founder of trading platform Decentrader, drew dizzying conclusions about BTC price action next year.Analyst: “You don’t have enough crypto” for 2022 bull runAfter acting almost to the letter throughout 2021, BTC/USD stands to make huge gains in the coming six months if conditions remain the same.The Fed is poised to make two interest rate hikes next year, and these are likely priced in, pundits say — but a surprise change of tact could have far-reaching consequences.For Filbfilb, analyzing Fibonacci sequences alongside historical price action in previous halving cycles, Bitcoin could surge past $300,000 as a result of Fed officials toning down rate hikes.”To get there parabolically, we would probably need a perfect storm of the Fed being unable to raise rates (which are probably priced in) and heightened inflation, leading to a flight to safety in BTC,” he told Cointelegraph.An accompanying chart, posted on Twitter in December 2018 as BTC/USD bottomed out at $3,100, shows just how predictably the price action has run since.”Price is exactly where predicted,” Filbfilb told Twitter followers. “You don’t have enough crypto for what will happen in 2022.”BTC/USD annotated chart. Source: filbfilb/ TwitterAs astounding as it may sound, such a scenario is — at least technically — not as far-fetched as it seems.Signs are already pervading the market, as more and more indicators line up to demand a breakout to the upside. Even low-timeframe data is encouraging — Dec. 27, for instance, saw BTC/USD close a four-hour candle above the significant 200-day moving average (MA) for the first time in six weeks.The last time that an uptrend achieved the same feet was in late September, at the start of a run-up which produced the current $69,000 all-time highs.BTC 4hr:Candle closes in about an hour.It could be the first close above the 200ma in 6 weeks.Price action prior to the last cross looked similar.This time? pic.twitter.com/sMkFMEB9Ky— Nunya Bizniz (@Pladizow) December 27, 2021Stocks could win big — but not for longOn the topic of macro movements, the future looks bright for stocks as well amid a cooling U.S. dollar, commentators argue — even if rates do increase as expected.Related: Countdown to the yearly close: 5 things to watch in Bitcoin this weekGeorge Gammon, author of investing newsletter Rebel Capitalist Pro, was upbeat as the last week of 2021 began.”I think you may see Stock Market go way up in next couple months as “end of pandemic” narrative continues,” he forecast.”This gives Fed cover to raise rates after QE zero. After market digests & realizes economy has been decimated, then sees impact of higher rates, downside could be big.”The impact on Bitcoin in such a scenario would thus depend on its correlation with stocks, and whether it could rebound from a sudden downturn like the one Gammon suggests in a manner similar to March 2020.Regardless, popular opinion remains convinced that the peak is not yet in for Bitcoin after the about-turn in early December.

Čítaj viac

Countdown to the yearly close: 5 things to watch in Bitcoin this week

Bitcoin (BTC) starts a new week near $51,000 as the end of 2021 draws near and traders down tools for the holidays.After a $50,000 Christmas, Bitcoin continues to take stock of a year in which it has gone from $29,000 to $69,000 and halfway back again.Expectations were certainly not for such eerie calm to round out December — a blow-off top, the majority argued, should have already taken the market to $100,000 and beyond.Instead, after dipping to $41,800, a slow grind through familiar territory is how Bitcoin appears to be finishing off what has been a post-halving year full of surprises.With mixed emotions characterizing the end of Q4, Cointelegraph takes a look at what could shape BTC price action for the remaining few days of 2021.Bitcoin on shorter timeframes: “Gently does it”Despite concerns that thin liquidity could spark increased spot price volatility during the holiday season, so far, the opposite is true — Bitcoin is quiet, possibly too quiet.The weekend saw little by way of unusual price moves, with a brief dip below $50,000 subsequently returning to the upside.At the time of writing, $51,000 is forming a focus once more, with limited action up or down, data fro Cointelegraph Markets Pro and TradingView shows. BTC/USD 1-hour candle chart (Bitstamp). Source: TradingViewFor popular Twitter trader Pentoshi, this was reason enough to lie in wait for the more important $53,000 zone to return before acting.“Eyes still on 49.2 and 53-55k range per prev charts (contested territories),” he confirmed late on Sunday.He noted the “clean” nature of BTC/USD on weekly timeframes, with the pair just above the midpoint in a multi-month range with $58,000 as its upper bound and $32,000 as its lower bound.$58,000, he added in comments, could be the “most defining spot” for chartists in 2022.Cautious in the short term, meanwhile, was filbfilb, co-founder of trading platform Decentrader, who despite flagging multiple bullish signals on Christmas Day warned that current BTC/USD levels may be something of a bull trap.Unfortunately, PA now looks trappy at these highs, caution advised.— filbfilb (@filbfilb) December 25, 2021For him, the 50-day moving average, currently at $54,700, would be a bullish trigger point for the new year.Stock-to-flow lives to fight another yearThey may be facing a barrage of criticism, but the perennial stock-to-flow Bitcoin price models — and their creator, PlanB — refuse to give up.According to tracking account S2F Multiple, BTC/USD should ideally be trading at above $97,000 this week, but reality has other ideas.With the latest drawdown from all-time highs, Bitcoin is challenging the capabilities of a model series that has so far never been invalidated.This has provided for contention — stock-to-flow uses two standard deviation bands around a key trajectory to monitor price, and Bitcoin currently sits between them. While in fact nowhere near invalid, the model has courted claims that its range of acceptable price action is too wide to be useful.These were exacerbated when PlanB appeared to say that he would abandon the models should BTC/USD not trade at $100,000 by the end of 2021. “To be clear: I have no doubt whatsoever that bitcoin S2FX is correct and #bitcoin will tap $100K-288K before Dec2021,” he wrote in part of comments in early November.He subsequently retracted those claims, stressing that the standard deviation bands would dictate any technical invalidation. As such, stock-to-flow (S2F) and its spin-off stock-to-flow cross-asset (S2FX), both remain in play.“Imagine thinking a model that has stayed within 1 standard deviation band for 3yrs has failed,” he countered. “IMO we are in the exact same spot as March 2019 when I published S2F model: at the low end of the 1sd band. DYOR. Look at the chart. Your choice.”Bitcoin stock-to-flow chart as of Dec. 27. Source: Buy Bitcoin WorldwideS2F requires an average $100,000 price tag for Bitcoin this halving cycle, while S2FX ups that to $288,000.PlanB’s floor model, also accurate throughout Bitcoin’s history, failed to track the monthly close for the first time in November.Beware the open interest time bombBitcoin spot price action could give everyone a headache on thin holiday volumes, but a key area to watch is derivatives.After the clearout earlier this month, open interest in Bitcoin futures has been creeping back up. This in and of itself is unremarkable, but should expanding open interest combine with a conversely declining price, the stage is set for pain, filbfilb warns.Most of the time risk can be found in OI: price up, OI up ok, price down OI down not so bad, prices down OI flat / up, get rekt.— filbfilb (@filbfilb) December 26, 2021

He reasoned, however, that nuances mean the relationship between price and open interest moves is not as simple, but would “save” traders’ positions in volatile periods.Concerns have subsided, meanwhile, following the flushing out of excessive leverage across derivatives markets in the $42,000 rout.Despite leverage since returning, funding rates are neutral at $50,000, a conspicuous change from just several weeks ago, and confidence is building that sustained price upside can now continue as a result.On-chain indicators governing buyer and seller behavior, meanwhile, are also showing signs of a potential turnaround.“Big thing I keep my eyes on is for when the trend for both net realized profit and loss decrease to low levels,” Twitter account On-Chain College noted Sunday, highlighting data from on-chain analytics firm Glassnode. “Tells me that sellers may be exhausted, and we potentially could have more drastic price movement if buyers step in.”Bitcoin net realized profit/ loss annotated chart. Source: On-Chain College/ TwitterLiquidity caution spills over to macroMacro markets presented a now standard range of risk issues for the holiday break, these nonetheless also apt to cause greater than average moves thanks to reduced liquidity. Chart traders bewareThe last half of December is a time when chart pattern breakouts should be viewed with great suspicion. Many false breakouts occur during thinly traded holiday periods. pic.twitter.com/jdUvk6pxye— Peter Brandt (@PeterLBrandt) December 20, 2021

The prognosis for the coming days was thus “either the headline reel will spur ugly intraday moves on holiday-thinned liquidity, or volatility will remain so flatline, that if it were an ECG, the doctors and nurses would be yelling code blue,” Bloomberg quoted Jeffrey Halley, senior market analyst at forex broker Oanda, as saying.Such headlines could revolve around Coronavirus or China, with Asian stocks down Monday and European indexes looking peaky at the open.U.S. equities hit fresh all-time highs in the run-up to the Christmas break, capping a momentous year in which the S&P 500 alone saw 68 new records.The U.S. dollar, however, is yet to recover its previous intense uptrend, with the U.S. dollar currency index (DXY) treading water into the end of the year. This could provide at least some respite for Bitcoin traders should stocks also benefit.DXY remains near its highest since June 2020.U.S. dollar currency index (DXY) 1-week candle chart. Source: TradingViewBitcoin “melts faces when people least expect it”Bitcoin traders are getting more, not less, fearful as 2021 fades.Related: Top 5 cryptocurrencies to watch this week: BTC, MATIC, NEAR, ATOM, HNTAs per the Crypto Fear & Greed Index, a popular sentiment gauge which factors in a range of variables to produce an overall impression of trader emotions, the market is far from out of the woods — even above $50,000.As of Monday, Fear & Greed stands at 40/100, characterizing “fear,” having hit highs of 45/100 last week.Crypto Fear & Greed Index. Source: Alternative.meThe Index has shown that sentiment has been particularly sensitive to even small price fluctuations since the rout. The implication is therefore that jitters could spark more emotional trading reactions, and a price event could result in a snowball effect up or down.Under normal circumstances, however, a mass capitulation event only occurs during periods of “extreme greed,” in which the Index measures 90/100 or more.Taking a more optimistic tone, meanwhile, Blocksteam CSO Samson Mow argued that most lay market paritcaptans are too gloomy this Christmas.Lots of bearish sentiment in response to my tweet, plus many can’t seem to understand it either (bUt iT WaS 50k a wHiLe aGo), which makes me think we’re going to have some massive green candles soon. #Bitcoin usually melts faces when people least expect it. https://t.co/UiK91ij9Qn— Samson Mow (@Excellion) December 24, 2021

“Bitcoin usually melts faces when people least expect it,” he said during a Twitter discussion.

Čítaj viac

Bitcoin slips under $50K amid warning 'new player' Binance whale is pressuring BTC price

Bitcoin (BTC) lost $50,000 for the first time in several days on Dec. 26 as exchange inflows caught up with the cautiously optimistic mood.BTC/USD 1-hour candle chart (Bitstamp). Source: TradingView”New player” beefs up $50,000 sell wallData from Cointelegraph Markets Pro and TradingView showed volatility hitting BTC/USD overnight on Saturday.The pair had reached $51,500 before starting to retrace, this culminating in a dip to $49,644. At the time of writing, Bitcoin was back circling $50,000.The move came in tandem with a rise in inflows to major exchange Binance, with order book data showing a new wall of resistance being built at $50,000.Binance order book heatmap chart. Source: Material IndicatorsThe behavior points to a large-volume investor shaping market bias, and Binance was already the source of suspicion over such activity in recent days.”This looks like a new player,” data analysis account Material Scientist noted in comments on Binance’s rapidly-changing order book setup. Binance BTC balance chart. Source: CoinglassOverall, exchange balances have crept up 60,000 BTC beginning Dec. 22, from 1.69 million to 1.75 million BTC, data from on-chain monitoring resource Coinglass shows.Ethereum preserves $4,000 defense zoneIn some mild relief for altcoin traders, most large-cap tokens remained relatively unscathed after Bitcoin’s latest dip.Related: Top crypto winners and losers of 2021Ether (ETH) was still above $4,000 at the time of writing. ETH/USD 1-hour candle chart (Bitstamp). Source: TradingViewOthers in the top ten cryptocurrencies by market cap either kept losses below 1.5% or saw flat performance.For ETH/USD, popular trader Pentoshi highlighted $3,940-$4,000 as a “key” area for bulls to defend going forward.”Currently long. Would like to see a push up and some momentum off this rounded bottom. Looking to sell 4.4-4.5k,” he added.

Čítaj viac

Bitcoin battles bears 'on offense' as Christmas delivers a $50K BTC gift

Bitcoin (BTC) held $50,000 into Dec. 25 as BTC bulls avoided an unwelcome Christmas Day surprise. BTC/USD 1-hour candle chart (Bitstamp). Source: TradingView”Bears become bulls” short term?Data from Cointelegraph Markets Pro and TradingView showed BTC/USD maintaining $50,000 support into the weekend, having ranged after local highs above $51,500.The pair was calm as the holiday season got underway, with thinner liquidity yet to show itself in the form of volatile price moves.With most taking a break from trading and analysis, the nearest target to the upside remained the $1 trillion market cap valuation level at $53,000.For popular trader Pentoshi, a point of friction could come in the form of sellers actively driving down BTC/USD to liquidity at $46,000, only to then buy back in for a rebound.”Right now beras on offense. They take price down to 46k but there was a lot of resting liquidity there = stop price from moving. They begin to close shorts and buy some spot back,” he offered as a forecast. “Bears become bulls short term like myself.”BTC/USD scenario chart. Source: Pentoshi/ TwitterFurther out, the yearly close was yet to form a major topic of interest, with Bitcoin nonetheless up $21,000 versus the start of 2021.$100,000 halving cycle average not dead yetTaking stock at the end of the year, meanwhile, was stock-to-flow model creator PlanB. Related: Missed out on hot crypto stocks in 2021? It paid just to buy Bitcoin and Ethereum, data showsHaving attracted fresh criticism over Twitter comments he says were misconstrued, the popular analyst said that Bitcoin was still abiding by his model’s predictions this month.As Cointelegraph reported, stock-to-flow’s parameters provide significant room for maneuver when it comes to spot price, this nonetheless of value to PlanB and others.Ad2 – S2F model intactKey is that BTC $51K is still within 1 standard deviation band of S2F model (roughly $50K-$200K, see chart). If BTC stays within 1sd band for the next 2.5 yrs, then S2F model is still valid and indeed useful for me. Of course you should make your own call. pic.twitter.com/cFpRdewUJ5— PlanB (@100trillionUSD) December 24, 2021While $135,000 this month, a forecast from the newly invalidated floor model, turned out to be overly optimistic, that figure as an average price this halving cycle remains in play.

Čítaj viac

Bitcoin 'Santa rally' pauses at $51.5K as funds bet on a sub-$60K BTC price for January 2022

Bitcoin (BTC) lost momentum at $51,500 on Dec. 24 as traders weighed the odds of a “Santa rally” coming true for Christmas. BTC/USD 1-hour candle chart (Bitstamp). Source: TradingViewBTC sees potent long-term retestData from Cointelegraph Markets Pro and TradingView saw BTC/USD preserve its gains from Thursday, these totalling 6% with resistance most recently kicking in at just above $51,500.Opinions were mixed among weary traders about the strength of the rally and whether it could endure for long.Still in its familiar range despite the overnight uptick, Bitcoin needed to show its muscle on longer timeframes, Cointelegraph reported analysis as saying earlier.For filbfilb, co-founder of trading platform Decentrader, a combination of low funding rates and top traders turning long at the expense of more bearish retail among other triggers served as reason to be more hopeful.Bitcoin; Diag BreakoutTop traders long, normies fading the move up OI up 2.86 bn / 40% Funding low Sitting right below 10x liquidations Happy Christmas. pic.twitter.com/LvRSAN8iTN— filbfilb (@filbfilb) December 24, 2021Trader analyst Rekt Capital meanwhile noted that the reversal currently meant that Bitcoin had “successfully retested” the top of a falling wedge structure in place for much of 2021. BTC/USD had originally broken out of the wedge at the end of September.#BTC has successfully retested the top of the macro Flagging Structure as support$BTC #Crypto #Bitcoin https://t.co/oWwwzblc90 pic.twitter.com/brm5rVDyfd— Rekt Capital (@rektcapital) December 24, 2021

Data from the research arm of derivatives exchange Deribit added that funds were getting more bullish about a Bitcoin price in the mid-$50,000s in January.”Additional funds jumping into the NewYear play,” the firm tweeted Friday. “This time, refocus on BTC, as one large Fund buys a strip of Jan14 52-56k Calls x1200 around 49.5k spot, just before spike >50k.”At press time, BTC/USD stood at just under $51,000.$4,000 ETH returnsBitcoin managed to post stronger daily gains than Ether (ETH) on the day as the largest altcoin nonetheless returned above $4,000.Related: Bitcoin needs to clear $51K to reduce the chance of new sell-off from BTC whalesThe top ten cryptocurrencies by market cap were firmly in the green, led by ongoing success for Terra’s LUNA token.The exception was a flat XRP, which had nonetheless staged its own rally earlier in the week.ETH/USD 1-hour candle chart (Bitstamp). Source: TradingView”And just like that, people want to buy altcoins again,” Cointelegraph contributor Michaël van de Poppe summarized.

Čítaj viac

Získaj BONUS 8 € v Bitcoinoch

nakup bitcoin z karty

Registrácia Binance

Burza Binance

Aktuálne kurzy