Autor Cointelegraph By William Suberg

Bitcoin returns to $42K as bets start favoring ‘short squeeze’ higher for BTC

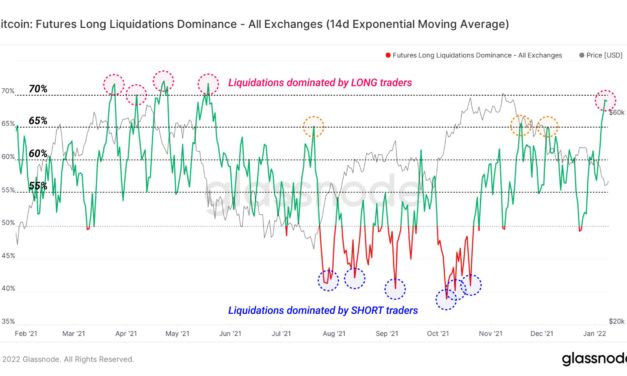
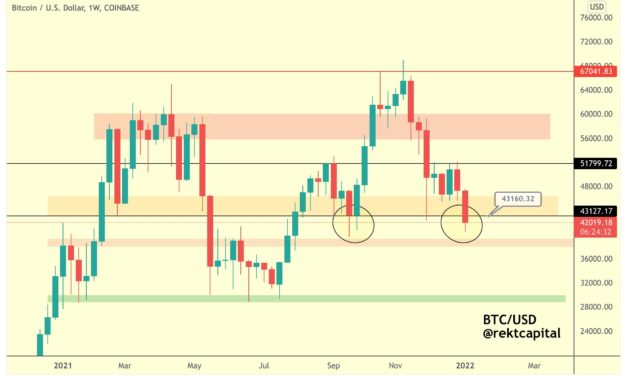
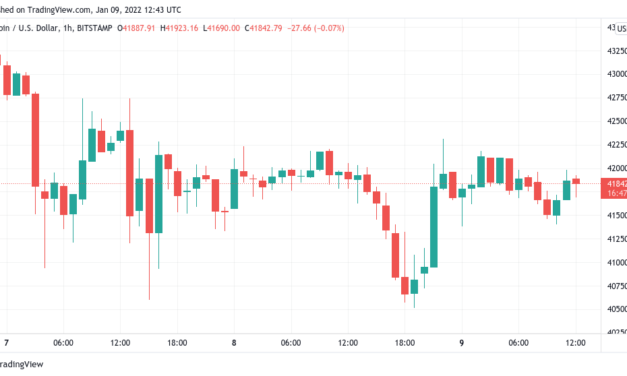
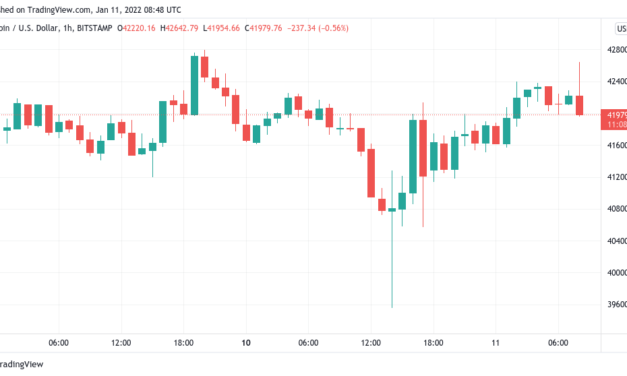
Bitcoin (BTC) broke through $42,000 on Jan. 11 as expectations of a fresh “short squeeze” mounted.BTC/USD 1-hour candle chart (Bitstamp). Source: TradingViewShort-term squeeze “reasonably likely”Data from Cointelegraph Markets Pro and TradingView followed BTC/USD as it recovered from Monday’s dip to $39,600 — its first breach of the $40,000 mark since September.While short-term bullish prognoses were conspicuously absent on the day, attention focused on the potential for derivatives markets to spark another “short squeeze.”With open interest near all-time highs despite the downturn and sentiment clearly favoring further downside, a surprise uptick could have the impact of “squeezing” short positions and providing some relief for bulls.As on-chain analytics firm Glassnode noted in the latest edition of its weekly newsletter, “The Week On-Chain,” such an event is overdue. Longs have suffered almost constantly since November’s $69,000 all-time highs, and “squeezes” further occur when the market least expects a certain outcome.“Short traders, who have not been punished for taking on increasing risk, may find themselves candidates for a near-term squeeze,” researchers forecast.Such an event could well be amplified thanks to “tepid” demand for spot BTC and futures open interest leverage, which is approaching 2% of the Bitcoin market capitalization, Glassnode continued.“Alongside very oversold indicators in on-chain spending activity, this suggests a short squeeze is actually a reasonably likely near-term resolution for the market,” the newsletter concluded. Bitcoin futures open interest leverage ratio annotated chart. Source: GlassnodeFor every short, there’s a longAnalysts, meanwhile, considered alternatives to the high open interest being removed via another leg down toward $30,000.Related: ‘Most bullish macro backdrop in 75 years’ — 5 things to watch in Bitcoin this weekDespite no “wipeout” of open interest yet occurring, a surprise upside move could yet be the event that resets market composition, popular Twitter account Credible Crypto argued on the day.“What if the major OI wipeout everyone is looking for ends up happening because of a squeeze to the upside rather than a move further down?” he quizzed in response to data from fellow analyst William Clemente. “Happened in August ‘21 as we moved off the 30K bottom. Think we probs see that play out again. Bears bout to be wiped clean.”Bitcoin futures open interest chart (Binance). Source: CoinglassAs Cointelegraph reported, $40,000 has been forming a significant price zone from multiple points over the past 12 months.

Čítaj viac

Bitcoin drops below $40K for first time in 3 months as fear set to 'accelerate'

Bitcoin (BTC) fell below the landmark $40,000 mark for the first time since September 2021 on Jan. 10, heightening a rout that began six weeks ago.BTC/USD 1-hour candle chart (Bitstamp). Source: TradingViewBollinger bands step inData from Cointelegraph Markets Pro and TradingView showed BTC/USD encountering predictable volatility as bears finally steered the market back into the $30,000 zone.The move had been long preempted, with forecasts even calling for an identical floor to that of July — just below $30,000.”And we’re dipping into the $40K region for Bitcoin, through which the fear will only accelerate even more,” Cointelegraph contributor Michaël van de Poppe reacted.For trader and analyst Rekt Capital, the first point of support lay in the lower of the two Bollinger Bands for BTC/USD, with spot price now “very close.”#BTC Getting very close now$BTC #Crypto #Bitcoin pic.twitter.com/1uCyCN57T9— Rekt Capital (@rektcapital) January 10, 2022Fellow trader and analyst Scott Melker meanwhile highlighted the appearance of increasing bullish divergences due to those who have longed BTC at $39,800.”People are considering selling off partially at this stage, as they expect markets to drop further,” Van de Poppe added in further comments. “Next to that, most of the people are assuming we’re only going down, as a bear thesis is currently the primary scenario.”At the time of writing, Bitcoin was back above $40,000 as the market attempted to find local support.Ethereum loses $3,000 mark as liquidations mountLooking at exchanges, data from on-chain analytics resource Coinglass showed liquidations hitting $120 million in a single hour across crypto pairs.Related: Bitcoin batters longs as liquidations copy May 2021 run to $30,000Bitcoin accounted for around one third of the tally, with total BTC liquidations in the past 24 hours nearing $90 million.Bitcoin exchange liquidations chart. Source: CoinglassAltcoins meanwhile joined in the modest panic, with Ether (ETH) dropping below $3,000 for the first time since early October.ETH/USD 1-day candle chart (Bitstamp). Source: TradingViewOthers in the top ten cryptocurrencies by market cap shed upwards of 5% on the day, as the bearish atmosphere spread.

Čítaj viac

Bitcoin batters longs as liquidations copy May 2021 run to $30,000

Bitcoin (BTC) has dealt significant pain to bulls in recent weeks, and now, fresh data shows just how much.In a tweet on Jan. 10, on-chain analytics firm Glassnode revealed that those longing BTC had suffered a rerun of last May, when BTC/USD began to fall toward $30,000.Long traders fail to “catch the knife”According to Glassnode’s Longs Liquidations Dominance metric, the “majority” of liquidations over the new year involved longs.This is unsurprising, given Bitcoin’s overall trajectory since late November, but the extent of losses puts the past few weeks on par with May in terms of longs vs. shorts.“Bitcoin long liquidation dominance has hit 69%, the highest level since the May 2021 deleveraging event,” researchers commented. “This means that the majority of liquidations in futures markets over recent weeks were long traders attempting to catch the knife.”Bitcoin futures long liquidations dominance annotated chart. Source: Glassnode/TwitterLooking at the data, the period from late July through late November saw the opposite trend form, with shorters becoming victims of an unexpected bull run multiple times.Unusual lowsWhile long liquidation spikes do not always mark local price bottoms, the appetite for a turnaround on short timeframes has long been vocal. Related: ‘Most bullish macro backdrop in 75 years’ — 5 things to watch in Bitcoin this weekBitcoin, as Cointelegraph reported, is firmly “oversold” by historical standards at current prices.“If we bounce here, I’m not convinced we won’t revisit these prices, but some short-term relief would be nice,” quant analyst Benjamin Cowen tweeted Saturday as part of intraday observations.“Daily RSI is also technically oversold, $40k-$42k is theoretically a support area too.”Cowen was commenting on the Crypto Fear & Greed Index, which hit rare lows of just 10/100 over the weekend, signifying “extreme fear” among market participants.Since bottoming out in the depths of 2018 depression, $BTC has only seen this oversold indicators only four times at 3k, 10k, 4k, and 30k. Not long after these records were achieved, #Bitcoin rallied 340%, 17%, 1585%, 141% accordingly. Full details: https://t.co/qtlKY9tQzS pic.twitter.com/oSpb3fTjKX— CRYPTO₿IRB (@crypto_birb) January 8, 2022Such occurrences tend to be followed by a price and sentiment recovery, but current lows are poignant, as the same price level one year ago was accompanied by the opposite phenomenon — 93/100 or “extreme greed.”

Čítaj viac

'Most bullish macro backdrop in 75 years' — 5 things to watch in Bitcoin this week

Bitcoin (BTC) starts a new week in a strange place — one which is eerily similar to where it was this time last year.After what various sources have described as an entire twelve months of “consolidation,” BTC/USD is around $42,000 — almost exactly where it was in week two of January 2021.The ups and downs in between have been significant, but essentially, Bitcoin remains in the midst of a now familiar range.The outlook varies depending on the perspective — some believe that new all-time highs are more than possible this year, while others are calling for many more consolidatory months.With crypto sentiment at some of its lowest levels in history, Cointelegraph takes a look at what could change the status quo on shorter timeframes in the coming days.Will $40,700 hold?Bitcoin saw a trying weekend as the latest in a series of abrupt downward moves saw $40,000 support inch closer.Data from Cointelegraph Markets Pro and TradingView showed BTC/USD hitting $40,700 on major exchanges before bouncing, a correction which has since held.Ironically, it was that very level which was in focus on the same day in 2021, that nonetheless coming during what turned out to be the more vertical phase of Bitcoin’s recent bull run.Last September also returned the focus to $40,700, which acted as a turning point after several weeks of correction and ultimately saw BTC/USD climb to $69,000 all-time highs.Now, however, the chances of a breakdown to the $30,000 zone are unreservedly higher among analysts.“Weekly Close is just around the corner,” Rekt Capital summarized alongside a chart with target levels. “Theoretically, there is a chance that $BTC could perform a Weekly Close above ~$43200 (black) to enjoy a green week next week. Weekly Close under ~$43200 however & BTC could revisit the red area below.”BTC/USD annotated candle chart. Source: Rekt Capital/ TwitterBitcoin ultimately closed at $42,000, since hovering at around that level in what could turn out to be some temporary relief for bulls.“I think market puts in a lower high,” fellow trader and analyst Pentoshi forecast, adding that he believes $40,700 will ultimately fall.An increasingly alluring target, meanwhile, lies at last summer’s $30,000 floor.Consensus forms over dire outlook for cashThe macro picture this week is particularly complicated for risk asset fans, with Bitcoin and altcoins no exception.What the future holds, however, varies considerably from one pundit to another.The United States Federal Reserve is broadly seen to start raising interest rates in the coming months, this making investors de-risk and causing a headache for crypto bulls. “Easy money,” which began flowing in March 2020, will now be much harder to come by.The bearish viewpoint was summarized neatly by ex-BitMEX CEO, Arthur Hayes, in his latest blog post last week.“Let’s forget what non-crypto investors believe; my read on the sentiment of crypto investors is that they naively believe network and user growth fundamentals of the entire complex will allow crypto assets to continue their upward trajectory unabated,” he wrote. “To me, this presents the setup for a severe washout, as the pernicious effects of rising interest rates on future cash flows will likely prompt speculators and investors at the margin to dump or severely reduce their crypto holdings.”This week sees the U.S. consumer price index (CPI) data for December released, numbers which will likely feed into the story of surprise inflation gains.Hayes is far from alone in worrying over what the Fed may bring to crypto this year, with Pentoshi among others likewise calling a temporary end to the bull run.“And the final question is, can crypto ignore the Fed if it decides to go all out wielding a deflationary machete? I doubt it,” analyst Alex Krueger concluded in a series of tweets on the issue this weekend. “‘Don’t fight the Fed’ applies both ways, up and down. If the Fed is *too hawkish* then Houston, we have a problem.”There were some optimists left in the room. Dan Tapiero, Founder and CEO of 10T Holdings, told followers to “ignore” the recent rout and focus on an unchanged long-term investment opportunity.“Most bullish macro backdrop in 75 years,” he said. “Booming economy supported by massive negative real rates. Fed will never equalize rates with inflation. Stay long stocks and Bitcoin and ETH. Hodl through short term volatility. Real Dollar cash savings will continue to lose value.”Here’s a look at the Effective Fed Funds Rate and Inflation Rates when the Unemployment Rate was at 3.9%, as it is today.Find the outlier… pic.twitter.com/zU1zRj1uXC— Charlie Bilello (@charliebilello) January 7, 2022Tapiero highlighted data compiled by Charlie Bilello, founder and CEO of Compound Capital Advisors.RSI hits two-year lowsAmid the gloom, not everything is pointing to a protracted bearish phase for Bitcoin specifically.As Cointelegraph has been reporting, on-chain indicators are calling for upside in droves — and historical context serves to support those demands.This week, it’s Bitcoin’s relative strength index (RSI) which continues to headline, reaching its lowest levels in two years.#Bitcoin RSI has been this low just 2 other times in the last 2 years. Looks like a bottom is near and bounce due. Let’s see pic.twitter.com/qhQ1pD8yEl— Bitcoin Archive (@BTC_Archive) January 9, 2022

RSI is a key metric used to determine whether an asset is “overbought” or “oversold” at a given price point.Plumbing the depths at $42,000 suggests that such a level really is considered too extreme by the market, and a rebound should occur to balance it. By contrast, last January, RSI was sky high and conversely well within “overbought” territory, while BTC/USD traded at the same price.“The Bitcoin RSI is on the lowest point in 2 years on the daily. March 2020 & May 2021 were the last ones. And people flip bearish here / want to short,” a hopeful Cointelegraph contributor Michaël van de Poppe commented.BTC/USD 1-day candle chart (Bitstamp) with RSI. Source: TradingViewCointelegraph noted similarly bullish hints on the monthly RSI chart last week.Hash rate recoups Kazakhstan lossesAnother blip from last week already “curing itself” comes from the realm of Bitcoin fundamentals. After hitting new all-time highs throughout recent weeks, Bitcoin’s network hash rate took a hit when turbulence in Kazakhstan comprised internet availability.Kazakhstan, home to around 18% of hash rate, has since stabilized, allowing the hash rate to mostly return to prior levels of 192 exahashes per second (EH/s).At one point down to 171 EH/s, responses to what may have reminded some of last May’s China mining ban appear to have lifted hash rate and preserved record-breaking miner participation.Bitcoin’s network difficulty, despite the upheaval, still managed to put in a modest increase this weekend and is currently on track to do so again at its next automated readjustment in just under two weeks.Live Bitcoin hash rate chart screenshot. Source: MiningPoolStats“Going up forever,” on-chain analyst Dylan LeClair commented about the classic mantra, “price follows hash rate.”For context, China’s mining rout caused hash rate to decline by 50%. It took around six months to recoup the losses.“What if…?”Someone who has long been saying that it’s high time for a Bitcoin trend reversal is quant analyst PlanB, creator of the stock-to-flow-based BTC price models.Related: Top 5 cryptocurrencies to watch this week: BTC, LINK, ICP, LEO, ONECurrently weathering a test of his creations — and the accompanying storm of social media criticism — PlanB nonetheless remains more optimistic than most when it comes to mid to long-term price action.“I know some people have lost faith in this bitcoin bull market,” he acknowledged this weekend. “However we are only halfway into the cycle (2020-2024). And although BTC experiences some turbulence at $1T, the yellow gold cluster at S2F60/$10T (small black dots are 2009-2021 gold data) is still the target IMO.”Stock-to-flow cross-asset (S2FX) chart. Source: PlanB/ TwitterHe was referring to the stock-to-flow value for Bitcoin, gold and other assets as part of his stock-to-flow cross-asset (S2FX) model, which calls for an average BTC/USD price of $288,000 during the current halving cycle.Closer to home, however, a more simplified comparison between Bitcoin this cycle and its two previous ones saw a feasible trajectory beginning with a U-turn now. What if … pic.twitter.com/te36HkFAbQ— PlanB (@100trillionUSD) January 9, 2022

A separate model, the floor model, which demanded $135,000 per bitcoin by the end of December, has now been discarded after failing to hit its target for the first time ever in November.

Čítaj viac

Bitcoin performs classic bounce at $40.7K as BTC price comes full circle from January 2021

Bitcoin (BTC) bounced off what is for some a key level on Jan. 9, closely mimicking events from September 2021. BTC/USD 1-hour candle chart (Bitstamp). Source: TradingView”Shorters will get rekt” at $40,700Data from Cointelegraph Markets Pro and TradingView showed BTC/USD reversing course at around $40,700 to subsequently pass $42,000.The behavior, while uninspiring for some, firmly reminded others of Bitcoin price behavior at the end of September, when $40,700 acted as a springboard which ultimately produced $69,000 all-time highs seven weeks later.History and Context 40.7k $BTC https://t.co/LqlkxxJ0BF pic.twitter.com/neJlH6mnmN— Pentoshi DM’S ARE SCAMS (@Pentosh1) January 8, 2022″Months have passed since September. And yet, BTC finds itself in the same situation, macro-wise,” trader and analyst Rekt Capital commented. “Still consolidating inside its macro Re-Accumulation range. In fact, $BTC is almost at the very same price point at which BTC bottomed on the September retrace.” Macro commentaries regarding stricter economic policy from the United States Federal Reserve meanwhile continued.As last week, concerns focused on crypto markets’ ability to thrive in an atmosphere without the extent of “easy money” availability, which has characterized the economy since March 2020.”Crypto diehards about to find out if it really was bubble: Rock-bottom rates & trillions of dollars in CenBank money & govt stimmy helped turbocharge prices of digital assets,” markets pundit Holger Zschaepitz argued in a recent Twitter post. “Can mkt hold up w/o them? Bitcoin on course $40k w/flat CenBank balance sheets.”BTC/USD vs. central bank balance sheet chart. Source: Holger Zschaepitz/ TwitterWhat difference a year makesFurther similarities came in the form of BTC/USD exactly matching its position from the same day one year ago Saturday. A key difference, however, lay in sentiment.Related: Will this time be different? Bitcoin eyes drop to $35K as BTC price paints ‘death cross’On January 8, 2021, the Crypto Fear & Greed Index stood at 93/100, flashing a warning that a local top should soon arrive and that the market had entered “extreme greed.” By contrast, this Saturday scored just 10/100 — one of the Index’s lowest-ever readings deep within “extreme fear” territory.Crypto Fear & Greed Index. Source: Alternative.me”BTC Bulls are getting fearful. BTC Bears are getting greedy. Food for thought,” Rekt Capital added.

Čítaj viac

Získaj BONUS 8 € v Bitcoinoch

nakup bitcoin z karty

Registrácia Binance

Burza Binance

Aktuálne kurzy