Autor Cointelegraph By William Suberg

Bitcoin holds onto 10% gains ahead of crucial Fed rate hike comments

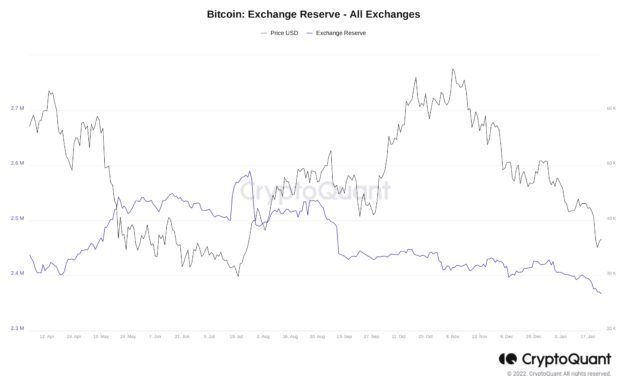
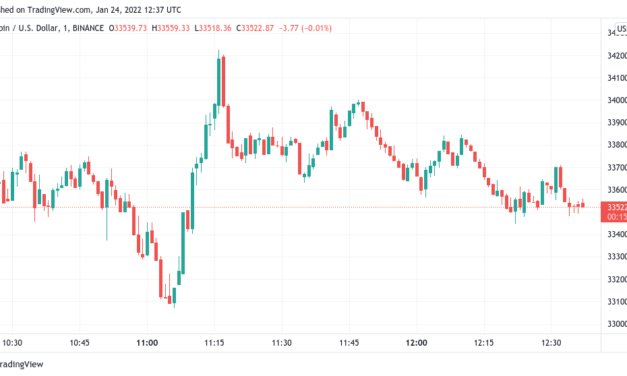
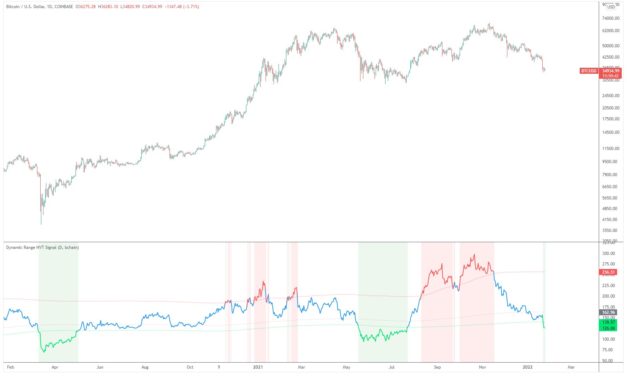
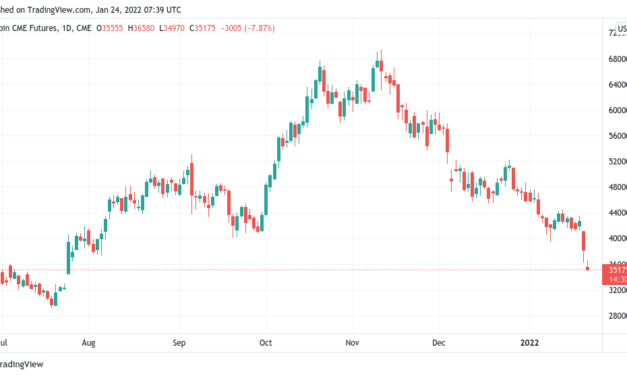
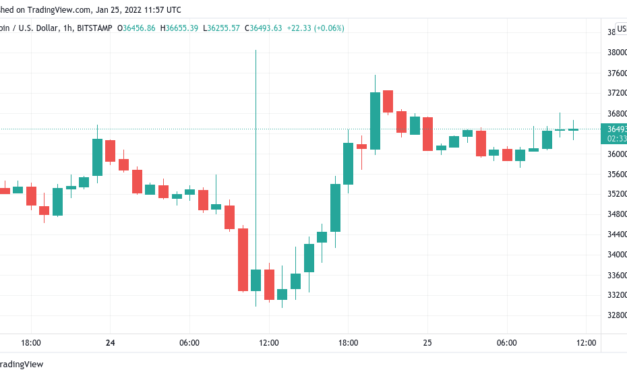
Bitcoin (BTC) held onto fresh upside on Tuesday after a resurgent stock market took the largest cryptocurrency above $37,500.BTC/USD 1-hour candle chart (Bitstamp). Source: TradingView.Fed may spark fresh volatilityData from Cointelegraph Markets Pro and TradingView showed BTC/USD trading above $36,000 on Tuesday, with maximum 24-hour gains totaling 14% versus Monday’s floor. Bitcoin’s correlation to equities remained in focus ahead of a fresh Wall Street open and key information regarding interest rates from the United States Federal Reserve.The Fed’s Federal Open Market Committee (FOMC) is set to meet Wednesday, and any news regarding interest rates could have instant repercussions for both traditional and crypto markets.“Tomorrow’s FED FOMC meeting could mean that we will see lots of volatility this week,” Cointelegraph contributor Michaël van de Poppe forecasts.Rate hikes are planned to be the follow-on from the Fed’s asset purchase tapering, with Bitcoin sentiment taking a hit in advance as the end of “easy” liquidity nears.Asset purchases should conclude by March, however, and the Fed has said that the rate hikes should not come before then.“Price reversion in cryptos is likely to spread in 2022, after the assets were a poster child of speculative inflationary excess in 2021, but Bitcoin stands to come out ahead,” Mike McGlone, chief commodity strategist at Bloomberg Intelligence, summarized in a hopeful outlook for BTC.“Correlations are heading toward 1-to-1.”BTC/USD vs. S&P 500 correlation chart. Source: Mike McGlone/TwitterEarlier this month, McGlone said that Bitcoin could rebound stronger than stocks once they see a long-overdue correction of up to 20%. Now, he added that altcoins would likely fail to put in as solid a comeback.Major altcoins wipe out earlier fallOn the topic of altcoins, these nonetheless put in a solid performance on the day, with Ether (ETH) matching Bitcoin’s advance.Related: ‘Stop panic selling’ — Bitcoin whales bag spare BTC as exchange balances fallETH/USD was up 7.3% at the time of writing, trading at $2,420, having previously hit lows of $2,160 — its worst since mid-July.ETH/USD 1-hour candle chart (Bitstamp). Source: TradingView.Something of a V-shape recovery was also noticeable on other large-cap altcoins, including Binance Coin (BNB) and Solana (SOL).“The good part is that we’re getting closer and closer to the next impulse rally on altcoins as most of them have been retracing fully,” van de Poppe argued before the rally.

Čítaj viac

'Stop panic selling' — Bitcoin whales bag spare BTC as exchange balances fall

Bitcoin (BTC) is being aggressively bought up at prices near $30,000 as bidders begin to soak up liquidity from short-term sellers.Data from on-chain monitoring resource CryptoQuant shows that as of late December, Bitcoin exchanges have begun to shed their BTC reserves once more.BTC conspicuously attractive at current levelsAfter a period of traders sending BTC to exchanges, possibly to sell or to have on the side to divest away from further losses, exchanges are now seeing larger overall outflows than inflows.Between Dec. 7 and Dec. 28, 2021, BTC reserves of the 21 major platforms monitored by CryptoQuant increased from 2.396 million to 2.428 million BTC.Thereafter, the longer-term downtrend resumed, and as of Monday, exchanges’ tally stood at 2.366 million BTC — despite spot price action sitting at six-month lows.Bitcoin exchange reserves vs. BTC/USD chart. Source: CryptoQuantOlder whales, meanwhile, despite showing some impatience in recent years, are still apt to spark price trend reversals, CryptoQuant CEO Ki Young Ju believes.”It seems they have been sold $BTC to new players at the tops or bottoms,” he said in a series of tweets about the topic, noting that institutions have likely been the main buyers since 2020.Whales go for (another) dipWhile common knowledge, the exchange balance trend now coincides with palpable on-chain demand from major investors.Related: Illiquid supply ‘going up relentlessly’ — 5 things to watch in Bitcoin this weekAs noted by Twitter account CC15Capital this week, the run to $33,000 was accompanied by multi-million-dollar BTC buy-ins from one wallet in particular.Since August, the account has amassed over $1 billion worth of BTC from a starting balance of zero.https://t.co/TqcYo2Mkw2— CC15Capital (@Capital15C) January 25, 2022The phenomenon further comes amid firm resolve from long-term holders not to sell. As Cointelegraph reported, coins that have not moved in a year or more now make up 60% of the overall BTC supply.Whale accumulation, meanwhile, has been apparent elsewhere in the period following the comedown from $69,000 all-time highs.

Čítaj viac

Bitcoin dives below $33K to fill futures gap amid record BTC ‘hodling’

Bitcoin (BTC) set new multi-month lows on Jan. 24 as the new week began with some classic price behavior.BTC/USD 1-minute candle chart (Binance). Source: TradingView“Rangeplay” for BTC after CME gap fillData from Cointelegraph Markets Pro and TradingView showed BTC/USD dipping to $32,967 on Bitstamp prior to the Wall Street open Monday.That level represented the start of a CME futures gap left over from July 2021, Bitcoin “filling” it almost to the dollar before reversing upwards to add over $1,000 in minutes.With volatility clearly in the air, expectations were running high for the start of trading on United States equities markets.Weekends are scams. (Low volume markets)— Adam Back (@adam3us) January 23, 2022“Now, Bitcoin will fight $34.1-34.4K. If that reclaims, potential test at $38K possible,” Cointelegraph contributor Michaël van de Poppe summarized to Twitter followers, noting the CME gap closure. “Rangeplay at this point.”At the time of writing, BTC/USD traded just below $34,000, with aroud an hour and a hal until the U.S. open.Zooming out, investor behavior meanwhile appeared to counter concerns over short-term sellers. As noted by investor and entrepreneur Alistair Milne, the proportion of the Bitcoin supply that has remained stationary for a year or more hit levels not seen during previous capitulation events.The % of #Bitcoin unmoved for 12 months or more just hit 60%… which is higher than after the March 2020 COVID crash… higher than at the end of the 2015/16 bear market… higher than at the end of the 2018/19 bear market/end transmission— Alistair Milne (@alistairmilne) January 24, 2022

Even beating the 2018 bear market bottom, when Bitcoin reached $3,100 after a drawdown of over 80%, current resolve among long-term investors was thus palpable.HODL Waves data from on-chain analytics firm Glassnode confirmed the presence of active hodlers.Bitcoin HODL Waves chart (screenshot). Source: Unchained CapitalEther attracts $1,800 bid targetThe situation looked bleaker for major altcoins on the day, as Ether (ETH) shed almost 11% to near $2,000.Related: Bitcoin ‘enters value zone’ as BTC price floor metric goes green againThe largest altcoin by market cap was not alone in its precipitous fall, the top 10 led by Solana (SOL), down almost 18% at the time of writing. For popular trader and analyst Pentoshi, bid levels to watch now lay below $2,000 support — more than 60% under recent all-time highs”$ETHto me is a great buy at $1800 and I still believe in time we get there,” he said Sunday, adding a SOL/USD target of $40 as a “fair target.”ETH/USD 1-hour candle chart (Bitstamp). Source: TradingView.

Čítaj viac

Bitcoin ‘enters value zone’ as BTC price floor metric goes green again

Bitcoin (BTC) has just reentered a key price zone which has signalled the beginning of the end for bear phases, data confirms.In a tweet on Jan. 24, Charles Edwards, founder of crypto investment firm Capriole, flagged Bitcoin’s network value to transaction (NVT) ratio metric as it delivered a new and rare “oversold” signal.NVT says it’s reversal timeBitcoin price losses accelerated over the weekend, with the market not far off a retest of the seminal $30,000 mark prior to Monday’s Wall Street open.Nonetheless, for on-chain analysts, there are plenty of reasons to believe that the extent of losses seen recently is more of a market overreaction than a taste of things to come.Supporting that thesis is NVT, which calculates how overbought or oversold Bitcoin really is. NVT, first developed by statistician Willy Woo and entrepreneur Dmitry Kalichkin, uses the ratio of Bitcoin’s market capitalization to its daily on-chain transaction value to create an idea of whether price behavior really corresponds to on-chain activity. Edwards subsequently tweaked the metric by adding standard deviation bands to account for natural changes in on-chain behavior as Bitcoin matures. The result was the so-called “dynamic range NVT,” and it is this incarnation which returned to its green zone this weekOver the past two years, only summer 2021 — the post-China mining ban period — and the coronavirus crash of March 2020 have produced such NVT behavior.”Valuing the Bitcoin network based on transaction value throughput suggests we have entered the value zone,” Edwards commented on Twitter alongside a print of NVT’s latest movements.Bitcoin dynamic range NVT vs. BTC/USD chart. Source: Charles Edwards/ Twitter“People have short memories”Back on the spot market, others called into question the veracity of recent losses, even with BTC/USD briefly exceeding -50% versus November’s all-time highs.Related: Illiquid supply ‘going up relentlessly’ — 5 things to watch in Bitcoin this weekWith two months being all that was required for some balances to halve, trader, analyst and podcast host Scott Melker, known as the “Wolf of All Streets,” reminded followers that this is nothing new for Bitcoin.”People have short memories. In May, Bitcoin went from 60K to 30K in 10 DAYS! 10 DAYS,” he tweeted.”That was much more aggressive, on much higher volume, and was only 8 months ago. We’ve been here before.”BTC/USD 1-day candle chart (Bitstamp) showing May 2021 decline. Source: TradingViewAs such, when it comes to kneejerk reactions from crypto markets, the current drawdown, in Melker’s eyes, is unremarkable. Sentiment, meanwhile, has been at or near the bottom of its historical range for several weeks.

Čítaj viac

Illiquid supply 'going up relentlessly' — 5 things to watch in Bitcoin this week

Bitcoin (BTC) is starting the final week of January in a place no one wanted but many warned about — a 50% drawdown from all-time highs.A flight to $34,000 means that BTC/USD is now down by half in just two months, and perhaps naturally, concerns are that the losses could continue.With $30,000 so far unchallenged, Bitcoin remains slightly above the trough of its dip from $58,000 to $29,000 last summer.With macro markets facing a tough time of their own thanks to rapidly-changing Federal Reserve policy, crypto holders will be eyeing their coins’ correlation to traditional assets going forward. Can Bitcoin break the trend?So far, there are few signs that a significant rebound is on the cards, but below the headlines, not all is as it seems when it comes to Bitcoin’s strength.Cointelegraph presents a look at five areas worth taking note of this week when assessing what could be next for BTC price action.Bitcoin nears a “generational bottom”Bitcoin bears took no notice of out-of-hours trading on Wall Street with the weekend ushering in a new round of losses.From $39,000 to current lows of $34,000, BTC showed no mercy as liquidations mounted and sentiment took a fresh beating.Now, traders are naturally eyeing a test of $30,000 as a more definitive representation of how Bitcoin is likely to fare in the short to mid-term.Other estimates for where some relief may occur previously lay at $33,000 and $31,500, these likewise yet to be reached.Analyzing various aspects of the on-chain situation, Dylan LeClair, senior analyst at UTXO Management, highlighted Bitcoin’s current cost basis as a potential clue for what he calls a “generational bottom.”Cost basis refers to the aggregate price at which bitcoins from various cohorts of investors were last moved. The calculation, when combined with other data, can give an insight into where a Bitcoin bear phase is likely to bottom out.Currently, the network cost basis is $24,000. The ratio of cost basis to price, known as the market value to realized value (MVRV) ratio, likewise has further room to fall before putting in a classic floor signal of its own.The current MVRV ratio is in the 38th percentile of historical readings.In the past $BTC dips below realized price (MVRV below 1.0) have served as generational buying opportunities. It’s anyones guess if we get to 24k, but it would certainly be extremely attractive to buy.8/ pic.twitter.com/sW35OEt0I4— Dylan LeClair (@DylanLeClair_) January 24, 2022Closer to home and a familiar target for BTC/USD is emerging in the form of a CME futures gap.While a wick to just above $36,000 on Friday spoiled the opportunity for Bitcoin to reclaim levels closer to $40,000 as part of a “gap fill,” a lower gap from July remains at around $32,000.“The actual price action will happen at the start of the new week, when futures open and CME starts to trade,” Cointelegraph contributor Michaël van de Poppe forecast.CME Bitcoin futures 1-day candle chart. Source: TradingViewFutures “gaps” refer to the empty space on CME Group’s futures chart between the end of trading on Friday and the start on the following Monday. If spot price moves in the intervening period, it has a habit of returning to “fill in” the gap, this often occurs within days or even hours.Spotlight on RSIOver the weekend, Cointelegraph reported on Bitcoin’s daily relative strength index (RSI) metric nearing its lowest levels since the coronavirus crash of March 2020.Well below even its classic “oversold” zone, RSI is now becoming one of the most convincing signals for analysts keen to put faith in a market rebound.Bitcoin daily RSI at its lowest since March 12th, 2020 (covid crash)— Will Clemente (@WClementeIII) January 22, 2022

Not just daily, but weekly RSI is now de facto back where it dipped to almost two years ago. Thereafter, those who followed it profited big, as the next year saw practically unbridled BTC price gains.RSI refers to how overbought or oversold an asset is at a given price point, and the current low readings thus lend weight to the idea that $35,000 does not accurately reflect Bitcoin’s value.For popular Twitter trader and analyst TechDev, the numbers stack up, with RSI on the weekly chart within a hair of classic reversal zones from earlier in Bitcoin’s history.Current #BTC weekly RSI: 37All bear bottoms: 29-35March 2020 crash: 35Closer to a bottom than a top imo. GN all. pic.twitter.com/MzyLNnJ6IT— TechDev (@TechDev_52) January 23, 2022

“Monthly RSI approaching levels that have been historically some of the best buying opportunities in its entire history,” fellow analyst Matthew Hyland added alongside a chart of his own.Bitcoin monthly RSI vs. BTC/USD annotated chart. Source: Matthew Hyland/ TwitterOn both higher and lower timeframes, Bitcoin RSI is therefore hinting that current price levels are unsustainable.Miners hold firm… so farAnother phenomenon which could be subtly flagging $35,000 Bitcoin as a red herring is that of miner selling — or lack of it.At 50% below all-time highs, BTC/USD is now within major estimates of global production costs for mining a single bitcoin.These range from around $34,000, as Cointelegraph reported, to $38,000, according to recent estimates, including that from crypto merchant bank Galaxy Digital.Looking at data covering movements from mining pools and known miner wallets, however, it appears that despite presumably low or even negative profit margins, miners are in no mood to sell their BTC holdings.A significant accumulation trend which began last year thus shows no sign of reversing — yet.Miners are not selling #Bitcoin Do they know something we don’t…? #BTC pic.twitter.com/csaE5y6hQJ— Plan©️ (@TheRealPlanC) January 22, 2022

Nonetheless, not everyone is convinced that the status quo can weather the storm if spot price action continues to decline.“The worst dumps #Bitcoin ever had were due to miners capitulation (Dec 2018, Mar 2020), when BTC fell below production costs, it is at risk for miner capitulation,” popular Twitter account Venturefounder reiterated over the weekend. “BTC was at risk for miner capitulation at $30k in June and at risk now again at $34k.”He included the latest incarnation of the Bitcoin production cost indicator from Charles Edwards, CEO of crypto investment firm Capriole.Bitcoin production cost vs. BTC/USD chart. Source: Venturefounder/ TwitterIlliquid supply keeps growingWhile concerns focus on whether or not certain cohorts of Bitcoin market participants will sell and at what price, it pays to zoom out, one analyst says.Analyzing the overall BTC supply at the weekend, Lex Moskovski, CIO of Moskovski Capital, drew attention to the ongoing trend of coins becoming ever more inaccessible. Spot price moves aside, more and more of the supply is being siphoned off to cold storage, accompanying data from Glassnode shows.In January, despite the downtrend, the conversion of Bitcoin to illiquid actually accelerated, underscoring the desire from investors to buy at price levels seen over recent weeks. Selling, it would seem, is the last thing on their minds.”Panic if you feel like it but Bitcoin illiquid supply is going up relentlessly,” Moskovski forecast.Bitcoin illiquid supply vs. BTC/USD annotated chart. Source: Lex Moskovski/ TwitterAt the start of this month, Glassnode estimated that 76% of the supply was already illiquid. In December, approximately 100,000 BTC was becoming illiquid each month, additional findings claimed.”The only thing that is noise is the summer dip,” Moskovski added about the supply upheaval which followed last May’s miner relocation event.Sentiment index a hair from historic lowsWith all the downside, it is likely unsurprising that Bitcoin market sentiment is not performing well.Related: Top 5 cryptocurrencies to watch this week: BTC, LUNA, ATOM, ACH*, FTMAccording to the latest data from the Crypto Fear & Greed Index, “extreme fear” just keeps getting worse in line with spot price performance.Earlier in the month, Cointelegraph reported on the Index reaching lows seen only a handful of times in history, and with the weekend seeing a return to those levels, the doom being felt by the average market participant is becoming all the more clear.Current levels of around 10/100 have in the past proven to be excellent buying points based on sentiment alone, with Bitcoin settling there in both March 2020 and the pit of its 2018 bear market. Crypto Fear & Greed Index (screenshot). Source: Alternative.me

Čítaj viac

Získaj BONUS 8 € v Bitcoinoch

nakup bitcoin z karty

Registrácia Binance

Burza Binance

Aktuálne kurzy