Autor Cointelegraph By William Suberg

Bitcoin analysts fear new BTC price dip as funding rates drop post Fed

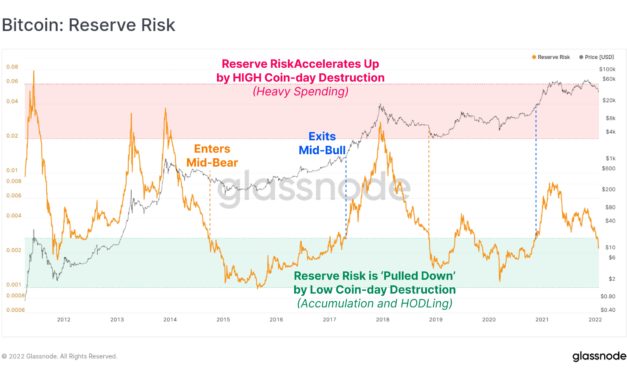
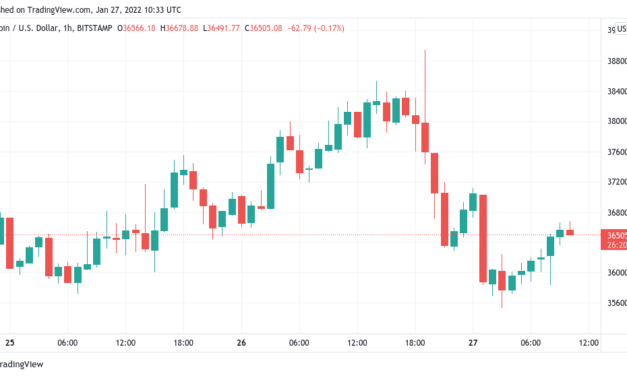
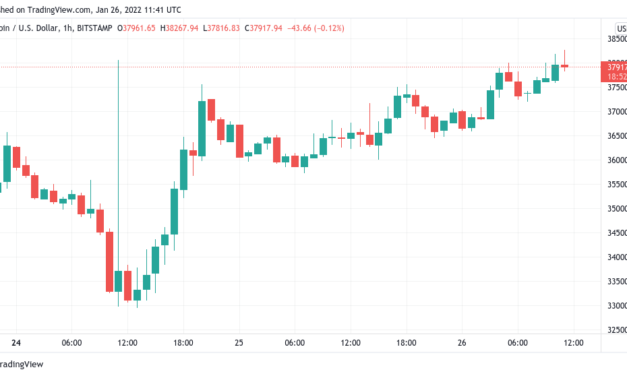
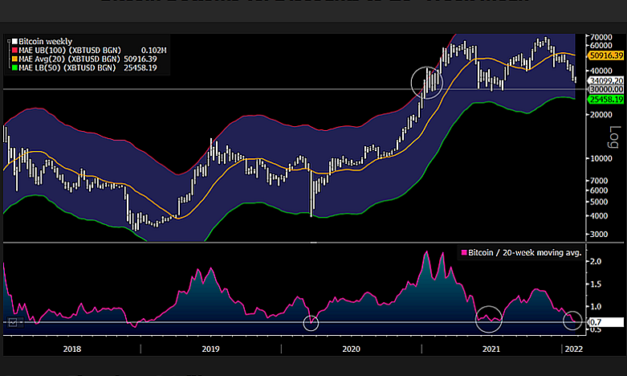
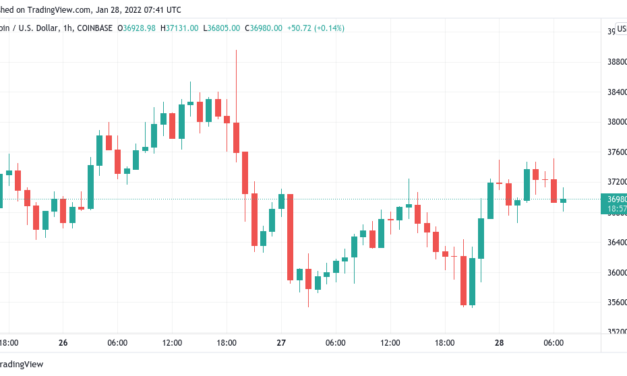
Bitcoin (BTC) created resistance at $37,500 on Friday amid an increasing consensus that a new dive was underway. BTC/USD 1-hour candle chart (Bitstamp). Source: TradingViewFunding signals dip expectationsData from Cointelegraph Markets Pro and TradingView revealed $37,500 as the ceiling which capped price action overnight into Friday.BTC/USD had recovered from a trip to local lows of $35,500 after comments from the United States Federal Reserve, but previous highs still eluded bulls.Now, with funding rates continuing into negative territory, it seemed that the market expected another investigation of the area closer to $30,000 support.”Funding turned even more negative post FOMC as investors were spooked by Powell’s resolve to fight inflation,” a report from crypto research firm Delph Digital summarized.  “All in all, it seems like the market is expecting Bitcoin to make a lower low after recently testing the $34K level.”Bitcoin funding rates chart. Source: CoinglassWhile sustained low funding rates provide fuel for a “squeeze” of unsuspecting shorters, mixed emotions prevailed Friday amid news that the U.S. government was allegedly preparing an executive order on cryptocurrency.Upheaval on the regulatory front, which would come after a debate over the environmental impact of mining, also echoes the arduous journey of a Congressional Bill last year which saw fierce opposition over its treatment of crypto for tax purposes.With short timeframes looking unappetizing, hopeful analysts turned to investor behavior for cues.Popular Twitter account Material Scientist, creator of on-chain analytics suite Material Indicators, noted increased sustained buying by one entity this week.In the last week, someone has been TWAP’ing a net of +$200M with orders of size $10k – $100k, making up almost all of the total CVD on Binance.h/t Decent@Gambling in our TG#BTC pic.twitter.com/IdGQQrFwfj— Material Scientist (@Mtrl_Scientist) January 28, 2022As Cointelegraph reported, data also shows that hodlers remain broadly committed to their positions, in line with the mid-point of market cycles.Bollinger adds “trial” Ethereum positionAltcoins continued to follow in step with Bitcoin, the 24 hours to Friday seeing limited moves either way.Related: ‘Stop panic selling’ — Bitcoin whales bag spare BTC as exchange balances fallEthereum (ETH), the largest altcoin by market cap, traded 1.1% up, as signs began to turn in its favor as an investment at current levels.For John Bollinger, creator of the well-known Bollinger Bands indicator, it was time to build an ETH position.”I bought a little $ethusd, a trial position, last night, with a close stop–well close for crypto… I liked the pattern on the six hour and have been looking for an entry,” he revealed on Twitter. “Not a high confidence trade and I am probably early, but toe is in and I am focused now.”Others were decidedly less enthusiastic about altcoins in general, however, amid a forecast that Bitcoin’s market cap dominance could be due for a broader rebound, limiting their capabilities.Bitcoin dominance chart. Source: TradingView

Čítaj viac

No blow-off top? Bitcoin hodler metric points to ‘depressed’ BTC price

Bitcoin (BTC) investors are famous for their ability to “hodl” through price dips, but new data sheds light on how long they may be prepared to continue.In a tweet on Jan. 16, on-chain analytics firm Glassnode noted that holder behavior currently mimics how Bitcoin behaves during the least extreme part of its price cycles.Reserve Risk: Bitcoin price ‘depressed,’ hodlers hodl onReferring to its Reserve Risk (“R-Risk”) metric, Glassnode argued that current buying and selling trends are not those of a macro top or bottom.“Low values of R-Risk are characteristic of mid-bear to mid-bull cycles, where prices are depressed, but HODLing dominates onchain,” it explained.R-Risk looks at the number of days holders choose not to sell versus current price action, resulting, among other things, in an indication of market mindset at a given price point.Currently, R-Risk is trending downwards, and is flirting with its “depressed” zone.Bitcoin reserve risk annotated chart. Source: Glassnode/ TwitterIn an explanatory article originally accompanying the metric, Glassnode additionally said that such moves take a longer rather than shorter time to resolve, again suggesting that an event such as this halving cycle’s blow-off top may be a long way off.“The Reserve Risk oscillator can be seen to oscillate in line with the macro bull/bear market cycles. It has well defined peaks in line with blow-off tops, and lengthy periods of relative undervaluation during bear market bottoms and into early bull markets,” it summarizes.Miners cool “massive” accumulation trendThe data conforms to the overall impression of long-term BTC hodlers doubling down on their conviction in the face of an unexpected downtrend.Related: Bitcoin dips 8% from highs as trader demands BTC bulls reclaim $37.5KDepending on the source, this corrective period has in fact lasted throughout 2021, and as Cointelegraph reported, there is no sign of capitulation among old hands.Data from fellow analytics firm CryptoQuant meanwhile shows that miners, who have also been “massively” accumulating in recent months, began keeping their reserves more constant in January. Bitcoin sitting at their production cost, reducing profitability, could be a likely cause.Bitcoin miner reserve chart. Source: CryptoQuant

Čítaj viac

Bitcoin dips 8% from highs as trader demands BTC bulls reclaim $37.5K

Bitcoin (BTC) climbed down from multi-day highs on Jan. 27 as the aftermath of the latest United States Federal Reserve meeting saw bulls taper their enthusiasm.BTC/USD 1-hour candle chart (Bitstamp). Source: TradingViewBitcoin disappoints below $37,500Data from Cointelegraph Markets Pro and TradingView showed BTC/USD walking back some of its gains, which had topped out at $38,950 on Bitstamp.The pair then refocused on $36,000, the level near which it was trading at the time of writing.As momentum gathered pace, market commentators began hoping for a stronger weekly close, possibly including a challenge of the $40,000 mark. Now, however, the mood was markedly less euphoric.”Bitcoin rejected at $38K and hit the first important level of support at $36K here,” Cointelegraph contributor Michaël van de Poppe summarized to Twitter followers. “Might have a short-term bounce, but anything sub $37.5K isn’t shouting for bullishness.”BTC/USD annotated chart with support and resistance zones. Source: Michaël van de Poppe/ TwitterVan de Poppe joined others in voicing dissatisfaction with the outcome of the Fed meeting, in particular with a lack of new insight and policy information from Chair, Jerome Powell.”With inflation well above 2 percent and a strong labor market, the Committee expects it will soon be appropriate to raise the target range for the federal funds rate,” a statement by the Federal Open Market Committee read. “The Committee decided to continue to reduce the monthly pace of its net asset purchases, bringing them to an end in early March.”With that, crypto markets had few macro cues to react to, a paradigm shift in price behavior yet to make an appearance.Crypto liquidations pass $300 millionAltcoins followed Bitcoin in step to shed several percentage points on the day, once more adding to the week’s overall losses.Related: Bitcoin pundits split over BTC floor as Bloomberg analyst eyes bounceEther (ETH) fell back below $2,500, still down 22% over the past seven days.ETH/USD 1-hour candle chart (Bitstamp). Source: TradingViewOthers fared somewhat better, with Dogecoin (DOGE) retaining most of its previous progress and Cardano (ADA) trading flat at $1.06.Not everyone escaped unscathed post-Fed, however, with total cross-crypto liquidations passing $320 million, data from on-chain monitoring resource Coinglass confirmed.Crypto liquidations chart. Source: Coinglass

Čítaj viac

BTC price hits $38K as Bitcoin analysts focus on weekly close

Bitcoin (BTC) staged new retests of $38,000 resistance on Jan. 26 as optimism increased over a potential recovery to $40,000 and higher.BTC/USD 1-hour candle chart (Bitstamp). Source: TradingViewNext stop a $40,000 retest?Data from Cointelegraph Markets Pro and TradingView followed BTC/USD as it continued the rebound that began on Monday.At the time of writing, two breakthroughs of $38,000 had occurred, with the pair lingering just below that level amid further direction cues.For Cointelegraph contributor Michaël van de Poppe, the signs were encouraging, with the stage being set for a potential exit from the $30,000–$40,000 corridor.”Bitcoin held $36K and tested $38K already. If that one tests again, we are likely to get a breakout and potentially test $40.7K,” he told Twitter followers.Almost as bullish on short timeframes was trader, analyst and podcast host Scott Melker, known as the “Wolf of All Streets.””Target is $39,600, which as you know is ‘coincidentally’ the key resistance on higher time frames,” he said as part of his latest Twitter update, identifying a “cup and handle” pattern on the hourly chart. Even if the overall trend demands that Bitcoin continue to fall, he added, $39,600 remained important as a zone to challenge.Here is $39,600 on the weekly. This is where bullish market structure broke down with a lower low.This is the initial target of my current longs. It “should” theoretically be retested as resistance, even if we are going down further.Never guaranteed. pic.twitter.com/4AUZRsFuF5— The Wolf Of All Streets (@scottmelker) January 26, 2022Dogecoin gains outshine major cryptosAltcoins continued to see relief, meanwhile, with Ether (ETH) gaining another 4.3% in the past 24 hours to return above $2,500.ETH/USD 1-hour candle chart (Bitstamp). Source: TradingViewRelated: Eth2 is no more after Ethereum Foundation ditches name in rebrandThe largest altcoin by market cap was nonetheless outperformed by several peers, including Solana (SOL) and XRP.The top 10cryptocurrencies by market cap, however, were led by Dogecoin (DOGE), which put in around 10% gains over the same period.The move accompanied fresh publicity from Tesla CEO Elon Musk, who pledged to eat one of McDonald’s “Happy Meals” on television should the fast-food giant opt to accept DOGE for payments.I will eat a happy meal on tv if @McDonalds accepts Dogecoin— Elon Musk (@elonmusk) January 25, 2022

DOGE/USD traded at $0.15 at the time of writing, still around 9% below its position a week ago.

Čítaj viac

Bitcoin pundits split over BTC floor as Bloomberg analyst eyes bounce

Bitcoin (BTC) could still fall under $30,000 but some prominent sources are already calling the end of the latest bearish turn on BTC/USD.In a tweet on Jan. 25, Mike McGlone, senior commodity strategist at Bloomberg Intelligence, eyed Bitcoin’s position relative to its 20-week moving average, noting that historically, current levels have marked a turning point.McGlone: Bitcoin “a bit extended” at all-time highsStill hopeful for Bitcoin to weather a macro storm this year, McGlone’s data places BTC/USD at the same position in which it halted downtrends in March 2020 and July 2021.Those incidences correspond to the coronavirus cross-march crash and the China miner rout, respectively.“The fact that Bitcoin is an up-and-coming asset, with less than $1 trillion market cap vs. about $100 trillion of global equities, that got a bit extended may give the crypto an advantage,” he commented.“Our graphic depicts a bottoming indicator for Bitcoin — about 30% below its 20-week avg.”Bitcoin 20-week moving average ratio vs. BTC/USD chart. Source: Mike McGlone/ TwitterAs Cointelegraph recently reported, Bitcoin has been echoing the events of March 2020 and onward in more ways than one this month.Nervousness on negative funding ratesNonetheless, other sources continued to call for caution when it comes to calling time on spot price losses.Related: ‘Stop panic selling’ — Bitcoin whales bag spare BTC as exchange balances fallAmong them was popular Twitter analyst Material Scientist, creator of analytics platform Material Indicators.This week, he took aim at funding rates, which although negative do not necessarily mean that Bitcoin will dupe bears with an upward squeeze.“I keep seeing people argue about negative funding necessitating us bottoming,” he argued. “Half of CT used that logic to argue 40k was the bottom. It wasn’t. This chart shows the count of negative funding pairs over time, alongside with the BTC chart at the top.”An accompanying chart showed instances in which negative funding across crypto did indeed come before further downside in 2021.Bitcoin negative funding rate count vs. BTC/USD chart. Source: Material Scientist/ Twitter“No one knows when the bottom is for BTC. Sometimes it’s as simple as assessing the asymmetry of potential downside/upside,” fellow trader and analyst William Clemente added in a fresh update on the day, recommending investors employ dollar cost averaging (DCA) to enter the market in the current range.“As I said yesterday, don’t think asymmetry is to downside with BTC in low 30s. Potential downside 20Ks, upside 60k+. DCAing into these levels is wise IMO.”BTC/USD traded at around $37,000 at the time of writing, having held onto gains from the start of the week.

Čítaj viac

Získaj BONUS 8 € v Bitcoinoch

nakup bitcoin z karty

Registrácia Binance

Burza Binance

Aktuálne kurzy