Autor Cointelegraph By William Suberg

Bitcoin stays near $38K as RSI breakout challenges 'boring' weekend

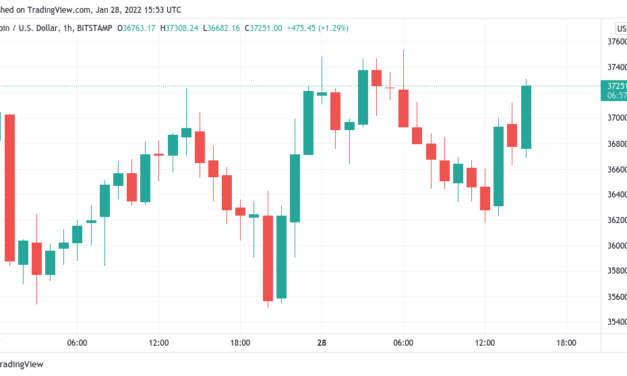
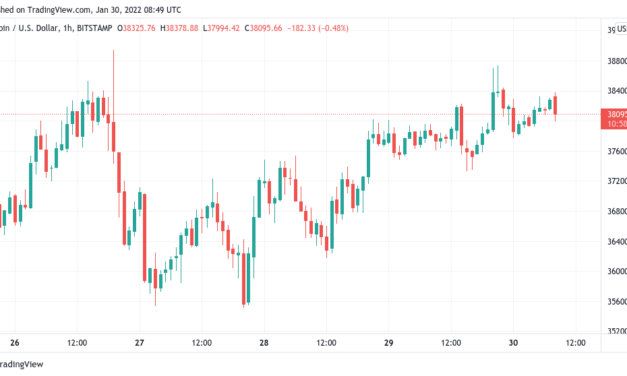
Bitcoin (BTC) circled the $38,000 mark into Jan. 30 as a “trappy” weekend still offered the chance of a solid weekly close.BTC/USD 1-hour candle chart (Bitstamp). Source: TradingView”Choppy waters” for BitcoinData from Cointelegraph Markets Pro and TradingView showed BTC/USD regaining the $38,000 mark after seeing local highs of $38,740 on Bitstamp the previous day.Despite its strong “out of hours” performance, few analysts believed in BTC as a firm bullish play without traditional market guidance.”Still choppy waters for Bitcoin,” Cointelegraph contributor Michaël van de Poppe summarized in his latest Twitter update. “Looking at $37K to see whether that sustains. If not – > I’m assuming we’ll test lows for daily bullish divergence to create. If we hold, we might see a breaker above $38.5K happening. Weekend times – > boring/trappy.”The highs nonetheless continued what looks like a slow return to form for BTC/USD on daily timeframes after its sub-$33,000 lows earlier in the week. For trader, investor and entrepreneur Bob Loukas, strength lay in the pair’s multiple closes above the 10-day moving average (MA).Two consecutive closes above the 10-dma for #bitcoin makes you think the lows are in now (for 60-day cycle). Maybe an attempt to get back down to $35k area is possible.— Bob Loukas (@BobLoukas) January 29, 2022Hopes of a weekly close at $39,600 resistance, however, still looked unlikely to be fulfilled at the time of writing. “Crypto market is full of breakout traders. What is the easiest way to bait them on a weekend when morale is already low? Force a move,” the skeptical trader and analyst known as Cantering Clark on Twitter added. RSI gives bulls cause for excitementShifting to on-chain data, meanwhile, popular analyst Matthew Hyland revealed yet more bullish cues coming from BTC’s relative strength indicator (RSI).Related: No blow-off top? Bitcoin hodler metric points to ‘depressed’ BTC priceAcross multiple chart timeframes, RSI recently hit its most “oversold” levels since the Coronavirus crash of March 2020.The metric is used to determine how “overbought” or “oversold” BTC is at a particular price, and thus how likely a particular trend is to sustain.Currently, thanks to the modest rebound off the lows, RSI appears to be in the process of challenging a multi-month downtrend in place since November.”The two previous breakouts during the past year have lead to massive bullish moves,” Hyland added as part of Twitter comments alongside a chart showing the action.Bitcoin daily RSI vs. BTC/USD annotated chart. Source: Matthew Hyland/ Twitter

Čítaj viac

Bitcoin returns to $37K amid warnings that BTC price 'needs to go lower'

Bitcoin (BTC) cracked $37,000 at the Jan. 28 Wall Street open as traders watched and waited for a resistance retest.BTC/USD 1-hour candle chart (Bitstamp). Source: TradingViewBTC evades a major resistance testData from Cointelegraph Markets Pro and TradingView showed BTC/USD returning to form after dipping to $36,175 on Bitstamp earlier in the day.As part of the range-bound behavior, hopes were held high that momentum would continue to challenge resistance levels closer to $40,000, whether or not the ultimate outcome would be a fresh correction.”The bearish scenario seems most likely, which is exactly the reason why I think we’ll see a surprising move,” popular trader Crypto Ed said as part of comments on the immediate outlook.”Only after a convincing reclaim of $40K I’ll be full bull.”Fellow trader and analyst Anbessa reiterated previous demands for $38,500 to hold to proclaim the corrective phase as complete for Bitcoin.As Cointelegraph reported earlier, low funding rates are combining with an improving picture across derivative markets, something that could, ultimately, spark a timely squeeze upward.#BTC has re-entered the $28000-$38000 consolidation rangeBTC last consolidated in this range in Q1 and Q2 of 2021Naturally, on this latest recovery, the Range High (red) will be the main resistance to beat to confirm further upside$BTC #Crypto #Bitcoin pic.twitter.com/aojF2Zcm0y— Rekt Capital (@rektcapital) January 25, 2022On Jan.24, Rekt Capital highlighted the area for Bitcoin to reclaim to rekindle bullishness on longer weekly timeframes. As reported, this would come in the form of $39,600 as a weekly close price.”Similar vibes” to early 2018Crypto Ed, however, was not alone in his feeling of foreboding over a possible fresh breakdown.Related: ‘Bull or bear market?’ Bitcoin losses from panic selling mount in 2022Despite taking liquidity during its brief dip below $33,000 earlier in the week, Bitcoin has not convinced everyone that the floor is truly in.Discussing the issue, Twitter analyst TXMC Trades, concluded that BTC/USD “still needs to go lower” from the current spot price. History, it seems, supports the theory.”It seems wrong that BTC would bleed straight down from the ATH without a relief rally, only to have the reversal be front-run without properly testing the range low,” he argued. “Similar vibes to April 2018 where the $6K bounce was front-run, but ultimately collapsed. Just a gut feel.”TXMC nonetheless noted that the bounce from $33,000 had liquidated more short positions than at any point since Bitcoin’s $69,000 all-time highs last November, citing data from on-chain analytics firm Glassnode.Bitcoin futures short liquidations annotated chart. Source: TXMC Trades/ Twitter

Čítaj viac

Bitcoin dodges ‘sub-$30K liquidity grab’ — Levels to watch now

Bitcoin (BTC) could still crash to $29,000 and lower, but price action is “healthier” than a week ago, the latest research concludes.In a fresh market update on Friday, analysts at trading suite Decentrader said that BTC price action is finally showing “green shoots of optimism.”Eyes on “near-term relief bounce” for BTCAfter a difficult week in which BTC/USD dipped to just under $33,000, market analysis is now focusing on the likely outcomes of the rangebound behavior seen over the past few days.For Decentrader, there is reason to be cautiously optimistic now where there was none a week ago.“We believe that the current derivatives landscape shift and this extremely negative sentiment backdrop does increase the potential for at least a near-term relief bounce,” analysts summarized.The reason lies in factors that had previously not fully “reset” as price action declined, notably the structure of derivatives markets. These include open interest declining toward less speculative levels, along with deepending negative funding rates.As Cointelegraph explained, negative rates correspond to overall market sentiment calling for fresh losses — often perfect conditions for an upward price shift.“We are now also beginning to see meaningful buyers step in, which is driving a potential change in the higher time frame trend from bearish to bullish,” the market update added about the additional positive pressure on the available BTC supply.Selling overall, while uncharacteristic of bull markets, hints that those behind it are taking losses.Bitcoin futures open interest chart. Source: Coinglass$29,000 and under seen as less likelyGoing forward, the outlook for support is a bounce zone at $29,650, something tha would itself only come into play should several other areas above $30,000 fail to hold.Related: Bitcoin ‘enters value zone’ as BTC price floor metric goes green againTo the upside, meanwhile, resistance lies between $38,850 and $39,700, Decentrader said, followed by a significant “empty” patch to $47,900 and then $53,400.“Support remains for now at $32,700 though there is some argument to suggest that price reached that level with Monday’s wick falling just $300 short of it,” the update reads.“Beyond that level, the next support is just shy of $30k, at $29,650 leaving the door open for a potential sub-$30K liquidity grab.”Sentiment, in line with funding, continues to stay in “extreme fear,” as per the Crypto Fear & Greed Index, this now rivaling the 2018 bear market trough and the March 2020 coronavirus crash in terms of record-breaking length.Crypto Fear & Greed Index. Source: Alternative.me

Čítaj viac

Crypto hodlers may not get richer from mainstream adoption — Goldman Sachs

Bitcoin (BTC) and cryptocurrency adoption may not necessarily make its price higher in dollar terms, Goldman Sachs argues.In a note seen by Bloomberg published Thursday, the international banking giant claimed that mainstream acceptance of crypto assets would increase their correlation to other mainstream asset classes.Goldman: Adoption is a “double-edged sword”In a view contrary to that of many Bitcoin proponents, Goldman sounded firmly uninspired by the prospect of crypto as a tool for the enrichment of the mass populace.“While it can raise valuations, it will also likely raise correlations with other financial market variables, reducing the diversification benefit of holding the asset class,” the note reads.Its authors, Zach Pandl and Isabella Rosenberg, additionally described mainstream adoption as a “double-edged sword.”Put another way, should Bitcoin or crypto become more correlated with extant assets, the scope for asymmetric profit would be reduced.The comments come as crypto markets indeed exhibit a higher correlation with equities, in particular, this month, with projections for 2022 not favoring a strong recovery — at least at first.Nonetheless, even Goldman itself has not wholly subscribed to one narrative, earlier in January reasoning that BTC/USD could still reach $100,000 — somewhat ironically, by stealing market share from gold and thus luring in more traditional investors.Simple supply and demand?Alternative theories for Bitcoin specifically eschew the idea of correlation outpacing the rate of gains delivered by other factors going forward.Relative: Breaking ‘bear market’ in Bitcoin demand will spark next BTC price surge — AnalystsThe simple mathematical equation of dwindling supply in the face of broader adoption is championed by analysts as a de facto guarantee of higher prices versus fiat currencies in the future.Bitcoin’s predictable emission schedule combined with growing wallet entities equal a phenomenon that continues to play out despite low-timeframe price weakness.Bitcoin wallet addresses holding at least 1 BTC vs. BTC/USD chart. Source: LookIntoBitcoinThe retracement that began in November, meanwhile, has failed to dent the enthusiasm of larger wallet holders, data from monitoring resource Santiment reveals.

Čítaj viac

‘Bull or bear market?’ Bitcoin losses from panic selling mount in 2022

Bitcoin (BTC) sellers’ losses are mounting as the BTC price downturn shows that some investors are panicking at current prices.Data from on-chain analytics firm Glassnode and trading suite Decentrader shows that in January, more and more BTC entities have been selling coins for less than they purchased them.On-chain loss selling now “consistent”While no one wants to sell an asset without profit, Bitcoin downtrends tend to see a certain cohort of market participants do so anyway — for fear of greater losses if they stay put.This panic selling is often derided by long-term investors, who argue that stronger, more liquid players will scoop up the supply to the detriment of those who sold.Analyzing the spent profit output ratio (SOPR) metric, Decentrader analyst Philip Swift revealed that while selling overall remains relatively low, panic has set in this year.“SOPR (Spent Output Profit Ratio) has had a consistent patch of on-chain loss selling recently, he summarized to Twitter followers this week.SOPR takes the aggregate “price bought versus price sold” data for BTC in a given period to produce an overall impression of whether sellers are in profit or at a loss.As noted by its creator, Renato Shirakashi, the psychology of selling at a loss means that only those in panic mode are likely to do so, and by extension, the shallower selling this month could be cause for relief.“It’s interesting to note that the selling at a loss the past few months has been much more shallow vs. 2018/19 bear market, but much deeper than we saw in either bull run period,” Swift nonetheless added. “Is this a bull or bear market rn?”Bitcoin spent profit output ratio (SOPR) chart (screenshot). Source: DecentraderAs Cointelegraph reported, Bitcoin’s price activity has surprised with its 50% retracement since November, this being somewhat uncharacteristic of what should be the most bullish part of its halving cycle.Zooming out, the whole of 2021 arguably looks like a consolidation zone after rapid gains a year ago.Big players dominate the transactionsMeanwhile, should selling be from low-volume retail investors, this would chime with other data covering on-chain transactions.Related: Derivatives data suggests that Bitcoin’s $39K bounce was a mere blipAs Glassnode confirmed this week, the majority of transactions now involve significant sums of $1 million or more. This, the firm concluded, points to institutions, not retail, as the driving on-chain force.“Bitcoin transfer volumes continue to be dominated by institutional size flows, with more than 65% of all transactions being larger than $1M in value,” a tweet read. “The uptrend in institutional dominance in onchain volumes started around Oct 2020 when prices were around $10k to $11k.”Bitcoin transfer breakdown annotated chart. Source: Glassnode/Twitter2022 has been announced as the year in which institutions indeed return to the Bitcoin space.

Čítaj viac

Získaj BONUS 8 € v Bitcoinoch

nakup bitcoin z karty

Registrácia Binance

Burza Binance

Aktuálne kurzy