Autor Cointelegraph By William Suberg

Bitcoin whales buy at $38K as BTC supply per whale hits 10-year high

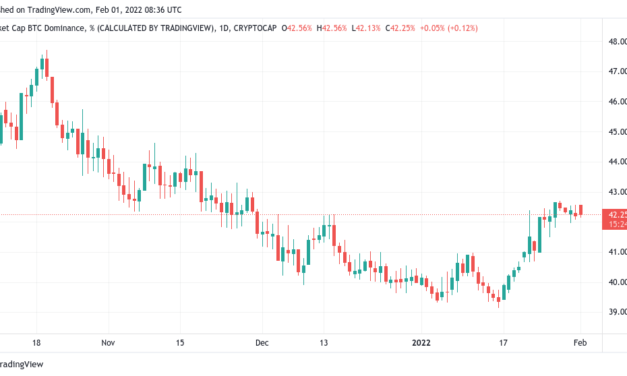
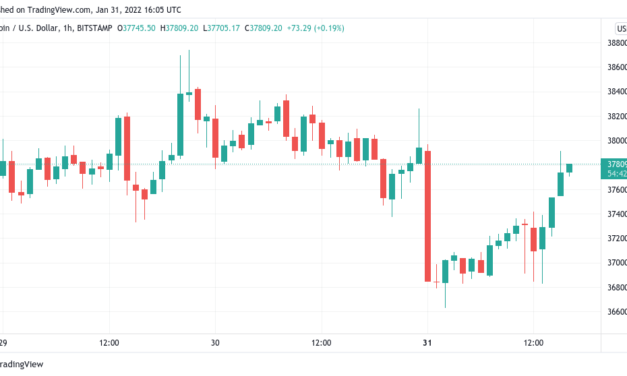
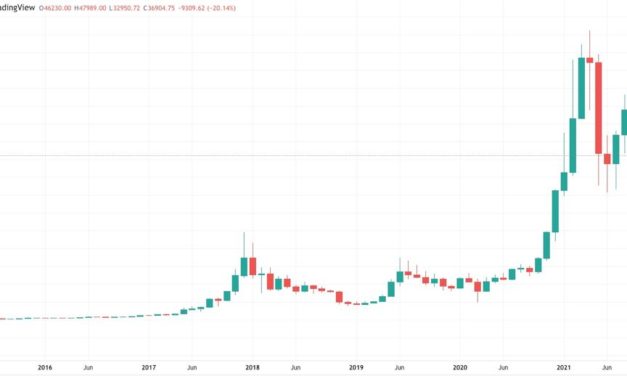
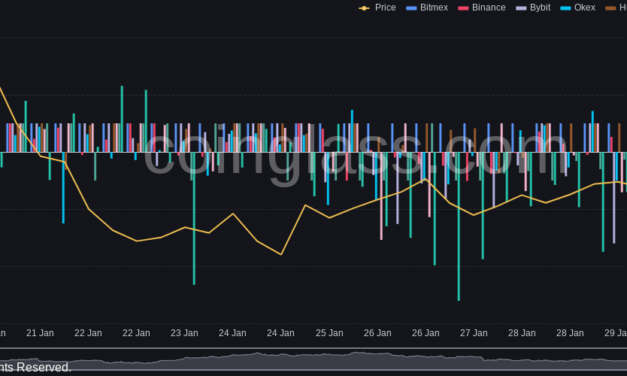
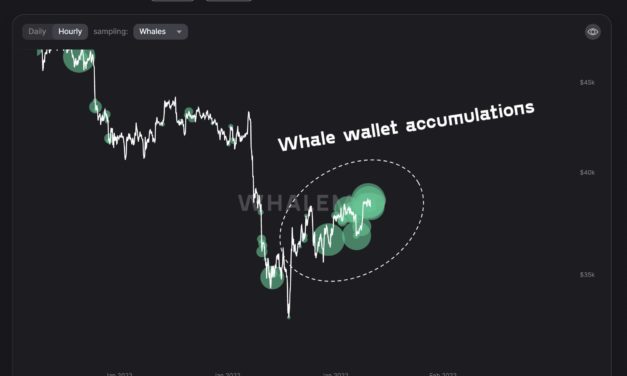
Bitcoin (BTC) jumping to $39,000 has already activated large-volume investors this week, the latest data shows.Analyzing whale behavior, on-chain monitoring resource Whalemap revealed accumulation underway at levels above $36,000.This week’s BTC price “triggered” whalesIdentifying clusters of whale bids, Whalemap uncovered what appears to be renewed market confidence among those with some of the largest BTC balances — between 100 BTC and 10,000 BTC.“Recent prices triggered whales to accumulate Bitcoin,” researchers summarized on Twitter Tuesday.According to cluster data, whales now own 330,000 BTC bought at spot prices between $36,000 and $38,000.Whale wallet accumulation annotated chart. Source: Whalemap/TwitterOverall, the portion of the BTC supply per whale wallet is now at its highest in a decade, data from on-chain analytics firm Glassnode uploaded to Twitter by popular account Priced in Bitcoin shows. This comes despite the vastly larger Bitcoin user base compared to the largest cryptocurrency’s early days. Bitcoin supply per whale vs. BTC/USD chart. Source: Priced in Bitcoin/TwitterTrader and analyst William Clemente, meanwhile, described last week’s whale activity as “fairly heavy” buying.Exchanges see new influx of BTC this weekendThe results run in contrast to a decreasing buying trend, which began in the second half of January.Related: Bitcoin market cap dominance hits 2-month high as altcoins struggleAs Cointelegraph reported, exchanges returned to seeing greater outflows than inflows in recent weeks, despite spot price action putting in lower lows.In the past few days, however, exchange users have conversely sent BTC to their accounts as BTC/USD has risen to its highest levels in two weeks.The 21 platforms monitored by on-chain analytics firm CryptoQuant saw their balance increase from 2.357 million BTC on Jan. 29 to 2.377 million BTC on Jan. 31, the latest date for which data is currently available.Bitcoin exchange reserves vs. BTC/USD chart. Source: CryptoQuantWhales may not actively use exchanges for larger buys, particularly if they are in a position to perform over-the-counter trades or purchase coins directly from miners.

Čítaj viac

Bitcoin market cap dominance hits 2-month high as altcoins struggle

Bitcoin (BTC) is retaking market share from altcoins after its market cap dominance hit its highest since November 2021 last week.Data from CoinMarketCap and TradingView reveals BTC briefly accounted for over 42% of the overall crypto market cap in late January.Bitcoin claws back market cap presenceHaving suffered on the way down from its all-time price highs in November, the latest moves have allowed Bitcoin to reclaim some of its lost ground against altcoins.Previously, attention was focused on major tokens such as Ether (ETH), Solana (SOL) and others as they capitalized on Bitcoin’s weakness.With the tables seemingly now turning, strength is flowing back to BTC, which managed to preserve 40% dominance throughout the latter half of last month.Bitcoin dominance 1-day candle chart. Source: TradingViewMarket cap is far from a perfect measure of market strength, as it pits established tokens against those with a short history, and does not take into account the work done or value behind a given cryptocurrency’s market cap.Realized cap, which values each unspent transaction output (UTXO) based on the price at which the coins involved in the transaction last moved, is favored by analysts.Unlike standard market cap, realized cap has remained more or less constant since the all-time highs in November, currently sitting at $453 billion, data from on-chain analytics firm Messari confirms.Bitcoin realized cap vs. BTC/USD chart. Source: MessariEthereum fees now dwarf BTCOn the topic of realized capitalization, the metric for Ethereum has seen a more pronounced retracement since Q4 last year.Related: Price analysis 1/31: BTC, ETH, BNB, ADA, SOL, XRP, LUNA, DOGE, DOT, AVAXWith controversy over the ETH 2.0 project accompanying record high fees, criticism over its ability to compete with Bitcoin continues to circulate.”Ethereum isn’t a purpose built value storage and settlement network, Bitcoin is,” analyst Dylan LeClair wrote Tuesday about the fees issue. “ETH has been becoming less efficient as a settlement network since launch as its token has accrued value.”Data from on-chain analytics firm Glassnode showed the declining value being transferred on the Ethereum blockchain per $1 in fees versus BTC.BTC vs. ETH daily transfer volume per $1 in fees annotated chart. Source: Dylan LeClair/ TwitterFurther figures added that Bitcoin fees now amount to just 1% of the fees paid for ETH transactions.”Almost didn’t believe it when I saw it, BTC currently at ~1% of $ETH in terms of the amount people pay to use the network,” VC partner Chris Burniske, who uploaded the numbers to Twitter, commented.BTC vs. ETH fee share chart. Source: Chris Burniske/ Twitter

Čítaj viac

'No signs Bitcoin has bottomed' as data warns BTC price downtrend continuing

Bitcoin (BTC) received a welcome boost at the Wall Street open on Jan. 31 as fresh research painted a gloomy picture for near-term price action.BTC/USD 1-month candle chart (Bitstamp). Source: TradingViewTrader “not interested” in longs below $38,500Data from Cointelegraph Markets Pro and TradingView showed BTC/USD climbing toward $38,000 on Monday, reversing a correction that had set in immediately after Jan. 30’s weekly close.With stocks giving some relief to bulls, many analysts remained hands-off on Bitcoin while higher levels nearer $40,000 remained unchallenged.”Bitcoin chopping around and fighting resistance, while the volume remains low overall,” Cointelegraph contributor Michaël van de Poppe summarized after his latest YouTube update. “As stated, sub $38.5K not that much interested in any long entries, unless higher timeframe bullish divergences play out. $37.5K is a first minimal step.”Fellow trader Pentoshi added that a suitable buy-in zone lay immediately below current levels.”I think you can likely bid 33K–36K. And scale in. And see yearly open on BTC in February. Lose 33K on HTF basis and cut it,” he considered as part of Twitter comments on the day.At the time of writing, BTC/USD traded at around $37,700, up $1,100 versus earlier lows.Expect “ranging” to continue for BTCOther sources were more somber on Bitcoin’s upcoming prospects. Related: Bitcoin price down 20% so far in 2022 after worst January since 2018Highlighting signs from its Trend Precognition set of on and off-chain indicators, analytics suite Material Indicators revealed that no significant change of tact had occurred versus the start of Bitcoin’s decline in November.”Zoomed out to a MACRO view of Bitcoin as we approach the monthly close. Trend Precognition shows no signs that BTC has bottomed. Expecting to range as the downtrend continues,” it commented on Twitter.Such a perspective ties in with those who believe that a lower low is necessary for Bitcoin to put in a convincing floor and begin to tackle resistance.Previously, fellow monitoring resource Whalemap identified $27,000 as an area of significant support should the current range give way.#Bitcoin macro levels according to volume profile (the on-chain version) 27k looks to be the closest support in case 34k is lost pic.twitter.com/BgLQ2FZaO2— whalemap (@whale_map) January 27, 2022Meanwhile, Cointelegraph has produced a list of potential price triggers for the coming week.

Čítaj viac

Bitcoin price down 20% so far in 2022 after worst January since 2018

Bitcoin (BTC) is heading for its worst January performance in four years — could all not be what it seems?Data from on-chain analytics resource Coinglass shows January 2022 to be the least profitable since the peak of Bitcoin’s last halving cycle. Investors, however, are still waiting for a “blow-off top.”Will Bitcoin see a rare “red” February?Against practically all expectations, BTC price action has continued to underperform this month.At current spot prices of $36,800, BTC/USD is down 20.1% versus the start of the year, compounding misery that began in November, data from Cointelegraph Markets Pro and TradingView shows.BTC/USD 1-month candle chart (Bitstamp). Source: TradingViewHistorical figures show that January is conversely often a “green” month for Bitcoin — 2021, by comparison, delivered gains of more than 21%.The same can be said for November and December, however, making this year especially painful for bulls. Those two months in 2020 saw price increases of 43% and 47% respectively.The last “red” January for Bitcoin, meanwhile, was in 2018, as the fervor surrounding the trip to then all-time highs of $20,000 rapidly cooled.That halving cycle peak, coming roughly 18 months after the previous block subsidy halving event, should have played out again in late 2021. The reality was quite different, and Bitcoin’s underperformance saw time-tested price apparatus come in for criticism.While Cointelegraph is considering what could break the downtrend next month, February still has history on its side when it comes to Bitcoin price strength.Last year, BTC/USD gained nearly 37% in four weeks, while serious downside last occurred far back in February 2014. In 2018, by contrast, Bitcoin hardly moved.Bitcoin monthly returns chart (screenshot). Source: CoinglassShorters in the mood this weekAs Cointelegraph reported, the out-of-character price behavior since November has got analysts wondering whether Bitcoin is in a bull or a bear market.Related: ‘Stop panic selling’ — Bitcoin whales bag spare BTC as exchange balances fallAt the height of this month’s losses last week, hodlers were down 52% against all-time highs, and so opinions favor further downside to come.Data shows opportunist traders’ resolve — the dip below $37,000 which followed the weekly close was heavily utilized by shorters betting on weakness continuing.Big shorts feeding on this dip below $37k on Binance Perp. pic.twitter.com/lPapGkSClp— TXMC (@TXMCtrades) January 31, 2022Bullish bias, meanwhile, is broadly off the table until a convincing retake of $38,500 and higher.

Čítaj viac

US crypto executive order looms — 5 things to watch in Bitcoin this week

Bitcoin (BTC) starts a new week with a bang — but not in the right direction for bulls.A promising weekend nonetheless saw BTC/USD attract warnings over spurious “out of hours” price moves, and these ultimately proved timely as the weekly close sent the pair down over $1,000.At $37,900, even that close was not enough to satisfy analysts’ demands, and the all-too-familiar rangebound behavior Bitcoin has exhibited throughout January thus continues.The question for many, then, is what will change the status quo. Amid a lack of any genuine spot market recovery despite solid on-chain data, it may be an external trigger that ends up responsible for a shake-up. The United States’ executive order on cryptocurrency regulation is due at some point in February, for example, while exact timing is unknown.The Federal Reserve is a further area of interest for analysts, as any cues on inflation, interest rate hikes or asset purchase tapering could significantly impact traditional markets, to which Bitcoin and altcoins remain closely correlated.With frustrating times characterizing the first month of 2022, Cointelegraph takes a look at the state of the market this week.We’ve identified five things worth considering when working out Bitcoin’s next moves.Bears “hammer” down on BTC weekly close Even the meagre gains into the weekly close were a short-lived reason to celebrate for Bitcoin bulls this Sunday.Midnight UTC saw an immediate rejection candle sweep in, with BTC/USD diving to $36,650 on Bitstamp.As noted by trader, analyst and podcast host Scott Melker, strong volume accompanied the move, underscoring the unreliable nature of weekend price action when it comes to building a position.As several other sources said last week, Melker reiterated that $39,600 needs to be reclaimed for a more bullish outlook to prevail.$BTC WeeklyPretty hammer candle (or high wave spinning top, choose).Strong volume, long wick into demand.Not really bullish until >$39,600.Have not had consecutive green wks in months, need confirmation. 2 weeks ago was a “bullish candle” as well, didn’t work out. pic.twitter.com/HlI8XI6RO2— The Wolf Of All Streets (@scottmelker) January 31, 2022Just as uninspired by the weekly candle was fellow trader and analyst Rekt Capital, who in a fresh Twitter update said that BTC “continues to struggle with $38,500 resistance.””This is the area BTC needs to Weekly candle Close above to ensure upside beyond ~$39,000,” he added.With a disappointing performance behind it, Bitcoin is thus back in the same old range — one which some warn could yet result in a retest of lower levels.”Personally looking forward to any opps to compound if we trade this 29-40k range for long,” popular trader Pentoshi confirmed.The trip to highs around $38,600 meanwhile succeeded in raising previously negative funding rates on derivatives as sentiment swiftly changed from expecting further downside to expecting a bullish continuation.The reversal, however, sent funding rates broadly back into negative territory, with most hovering just under neutral at the time of writing.BTC funding rates chart. Source: CoinglassCan S&P 500 upend worst month since March 2020?While Bitcoin’s monthly close is not yet slated to bring any surprises, stock markets may nonetheless provide some last-minute relief.With futures up pre-session Monday, the S&P 500, with which Bitcoin has displayed growing positive correlation in recent months, is heading for its worst monthly performance since March 2020.The S&P is down 7% this month, echoing the jittery start to the year for Bitcoin, as Fed policy begins to bite enthusiasm which accompanied unprecedented liquidity provision at the start of the Coronavirus pandemic.S&P 500 1-hour candle chart. Source: TradingViewWhile the Fed is now tight-lipped over the timetable for rate hikes which should follow the turning-off of the “easy money” spigot, closer to home, another problem for Bitcoiners is on the horizon.The Biden administration’s upcoming executive order on crypto, ostensibly moved forward to February, could put the cat among the pigeons once again in terms of already battered sentiment.The specter of the Infrastructure Bill remains for many a market participant, and further disadvantageous treatment of the crypto phenomenon would be seriously unwelcome from a country now hosting the lion’s share of the Bitcoin mining hash rate.According to a report from Bloomberg last week, the order should focus on the “risks and opportunities” crypto affords.The plans have already seen “multiple meetings” with officials, with the aim seemingly to unify government regulatory approaches to the crypto sphere.Old hands age wellBehind the scenes, the more comforting trend of seasoned Bitcoin hodlers clinging to their assets continues to play out.Data from on-chain analytics firm Glassnode this week confirms that the number of coins that last moved between five and seven years ago has reached an all-time high.That cohort of coins now totals 716,727 BTC.Bitcoin supply last active five to seven years ago vs BTC/USD chart. Source: Glassnode/ TwitterAt the same time, January in fact saw an overall decrease in Bitcoin exchange reserves despite price losses. As per Glassnode data, major exchanges are down around $243 million this week alone.Previously, Cointelegraph reported on the ongoing depletion of exchanges’ BTC holdings. Separate figures from CryptoQuant, which track 21 major trading platforms, further confirm that balances are at their lowest since 2018.Bitcoin exchange balance vs. BTC/USD chart. Source: CryptoQuantGBTC dives to record 30% discountThings aren’t going so well for the Grayscale Bitcoin Trust (GBTC).Despite data showing the reemergence of institutional interest in Bitcoin in January, demand for the industry’s flagship BTC investment product continues to wane.According to data from on-chain analytics firm Coinglass, last week saw GBTC trade at its biggest ever discount relative to the Bitcoin spot price.GBTC premium, holdings, marker price chart. Source: CoinglassThis discount to net asset value (NAV) — the fund’s BTC holdings — used to be a premium investors paid for exposure, but now, the tables have long turned.On Jan. 22, new entrants were technically able to buy GBTC shares at nearly 30% below the spot price on the day.As Cointelegraph reported, GBTC has faced a rapidly changing environment in recent months, thanks to a combination of price action and the launch of exchange-traded funds (ETFs). GBTC itself is due to become a spot-based ETF — but only with U.S. regulatory approval.Precising the situation, on-chain analyst Jan Wuestenfeld said that in spite of the discount, GBTC did not necessarily represent a way for institutional investors to profit from “easy money” in the long term.“Yes, if you believe it will be converted into a spot ETF at some point, but there are also the fees to consider and also that you don’t really hold the keys,” he said as part of a Twitter debate at the weekend.Not so fearful after all?Trustworthy or not, something is happening to Bitcoin on-chain sentiment this week.Related: Top 5 cryptocurrencies to watch this week: BTC, LINK, HNT, FLOW, ONEAfter spending almost all of January in the depths of “extreme fear,” accompanied by a revisit of rare lows seen only a handful of times, the Crypto Fear & Greed Index is finally looking up.On Sunday, the Index exited the “extreme fear” zone — a reading between 0 and 25 — for the first time since Jan. 3.Fear & Greed uses a basket of factors to determine overall market sentiment, and its range highs and lows have accurately depicted extremes in price.That a more positive mood may finally be entering is a welcome signal for analysts, but as ever, all depends on whether such a recovery is sustainable and remains uninterrupted by external surprises.The party proved to be fleeting, as the weekly close hammer candle sent readings back into “extreme fear.”Nonetheless, with brief trip to 29 — “fear” — the Index thus avoided the dubious honor of spending the longest-ever amount of time in the “extreme fear” zone since it was created in 2018.Crypto Fear & Greed Index. Source: Alternative.meThe fickle nature of sentiment overall, meanwhile, was not lost on veteran trader Peter Brandt, who at the weekend poked fun at how perspectives have changed since the price correction began.I find it fascinating that many (not all) on social media who wore laser eyes in Mar/Apr and predicted a rocket shot for $BTC in Nov now are predicting that the $30k level will be violatedWhen bulls wear laser eyes — time to SELLWhen bulls become bears — time to BUY???? pic.twitter.com/ytchaFLDfN— Peter Brandt (@PeterLBrandt) January 30, 2022

With the all-time highs in November as a focal point, Brandt described the latter half of 2021 as the “Laser Greed Era.”

Čítaj viac

Získaj BONUS 8 € v Bitcoinoch

nakup bitcoin z karty

Registrácia Binance

Burza Binance

Aktuálne kurzy