Autor Cointelegraph By William Suberg

Bitcoin sets lower lows as 2021 BTC price resistance taunts hodlers

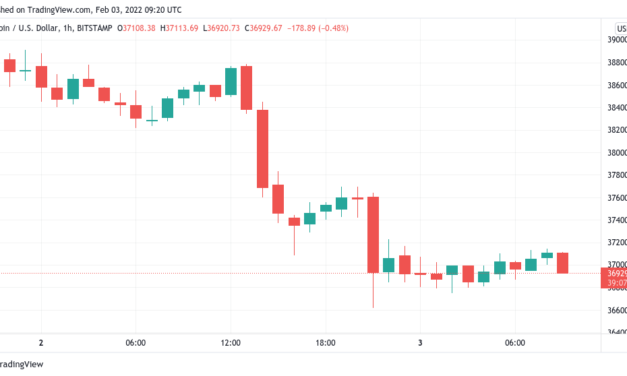
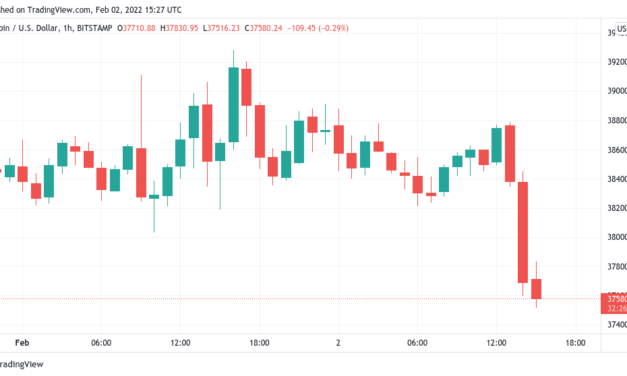
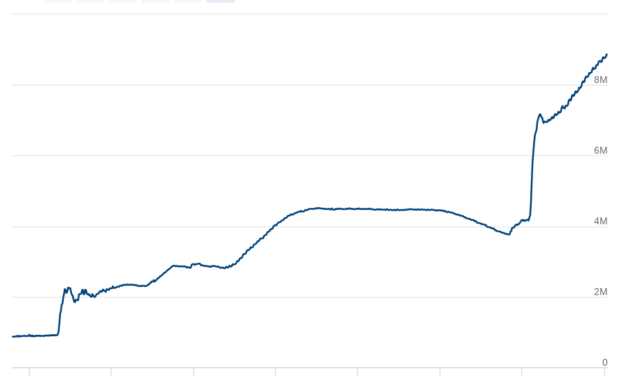
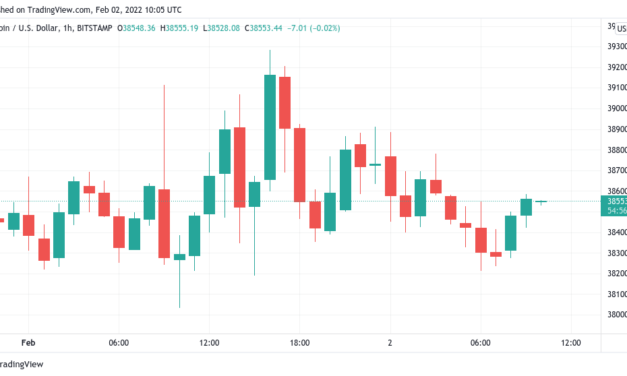
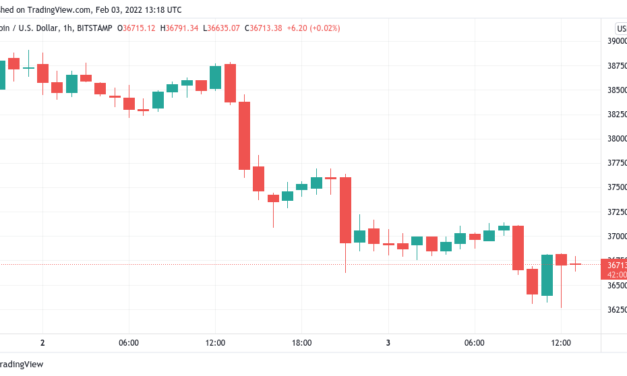
Bitcoin (BTC) fell further pre-Wall Street on Feb. 3 as analysis revealed old resistance levels had returned to haunt bulls.BTC/USD 1-hour candle chart (Bitstamp). Source: TradingView$38,600 is backData from Cointelegraph Markets Pro and TradingView painted another uninspiring picture for BTC/USD Thursday, with the pair meeting new lows of $36,275 on Bitstamp.After shock tech stock moves during Wednesday’s trading session, the knock-on effect for crypto remained palpable as major tokens struggled to stabilize.Zooming out, popular trader and analyst Rekt Capital revealed the area at $38,600 — a stumbling block at several points in 2021 — was once again acting as a line in the sand for bulls to cross.”Indeed, BTC produced an upside wick into resistance on its latest recovery,” he tweeted. “For the time being, this ~$38600 area continues to figure as resistance.” BTC/USD annotated chart. Source: Rekt Capital/ TwitterFor others, including fellow trader Anbessa, it was a case of “the lower, the better” for Bitcoin, this chiming with existing expectations of a more significant breakdown occurring before a full recovery.#BTC Update- dead cat inside LTF rising wedge, breakout & continuation- current support levels mid range, M-neckline & downtrending channel (since Nov21) The lower we go the better r:r ratio for a new #midterm LONG entry. Eg nuke scenario (right) crowded greedy entry pic.twitter.com/nCJVcHiQjc— AN₿ESSA (@Anbessa100) February 3, 2022Tech stock trouble meanwhile erased positive sentiment from other macro cues, with Russia’s proposal to allow banks to sell Bitcoin and India’s new crypto tax proposal taking a back seat.Puell Multiple returns to classic oversold territoryTurning to on-chain metrics, it was the turn of the Puell Multiple this week to follow Bitcoin’s relative strength index (RSI) in printing a major “oversold” signal.Related: Bitcoin whales buy at $38K as BTC supply per whale hits 10-year highCreated by David Puell, the popular indicator uses miner revenues relative to spot price to determine when the latter is overly high or low.Currently, the Puell Multiple is trending down, and already at its lowest since June 2021, the mid-point of a previous retracement after China banned mining.Puell Multiple chart (screenshot). Source: BuyBitcoinWorldwide

Čítaj viac

Bitcoin bounces at $36.6K as Meta adds 20% losses to US tech stock rout

Bitcoin (BTC) recovered above $37,000 on Feb. 3 after a stocks rout took the wind out of bulls’ latest attempt to crack $40,000 resistance.BTC/USD 1-hour candle chart (Bitstamp). Source: TradingView”Extraordinary moves” for stocksData from Cointelegraph Markets Pro and TradingView showed BTC/USD staying lower after briefly hitting $36,650 on Bitstamp Wednesday.The weakness followed shock losses for U.S. equities at the Wall Street open on Wednesday, with major names such as PayPal shedding huge portions of their value after underwhelming performance reports.Major stocks have been experiencing extraordinary moves post earnings after hours this seasonNetflix -22%Apple +7%Google +11%Paypal -20%Facebook -22%Spotify -23%Liquidity and the Fed’s put are both gone— Alex Krüger (@krugermacro) February 3, 2022Meta then followed in the after hours, hemorrhaging 20% of its share price in the wake of data showing it had begun losing users for the first time.Facebook “Meta” going to zero as investors learn the metaverse literally doesn’t exist— Cobie (@cobie) February 2, 2022

While Bitcoin proponents were quick to poke fun at the events, frustrating price action meant that the area identified as a key resistance/support flip looked all the less likely to break.”If Bitcoin loses this level at $37Kish, I think it will start to drop fast towards the lower bound of the region around $34-35K,” Cointelegraph contributor Michaël van de Poppe said overnight.Van de Poppe added that going forward, the strength of the U.S. dollar could be key to understanding the coming moves for crypto markets as a whole. The U.S. dollar currency index (DXY), with which crypto is traditionally inversely correlated, lost big in recent days.”It’s really dependent on the DXY on what we’re going to see on the crypto markets,” he told Twitter followers. “If the DXY is reversing in the coming weeks towards a downwards trend, that should be a huge accelerator for upwards momentum for Bitcoin.”U.S. dollar currency index (DXY) 1-day candle chart. Source: TradingViewAltcoins catch up to Bitcoin’s lossesAltcoins meanwhile extended their losses on the day, with the top ten cryptocurrencies led by Solana (SOL), down nearly 10%.Related: Price analysis 2/2: BTC, ETH, BNB, ADA, SOL, XRP, LUNA, DOGE, DOT, AVAXA host of issues for the platform had contributed to downward price pressure, with SOL/USD trading under $100 at the time of writing. SOL/USD 1-hour candle chart (FTX). Source: TradingViewOther weak performers were Polkadot (DOT) and Terra (LUNA), while Ether (ETH) was down 3.4% on the day.

Čítaj viac

BTC price dives with stocks as fresh sell-off sees PayPal shed nearly 25%

Bitcoin (BTC) fell on the Wall Street open on Feb. 2 as another tech stock rout panicked traders. BTC/USD 1-hour candle chart (Bitstamp). Source: TradingViewBitcoin: “Macro FUD is driving all” Data from Cointelegraph Markets Pro and TradingView tracked BTC/USD as it dipped below $38,000 as Wall Street began, giving back half of the gains secured on Monday.At the time of writing, the pair traded near $37,600 as tech stocks took a beating. These were led by PayPal, shares in which shed nearly 25% after the company reported missed earnings targets.Data from Bloomberg showed the extent to which early pandemic gains have been wiped out this year and last, in the case of PayPal 52% and others, such as Zoom and Peloton, by 70% or more.With its latest dip taking bulls even further away from crucial resistance, analysts were thus uninspired by Bitcoin in the short term.”Market structure for me is still clearly bearish under $39.6k. Would like to see daily closes over $40.2k before I felt a bigger rally possible,” popular Twitter account TXMC Trades summarized on the day. “My base case is still a test of $29-30k (or lower) before any future price discovery. Macro FUD is driving all. HODL and wait.”As Cointelegraph reported, not everyone expects immediate downside, with the possibility of a retest of $40,000 still possible for some.On-chain data also remained encouraging despite the depressed price performance lingering. Further to previous comments, statistician Willy Woo on Wednesday reiterated that all is healthy for Bitcoin under the hood.”Price in relation to on-chain demand from both speculative and hodl category of investors are now both at peak oversold levels,” he told Twitter followers. “The last time this happened was October 2020. The time before that was at the bottom of the COVID crash.”A look at derivatives markets saw funding rates hold slightly negative at the time of writing, as fellow analyst William Clemente took the opportunity to remind traders that negative rates may not necessarily be shorters “piling into” the market hoping for further deterioration.BTC futures funding rates chart. Source: CoinglassAltcoins broadly weather the market stormAltcoins meanwhile remained broadly steady, with Ether (ETH) the outlier out of major tokens with a 2.1% drop on the day.Related: All the world’s Bitcoin can only pay 2.43% of $30T US national debtETH/USD traded at $2,680 after the Wall Street open, nonetheless still up 1.7% versus the same time a week ago.ETH/USD 1-hour candle chart (Bitstamp). Source: TradingViewOthers in the top ten cryptocurrencies by market cap were either flat or down by a modest amount compared to Bitcoin’s 1.6% dip.As Cointelegraph reported, Bitcoin has upped its market cap dominance versus altcoins in recent weeks to reach a two-month high.

Čítaj viac

All the world’s Bitcoin can only pay 2.43% of $30T US national debt

The United States’ national debt has passed $30 trillion — and even all the Bitcoin (BTC) in the world would hardly touch it.According to the latest official statistics, U.S. national debt is at levels never seen before, passing the psychological $30-trillion barrier for the first time this week.Bitcoin is worth less than 3% of U.S. national debtAfter two years of liquidity injections fuelled by issuing even more debt, the Federal Reserve is attempting to rein in what has become a practically incomprehensibly large debt burden.$30 trillion — $30,000,000,000 — is a number so vast that it makes even the entire cryptocurrency market cap look like a drop in the ocean.Looking at Bitcoin specifically, with a market capitalization of $731 billion, it is 2.43% of the national debt tally.As such, even if the U.S. were to purchase all the BTC in circulation, it would still only pay off that tiny fraction of its debt.The sheer size of the total did not go unnoticed by Bitcoin proponents, who discussed the topic in earnest on social media.“As the debt spiral grows, the purchasing power of the Dollar will continue to be sacrificed for political interests and Wall Street bailouts,” on-chain analyst Dylan LeClair summarized.“Bitcoin fixes this.”Alex Gladstein, chief strategy officer at the Human Rights Foundation, meanwhile, highlighted the self-created demand for U.S. debt, even as the dollar hemorrhages value.“Genius design of the international dollar system over the decades (1944, 1973, etc) to prolong market interest and need for US debt even as it gets clearly discredited,” he wrote.The Fed balance sheet, meanwhile, now stands at $8.86 trillion, a new all-time high of its own.Federal Reserve balance sheet chart (screenshot). Source: Federal Reserve$40 trillion in three years?In a rare point of agreement, gold bug Peter Schiff, meanwhile, delivered a grim forecast for the overall debt trend.Related: Inflationary winds from around the world spell a sea change for BitcoinDespite the Fed’s alleged commitments to reducing the balance sheet, Schiff believes that the $40-trillion mark for total debt will have arrived by 2025.His son, Spencer Schiff, popular for his pro-Bitcoin stance, noted that the journey from $20 trillion to $30 trillion had taken less than five years.It will likely take less than 3 years for the National Debt to hit $40 trillion! https://t.co/MVuXPXwAt1— Peter Schiff (@PeterSchiff) February 2, 2022Cointelegraph has reported extensively on the benefits of Bitcoin’s hard supply cap and fixed issuance, both of which ensure that it stays “hard” money — and possibly the “hardest” money ever created.

Čítaj viac

BTC price faces crucial trend battle as Bitcoin RSI confirms breakout

Bitcoin (BTC) may have stopped short of $40,000, but this week’s gains have helped spark a more significant breakout for underlying price strength.BTC/USD 1-hour candle chart (Bitstamp). Source: TradingViewRSI breaks a two-month traditionData from Cointelegraph Markets Pro and TradingView shows that sustained BTC price action above $37,000 this week has allowed the relative strength index (RSI) to diverge from a multi-month downtrend.After going from $36,700 to $39,280 in February, Bitcoin still lacks the momentum needed to challenge $40,000 resistance.That could soon change, however, as one trader shows that RSI has now exited its dive deep into “oversold” territory.RSI looks at how “oversold” or “overbought” an asset is at a given price point. As Cointelegraph reported, since late November, it has been sinking, culminating in rare lows seen only a handful of times in recent years.“It seems that everyone is watching a trend line. But nobody is paying attention to the RSI….it already broke out of that downtrend!” popular trader and analyst Crypto Ed commented on the latest events. “Before you think I’m calling for new ATH’s: we’re not out of the woods yet, but seeing more up short term.”An accompanying chart shows BTC/USD fighting to exit its own downtrend, with RSI already notionally free.Bitcoin RSI vs. BTC/USD annotated chart. Source: Crypto Ed/Twitter“Groundhog Year” for BTC priceEven a trip back to the $69,000 peak would not constitute a major shift in price performance, however.Related: Bitcoin whales buy at $38K as BTC supply per whale hits 10-year highZooming out, data depicts almost the whole of 2021 as a consolidatory year for Bitcoin, with current prices almost exactly matching those from the same period last year.We have nearly exactly the same #Bitcoin price as 365 days ago. In other words – ranging market. pic.twitter.com/1ITGPIXymQ— Mikołaj Zakrzowski (@PrfDude) February 1, 2022Unlike much of the previous 12 months, however, the available supply has been dwindling, with the implication that any price trigger could have deeper consequences thanks to there simply being less BTC involved.This illiquid supply trend is further expected to continue upward “relentlessly” in 2022. 

Čítaj viac

Získaj BONUS 8 € v Bitcoinoch

nakup bitcoin z karty

Registrácia Binance

Burza Binance

Aktuálne kurzy