Autor Cointelegraph By William Suberg

Coinbase stock falls 5% pre-Wall Street as Bitcoin price dip adds to Super Bowl woes

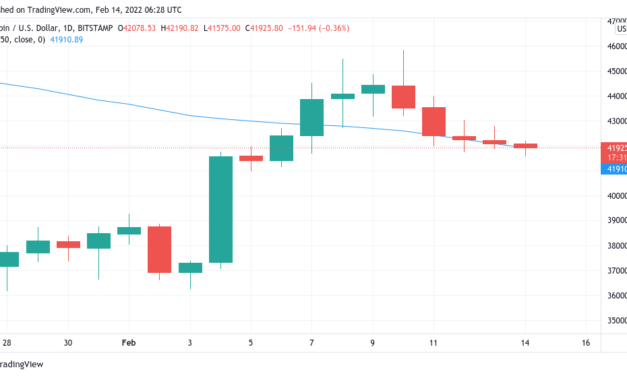
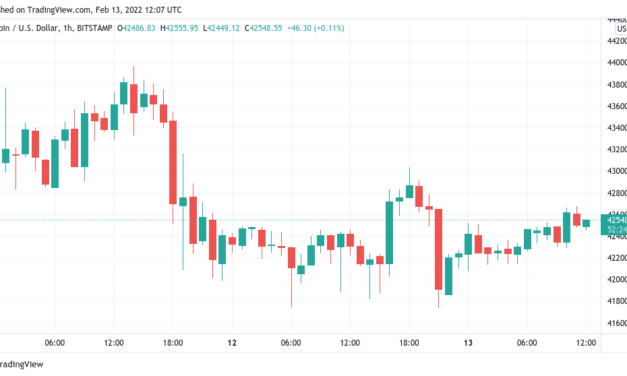
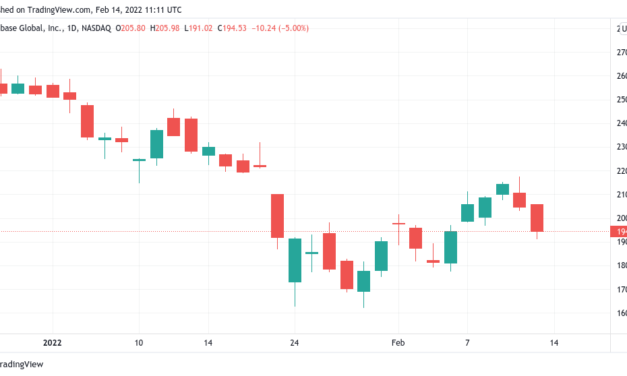
United States cryptocurrency exchange Coinbase (COIN) has seen its shares dive 5% pre-trading after a calamitous advertising debut at the Super Bowl 2022.Data from Cointelegraph Markets Pro and TradingView showed COIN preparing to open at $194.53 before Monday’s Wall Street open.Snowden: Coinbase crash “so very internet”The Super Bowl 2022 was an event to remember for crypto investors, with several of the exchange industry’s biggest names airing full-scale ad pitches.For Coinbase, however, the publicity quickly turned sour as the platform’s website and app both crashed following promises of a $15 giveaway made in the ad itself.@coinbase just saw more traffic than we’ve ever encountered, but our teams pulled together and only had to throttle traffic for a few minutes. We are now back and ready for you at https://t.co/ZUJqRlnZPH. Humbled to have been witness to this. #WAGMI— Surojit (@surojit) February 14, 2022While the problems lasted for under an hour, Coinbase did not escape widespread social media jibes, some becoming viral in their own right.The ad’s price tag also caused amusement, coming in at over $15 million for the single-minute slot.“Coinbase spending $16,000,000 on a Superbowl ad to direct people to their website and $0 to make sure that website doesn’t crash 10 seconds after the ad starts is so very internet,” Edward Snowden reacted on Twitter.The mishap is far from a rarity for the U.S. giant, which has made the headlines all too often for system outages, often at crucial times for Bitcoin price action such as periods of sudden volatility when trading opportunities are most lucrative.Many praised the ad’s approach, however, along with those of fellow participants FTX and Crypto.com.COIN/USD 1-day candle chart. Source: TradingViewBTC price action adds gloomCoinbase’s stock squeeze comes during a similarly uncomfortable time for Bitcoin traders, with the two assets clearly correlated.Related: 2 key indicators cast doubt on the strength of the current crypto market recoveryBTC/USD was down just under 1% in 24 hours at the time of writing Monday, part of a multi-day trend that could be paving the way for a retest of $40,000 as support.BTC/USD 1-hour candle chart (Bitstamp). Source: TradingViewIf the Super Bowl stunt aimed to lure retail clients, meanwhile, Coinbase announced last week that it was partnering with One River Digital Assessment Management to provide a new platform geared specifically to institutions.That sector of crypto investors is already tipped to be making a major comeback this year, following retail prevalence in 2021.

Čítaj viac

'Up only' for BTC fundamentals — 5 things to watch in Bitcoin this week

Bitcoin (BTC) starts the week with a slow drag downhill towards pivotal support at $40,000.After bulls had something to celebrate last week, the current environment looks like a fresh dose of reality as BTC battles nervous stock markets, a resurgent U.S. dollar and more.The picture is, as always, mixed — while spot price may not look too impressive, under the hood, Bitcoin is stronger than ever, and network participants are doubling down on their long-term commitments.Add to that the slow decline of risky behavior on derivatives markets and the stage could be set for some sustainable price growth. Will it happen this week?Cointelegraph presents five factors to consider in the coming days for BTC/USD.Bitcoin tests new 50-day moving average supportAfter ten days of recovery, Bitcoin is now reckoning with the resistance levels absent from bulls’ radar since the middle of January.Having passed $45,500 late last week, the weekend saw relatively calm conditions as the daily chart nonetheless saw a series of lower lows.The weekly close, the topic of interest Sunday as price action stayed practically in an identical place to the end of last week, ultimately disappointed — BTC/USD set a lower close of just under $42,000.With that, however, comes the possibility of short-term upside to fill the CME futures “gap” now above spot price at near $42,400.”Bitcoin is still just sitting in between support and resistance,” popular commentator Matthew Hyland summarized Monday, adding that he was “relaxing” in the face of current price moves.With support and resistance levels close by, trader and analyst Rekt Capital meanwhile reiterated BTC’s relative weakness when it comes to reclaiming support levels on a macro scale.Previously, he had identified two moving averages which needed to be reconfirmed as support in order for Bitcoin to have a shot at its all-time high from November.#BTC is struggling to reclaim as support the Bull Market EMAs that constitute the mid-point of the macro re-accumulation rangeAs long as these EMAs remain as resistance, Bitcoin will occupy the lower half of this macro range$BTC #Crypto #Bitcoin pic.twitter.com/m79CLY7P0K— Rekt Capital (@rektcapital) February 13, 2022Closer to home, the 50-day moving average is being challenged as the new week begins after a week of action above, data from Cointelegraph Markets Pro and TradingView shows.BTC/USD 1-day candle chart (Bitstamp) with 50-day MA. Source: TradingViewDXY sours risk asset moodBitcoin’s reversal toward $40,000 may not be helped by an advancing U.S. dollar.Since Feb. 4, the U.S. dollar currency index (DXY) has been on the rebound, cancelling a steep downtrend which had characterized the week prior.That traditionally spells problems for risk assets, and as of Monday, DXY was trading back above the 96 mark.U.S. dollar currency index (DXY) 1-day candle chart. Source: TradingViewFor stocks, already uninspired by the potential for Federal Reserve rate hikes in March, the geopolitical situation involving Ukraine and Russia remains a factor providing nervousness this week.”Over the past century, there were only four years where both stocks and bonds had a negative year,” analyst Lyn Alden meanwhile noted. Obviously it is super early, but so far both stocks and bonds have had negative returns in 2022.”Oil meanwhile continued on its journey to the $100 mark on the same tensions, Brent Crude futures passing $96 a barrel Monday.As Cointelegraph reported, both oil and Bitcoin remain a macro pick for this year.Spot price starts leading futuresAmid the rise to and the comedown from local highs, interesting activity has been taking place on Bitcoin derivatives markets.As noted by Twitter monitors including Glassnode lead analyst Checkmate, open interest leverage has been disappearing from futures markets — and with it the risk of getting deleveraged or “liquidated.”This time, however, the reduction is not coming from a sweeping change in price knocking out positions. Instead, investors themselves are choosing to change their strategy.”Bitcoin futures leverage has fallen significantly this week, falling from 2.0% of Market cap, to 1.75%,” Checkmate tweeted Sunday alongside a chart showing the de-risking. “However, this was NOT the liquidation cascade we all know and love. This is from traders choosing to close out their positions, far healthier. I expect spot to lead now.”Bitcoin futures open interest leverage ratio vs. BTC/USD annotated chart. Source: Checkmate/ TwitterRegarding the relationship between spot and futures prices, fellow commentator Byzantine General added that there is now the potential for futures to begin trading below, rather than above spot price.The divergence between the futures basis and spot is already “pretty significant,” he added in his own post overnight.Interesting, pretty significant basis to spot divergence here. Quarterly futures basis keeps making new lows, flirting with backwardation. pic.twitter.com/hX9E7WKeSs— Byzantine General (@ByzGeneral) February 13, 2022

At the time of writing, CME futures were trading around $200 below spot price at exactly $42,000.Hash rate follows difficulty to all-time highsIt’s been a straight winning year for Bitcoin’s network fundamentals so far, and this week is no exception.Over the weekend, hash rate charts — an estimate of the processing power dedicated to mining — surged to new all-time highs.While knowing the exact level of hashing power active on the Bitcoin network is impossible, hash rate estimates have shown a clear uptrend since the middle of last year, and the ecosystem took a matter of months to fully cancel out the impact of China’s enforced miner migration.Now, with the U.S. taking center stage for mining, it appears that it is a race to the top for participants.Hash rate did NOT jump 58 EH/s in 24 hours.Most network hash rate metrics are nothing more than estimates based on how fast blocks are coming in. On shorter time frames there is too much variability / randomness.Few understand this. pic.twitter.com/l6FHMDOXXW— Joe Burnett ()³ (@IIICapital) February 13, 2022

More easily measurable is Bitcoin’s mining difficulty, which has also recovered fully after diving to take into account the reduced hashing activity post-China.As of Monday, difficulty stood at 26.69 trillion, but moreover, its next automated adjustment will send it even higher still — over 27 trillion for the first time.The adjustment will kick in in around three days, and represent approximately a 2.2% increase.Bitcoin difficulty chart. Source: BlockchainKeep on hodlin’There is a firm sense of conviction among Bitcoin hodlers, and while this is common knowledge, the extent of their resolve is becoming clearer than ever.Related: Top 5 cryptocurrencies to watch this week: BTC, XRP, CRO, FTT, THETAAs noted by the popular Twitter account known as PlanC, wallets thought to belong to long-term hodlers are increasing dramatically — and recent price action has only helped the trend.Citing Glassnode data, PlanC noted that those entities, defined as wallets with a least two significant incoming transactions and zero outgoing transactions, have now hit an almost five-year high.Since we broke below 50k, Accumulation Addresses have increased their balance by 193,957 #Bitcoin Defined as addresses that have at least 2 incoming non-dust transfers and have never spent funds. #CryptoAccumulation Address Balance, 57 Month High pic.twitter.com/sMU9o80JwT— Plan©️ (@TheRealPlanC) February 13, 2022

The last days of January appear to have been particularly attractive to those seeking a position as BTC/USD returned to $40,000 after a two-week absence.The data excludes exchange addresses and those over seven years old to reduce the likelihood of the target wallets containing “lost” BTC that the owner is no longer able to access.

Čítaj viac

Bitcoin inches towards higher weekly close with CME futures gap in focus

Bitcoin (BTC) was on the cusp of making a new higher weekly close on Feb. 13 as bulls kept the market above $42,000.BTC/USD 1-hour candle chart (Bitstamp). Source: TradingViewBitcoin: Potential CME gap to comeData from Cointelegraph Markets Pro and TradingView tracked fairly stress-free conditions for BTC/USD over the weekend, with the weekly candle set to conclude in under 12 hours.The pair had briefly dipped below the $42,000 mark before recovering, this setting it up to challenge last week’s close of $42,400 on Bitstamp.Should it succeed, the close would be a three-week high, Bitcoin nonetheless keeping traders guessing  as a matter of a few hundred dollars separated the upcoming close from the last.If #BTC loses this 4HR Range Low as support in the short-term, that could jeopardise a bullish Weekly CloseAt this stage, $BTC needs continued consolidation at these highs for the next few days to secure a favourable Weekly Close#Crypto #Bitcoin pic.twitter.com/bAzNDWqivB— Rekt Capital (@rektcapital) February 11, 2022Others were focused elsewhere, among them Cointelegraph contributor Michaël van de Poppe, who argued that Monday’s CME futures open would likely dictate a near-term price target regardless.”Don’t be fooled by any move of Bitcoin during the weekend. In the end, the price will come back to CME close of Friday,” he reiterated.CME futures ended Friday at $42,390 — almost exactly at the point of last week’s spot price close.CME Bitcoin futures 1-day candle chart. Source: TradingViewXRP stands out in flat marketOn altcoins, the calm conditions for Bitcoin played out in a broad lack of action for out-of-hours traders.Related: 2 key indicators cast doubt on the strength of the current crypto market recoveryOut of the top ten cryptocurrencies by market cap, only XRP managed significant gains, climbing over 6% in the 24 hours to the time of writing to cap weekly returns of more than 25%.XRP/USD 1-day candle chart (Bitstamp). Source: TradingViewThe move came amid an ongoing legal saga between Ripple, the major XRP token holder, and United States regulators over its status as a security.

Čítaj viac

Bitcoin dips below $42K as crypto sentiment returns to 'fear'

Bitcoin (BTC) trended toward a $40,000 retest on Feb. 12 as BTC price action bore out analysts’ predictions.BTC/USD 1-hour candle chart (Bitstamp). Source: TradingViewTrader hopes to avoid ‘ugly’ weekly closeData from Cointelegraph Markets Pro and TradingView showed BTC/USD reaching local lows of $41,741 on Bitstamp Saturday before a rebound over $42,000.An about-turn had ended the pair’s advance after U.S. CPI data hit, and calls soon emerged for a return to $40,000 or even lower to see how steely bulls’ resolve really was.For Cointelegraph contributor Michaël van de Poppe, the results were still inconclusive, but caution was definitely needed going forward on short-timeframe trades.”Bitcoin looking at the same resistance still,” he summarized alongside a chart showing potential support and resistance targets.”Weekly order block rejecting in a harsh manner. Weekly candle starts to look ugly + several levels of fear across the market for coming weeks. Remaining flat at this stage.”BTC/USD 1-week annotated chart. Source: Michaël van de Poppe/ TwitterOthers meanwhile called time on the potential scope of Bitcoin’s longer-term downside.”For those waiting for sub 30k $BTC, may the crypto gods be with you because the odds are not,” popular Twitter commentator Credible Crypto advised.For those waiting for sub 30k $BTC, may the crypto gods be with you because the odds are not. https://t.co/LJPDoa4KCx— Credible Crypto (@CredibleCrypto) February 12, 2022Even at current levels, Bitcoin’s weekly close was set to be practically identical to the last, thus preserving the majority of the prior gains that had taken it out of the $30,000 zone.Straight back to “fear”The late drawdown this week was nonetheless more than convincing enough for crypto market sentiment to take a fresh hit.Related: Bitcoin stuck in a tight range as BTC price moving averages prepare key bullish crossAccording to the Crypto Fear & Greed Index, three days of “neutral” territory was enough before the return of “fear” as the main force at play among traders.On Saturday, the Index measured 44/100, having reached 54/100 Wednesday.Crypto Fear & Greed Index (screenshot). Source: Alternative.meDiscussing January’s weeks-long trip into the bottom “extreme fear” zone, trading suite Decentrader argued that a sentiment reset had likely already come based on historical patterns.”Such extended periods of extreme fear give an indication that general market participants can be caught offside. We saw that play out with the fast move to the upside that $BTC has shown over the past two weeks,” analysts wrote in a market update released Friday.

Čítaj viac

Bitcoin stuck in a tight range as BTC price moving averages prepare key bullish cross

Bitcoin (BTC) hovered above $43,000 on Feb. 11 as volatility waned after a fresh local peak.BTC/USD 1-hour candle chart (Bitstamp). Source: TradingViewSupport and resistance zones narrowData from Cointelegraph Markets Pro and TradingView showed BTC/USD awaiting a trigger to test either support or resistance nearby as Wall Street opened on Friday.The largest cryptocurrency had seen difficult moves for traders after Thursday’s U.S. CPI data, this causing pain for longs and shorts alike as 24-hour liquidations topped $200 million across crypto.With the inflation narrative still in the air, attention focused on the probability of Federal Reserve rate hikes and their timing.”The markets have priced in rate hikes. However, if we suddenly get an emergency rate hike in the coming week or an acceleration of the rate hikes, that’s going to be harmful for the markets and potentially give a shock reaction. Therefore, remaining relatively calm on trading,” Cointelegraph contributor Michaël van de Poppe said on the day.Fellow trader and analyst Scott Melker, known as the “Wolf of All Streets,” noted the narrowness of the current chart setup on lower timeframes, with support and resistance in evidence a comparatively short distance from spot.$BTC 4-HourTons of supply and resistance above $45,000, as indicated by the upwicks.Tons of demand and support in the low $43,000s, as indicated by the downwicks. pic.twitter.com/QAAIVSXJkG— The Wolf Of All Streets (@scottmelker) February 11, 2022For Anbessa, another popular commentator, the time had come to focus more on price action and sentiment and less on fundamentals in order to navigate the coming moves.”Don’t fight the market. Forget all fundamental talk. Price Action (+sentiment) only,” he tweeted Friday, preserving a mid-term target of just above $48,000.On Wall Street, the S&P 500 opened down before a slight recovery, continuing the impact of the CPI readout which delivered 7.5% annual inflation — another 40-year high.More fuel for chart bullsAnother short-timeframe signal joining in the bullish trend comes in the form of two more moving averages.Related: Bitcoin metrics demand BTC price gains as analysis calls for ‘near-term caution’Joining the positive-looking 50-day and 200-day exponential moving averages (EMAs) are the 100 and 200-period EMAs on the 4-hour BTC/USD chart.As noted by Twitter account Phoenix, these two are about to form a crossover which last year paved the way for significant price gains.”The trend is your friend,” the account summarized Friday. “The 100 EMA is about to crossover the 200 (4h tf) If so, they are in full bull mode again. It only happened twice in ’21: eo July and beg. of Oct. Backcheck Choppy prices: They want to shake you out.”BTC/USD 4-hour candle chart (Bitstamp) with 100 and 200-day EMA. Source: TradingViewAs Cointelegraph reported, Bitcoin’s MACD indicator is also printing a rare bullish pattern this week.

Čítaj viac

Získaj BONUS 8 € v Bitcoinoch

nakup bitcoin z karty

Registrácia Binance

Burza Binance

Aktuálne kurzy