Autor Cointelegraph By William Suberg

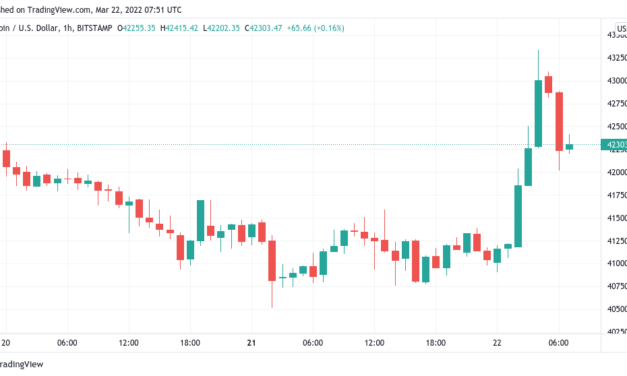
Bitcoin hits 3-week high as fresh impulse move sends BTC price to $43.3K

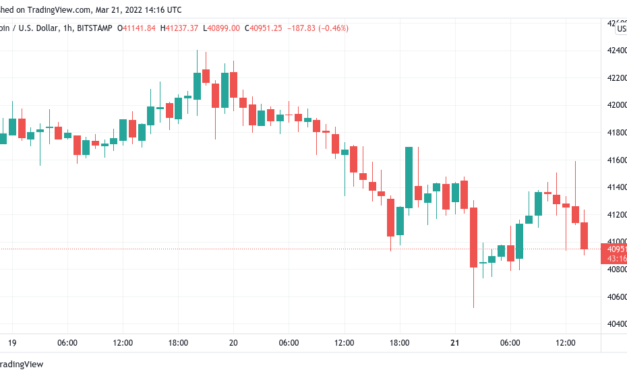
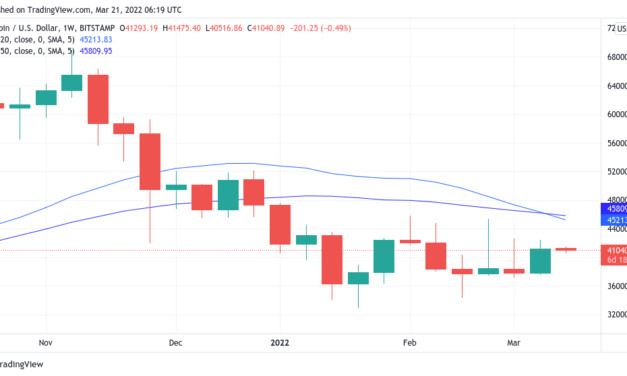
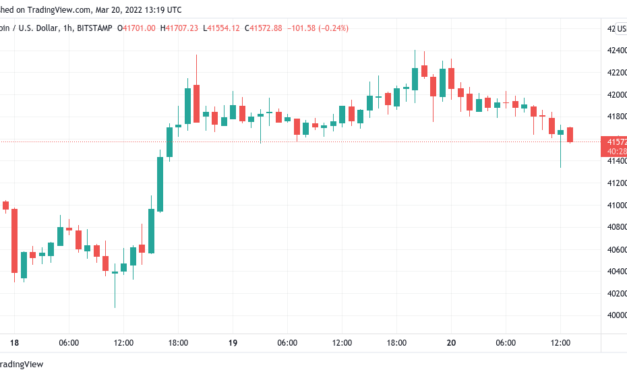
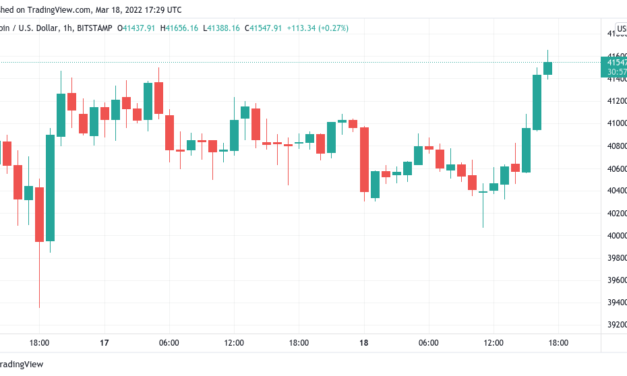
Bitcoin (BTC) saw a fresh impulse move overnight into March 22 as bulls briefly reclaimed $43,000.BTC/USD 1-hour candle chart (Bitstamp). Source: TradingViewRSI hints at underlying strengthData from Cointelegraph Markets Pro and TradingView showed BTC/USD reaching $43,337 on Bitstamp Tuesday, the pair’s highest since March 3.The action contrasted with the lack of volatility since the weekend, and neatly fitted with the more bullish predictions surrounding near-term trajectory.For popular trader Crypto Ed, who had previously given $43,000 as a low-timeframe target, all was going to plan.#BTC Been showing red box at $43k for a couple of days now….Imagine not watching my YT videos…..No need at all to listen to dudes, who like to hear talking themselves for >20mins.All you need to know in 3 minutes! https://t.co/nsWHyUMaYI pic.twitter.com/sj94yjuzhd— Ed_NL (@Crypto_Ed_NL) March 22, 2022Fellow analyst Matthew Hyland meanwhile eyed a potential breakout scenario for Bitcoin’s relative strength index (RSI) on the daily chart — a phenomenon which has often preceded price strength.BTC/USD 1-day chart (Coinbase) with RSI. Source: Matthew Hyland/ Twitter”BTC is a few hundred bucks away from the first higher high we’ve seen in a long time. Will it happen?” crypto market analyst Kevin Svenson added.Bitcoin had already sealed an impressive weekly close Sunday, its highest since early February, and now, macro cues were adding to the positive momentum once again.Trading was brisk for Asian markets on the day, the Hong Kong Hang Seng index up 3.15% at the time of writing.Asia unironically max bidding$BTC— Zhu Su (@zhusu) March 22, 2022

In Europe, however, there was little sign of a knock-on impact, while U.S. futures were likewise trending down prior to the Wall Street open.The push higher nonetheless did manage to squeeze out some short positions across cryptocurrency, as evidenced by data from on-chain monitoring resource Coinglass.Total 24-hour liquidations stood at $168 million at the time of writing.Crypto liquidations chart. Source: CoinglassEthereum returns to $3,000 in altcoin copycat rallyOn altcoins, the picture likewise turned more rosy overnight.Related: Price analysis 3/21: BTC, ETH, BNB, XRP, LUNA, SOL, ADA, AVAX, DOT, DOGEThe top ten cryptocurrencies by market cap were led by Cardano (ADA), which was 5.8% up in 24 hours to cap weekly gains nearing 20%.ADA/USD 1-day candle chart (Coinbase). Source: TradingViewOther major tokens fared almost as well, including Polkadot (DOT) and XRP.Ether (ETH), the largest altcoin, tapped $3,000 in step with Bitcoin’s rally before consolidating immediately under that psychologically significant level.ETH/USD 1-hour candle chart (Bitstamp). Source: TradingView

Čítaj viac

Bitcoin ‘could easily see $30K’ with stocks due to 30% drawdown in 2022 — Analyst

Bitcoin (BTC) opened the Wall Street trading session with a spike to over $41,500 on March 21 as last week’s late gains endured.BTC/USD 1-hour candle chart (Bitstamp). Source: TradingViewMcGlone: Fed is saying “Don’t buy the dip”Data from Cointelegraph Markets Pro and TradingView showed BTC/USD advancing $500 into the Wall Street open to see a strong start after its best weekly close in four weeks, but progress was short-lived.Amid a buoyant stock market, the largest cryptocurrency showed mixed signs on the lowest timeframes as traders waited to see how long the current trajectory could sustain.For popular trader Crypto Ed, the area around $41,500 was essential as a potential pivot point — a bounce and continuation could occur, providing an opportunity for longs, but a rout would mean a trip below $40,000 support.In his latest YouTube update, he identified $37,000 as a potential bearish target.Analyzing the four-hour chart, meanwhile, trader Pierre called the $40,800–$41,200 zone a “must hold.”“LTF pivot today imo (break it, teleport to 42.0-42.5k),” he concluded in the latest entry in a dedicated Twitter thread about spot price action.Addressing the wider macro picture, meanwhile, Mike McGlone, senior commodity strategist at Bloomberg Intelligence, had some concerning news for those hoping that the stock market revival would last much longer.“So, we have the most extended stock market in 20 years relatively… most expensive stock market in terms of GDP in the history of mankind, most expensive stock market versus real estate and versus global equities ever… and part of that is that’s been driving inflation and the Fed has to push back that inflation,” he told the Wolf of All Streets Podcast Monday.“So, to me, that’s the key puzzle point this year; that if it doesn’t get filled in — i.e., the stock market dropping about one third — then that’s going to be an issue.”As such, bets were in place already for a significant equities correction, with Bitcoin’s positive correlation making losses for hodlers a major liability.Continuing, McGlone pointed to hints by United States Federal Reserve Chair Jerome Powell that more aggressive interest rate hikes to tame inflation could come at further meetings of the Federal Open Market Committee.“That was my warning — people that don’t get it yet — ‘Don’t buy the dip’ — that’s for the people that haven’t learned their lessons,” he said.On Bitcoin specifically, he gave a target of $100,000 years out, but that the market “might easily see $30,000 first.”Germany lays bare inflation dangersMore macro news that was difficult to swallow came from Europe prior to the Wall Street opening bell.Related: ‘No more 4-year cycles’ — 5 things to know in Bitcoin this weekDespite a recovery in European equities versus the month of war between Russia and Ukraine, inflation figures showed the extent of the headache unfolding for policymakers.On the radar of market commentator Holger Zschaepitz Monday was Germany’s producer price index (PPI).“German PPI jumps 25.9% YoY in Feb. This was the highest increase ever since the start of the stats in 1949. PPI ex-energy rose 12.4% YoY,” he warned.German PPI chart. Source: Holger Zschaepitz/TwitterLike BTC, classic safe-haven gold, meanwhile, was also biding its time looking for direction, making up ground lost in its downhill candle on Friday and trading at around $1,934 at the time of writing.XAU/USD 1-day candle chart. Source: TradingViewOn altcoins, flat performance dictated the mood, with none of the top 10 cryptocurrencies by market capitalization advancing by more than 5% on the day.

Čítaj viac

'No more 4-year cycles' — 5 things to know in Bitcoin this week

Bitcoin (BTC) starts a new week on a tentatively stronger footing as macro cues curiously stabilize.After a calmer weekend than most recently, BTC/USD managed to seal its highest weekly close since February, casting off concerns that an imminent bout below $40,000 could enter.Instead, conditions are beginning to favor a more bullish perspective on shorter timeframes, but as ever, nothing is certain — bulls need to tackle resistance and flip it to support, beginning with levels just north of $42,000, a case of “so near yet so far” for the market this month.Signs that belief is heating up again nonetheless come from increasing activity in stablecoin markets, and as such, truly bearish takes on what lies ahead are now few and far between.As global markets stage a miraculous recovery after weeks of war-based nerves, Cointelegraph takes a look at what could impact Bitcoin in the coming week.Stocks act like they no longer care about warIt may seem “crazy,” markets commentator Holger Zschaepitz said this weekend, but it appears that in just one month, markets are beginning to forget the ongoing Russia-Ukraine war.What was the main trigger for volatility in previous weeks is becoming an increasingly impotent market mover after the shock of sanctions came and went, he says.While its implications are far from fully apparent, the current geopolitical reality is nonetheless increasingly unnoticeable on equities markets, which are now trending up with a focus on policy changes in China.Chinese equities took a pummeling this year, led by tech stocks on the back of government pressure, but a seeming about-turn to shore up stability in Beijing is already having its desired effect.Where Asia leads, Europe and the United States follow this week — markets are heading higher, and in the case of Europe’s Stoxx 600 have already eradicated losses engendered by the war.“Global stocks have gained ~$5tn in mkt cap this wk on potential for wave of stimulus in China & oversold stock prices,” Zschaepitz noted Monday. “Investors shrugged off ongoing war in Ukraine & rising rates. US 10y yields have jumped 10bps to 2.15%. All stock now worth $112.4tn, equal to 133% of global GDP.”Should the good news continue, attention will return to Bitcoin’s correlation with stock markets, and in particular those in the U.S., as a potential pretext for price strength.As noted by trading suite Decentrader last week, the correlation paradigm is yet to be broken.“Price action has been in lockstep with legacy markets since the Russia-Ukraine conflict began with a high correlation visible throughout the period, demonstrating that Bitcoin remains a risk-off asset during uncertain times,” analyst Filbfilb wrote in a market report.What would it take to break the spell? Investors may need to wait longer than the coming week to find out, but break it should, according to former BitMEX CEO, Arthur Hayes.“As you can see, Bitcoin is currently tied at the hip with big tech risk assets,” he wrote in a Medium post released last week. “If we believe nominal rates will go higher and cause an equities bear market and an economic recession, Bitcoin will follow big tech into the latrine. The only way to break this correlation is a narrative shift on what makes Bitcoin valuable. A rip roaring bull market in gold in the face of rising nominal rates and global stagflation will break this relationship.”Which cross will win out?Bitcoin managed to end the week with an impressive “engulfing candle,” which took the weekly chart to a one-month high close.Still about $41,000 despite attempts to send the market south at the last minute, the largest cryptocurrency is thus on a firmer footing as March continues.#BTC is mere hours away from confirming a bullish engulfing Weekly candleThis engulfing candle encompasses the previous 3 weeks’ worth of price action for Bitcoin$BTC #Crypto #bitcoin pic.twitter.com/n279Y7ue3q— Rekt Capital (@rektcapital) March 20, 2022All is not as straightforward as it seems, however, and nervous analysts are still concerned about a possible spate of weakness coming up.Despite the strong close, for example, the weekly chart nonetheless saw a form of so-called “death cross” last week, data from Cointelegraph Markets Pro and TradingView shows.Formed when a shorter-timeframe moving average crosses under a longer one — normally the 50-period under the 200-period but in this case the 20-period under the 50-period — such chart phenomena tend to signal upcoming weakness.BTC/USD 1-week candle chart with 20 and 50WMA (Bitstamp). Source: TradingViewBe that as it may, however, lower timeframes are not without their bullish cues.As noted by popular Twitter account BTCfuel, BTC/USD attacking the 100-period moving average on the daily chart is cause for optimism and mimics a structure from way back in 2012.“After falling below the MA’s, Bitcoin is now challenging the 100D MA (red),” he explained alongside comparative charts. “This is 33 bars after the bearish cross happened, very similar to 2012. A bullish cross should follow soon after that.”BTC/USD 1-day candle chart with 100DMA (Bitstamp). Source: TradingViewThe “softly-softly” approach is very much in favor for a market still moving within a range with firmly-defined resistance levels, however, and these should be firmly squashed before a genuine trend change is confirmed.That was the opinion of analyst Matthew Hyland this weekend, with $42,600 the first area to beat for bulls.If #Bitcoin can successfully break $42.6k it will likely head up to the $46k areaIf it gets rejected here then the $40.3k area which was previous resistance would have to be used as support again: pic.twitter.com/ZcmKajSziP— Matthew Hyland (@MatthewHyland_) March 20, 2022

Stop waiting for the blow-off top, says analystAs Cointelegraph reported, popular consensus argues that Bitcoin has in fact been sideways ranging not just this year, but all of last year as well.With $29,000 and $69,000 as the limits of the range, price action in between is thus just consolidation, various well-known commentators claim.Nonetheless, after 15 months, questions are now being raised about whether Bitcoin needs to be reevaluated within the context of one of its best-known traits: the four-year price cycle.Based on the block subsidy halving which occurs once every 210,000 blocks — roughly every four years — halvings have historically had a predictable impact on price performance.Bull market peaks, for example, have occurred the year after a halving, with bearish corrections following, before the process slowly repeats.This time has been decisively different, as the end of 2021 failed to see the same blow-off top witnessed in 2013 and 2017. “We’re likely seeing the first signs of ‘The Last Cycle’ thesis playing out,” popular analyst and statistician Willy Woo announced this week. “3 relatively short bull and bear markets have transpired since the 2019 bottom already. i.e. No more 4 year cycles.”Woo’s thesis revolves around the disintegration of the blow-off top as a feature of each halving cycle. Far from a bearish feature, however, he says that price action will simply become less predictable as supply and demand forces ramp up.We’re likely seeing the first signs of “The Last Cycle” thesis playing out. 3 relatively short bull and bear markets have transpired since the 2019 bottom already. i.e. No more 4 year cycles. https://t.co/N3VzlKx2IA— Willy Woo (@woonomic) March 20, 2022

As such, measuring BTC/USD against its latest all-time high — and its potential to beat it — may no longer provide an accurate depiction of market strength or capability. While similar to the so-called “supercycle” championed by names including Kraken growth lead Dan Held, not everyone agrees that the cycle-based price phases are no more.“Don’t quite agree. If we get a parabolic/blow off 5th wave there will be an equally aggressive drop that follows. But generally, yes, we can expect higher lows and higher highs to be put in over time of course,” popular Twitter account Credible Crypto responded to Woo when he unveiled the idea in October.Tether activity gets bulls excitedLook no further than behind-the-scenes moves on stablecoins to assess the chances of a bullish continuation occurring on crypto markets.Interaction with U.S. dollar stablecoins in particular, these holding the lion’s share of the market, are a key indicator of overall interest in crypto, and their trajectory is now pointing clearly upwards.As explained by on-chain analytics firm Santiment, two days last week saw more active Tether (USDT) addresses than at any other time this year or last.“As Bitcoin wavers around $41k, Tether is indicating big moves may be coming for crypto,” it commented. “Thursday (83k) and Saturday (74k) had the two largest days of 2022, in terms of addresses interacting on the network. Keep an eye on this diminishing stagnancy.”Tether network interaction annotated chart. Source: Santiment/ TwitterThe largest USD stablecoin, Tether’s market cap now stands at over $83 billion.Sentiment exits weeks of “extreme fear”A hint of good news is surfacing in crypto market sentiment this week.Related: Top 5 cryptocurrencies to watch this week: BTC, LUNA, AVAX, ETC, EGLDAfter a fresh dive into “extreme fear” which lasted most of March, the Crypto Fear & Greed Index has risen back to its “fear” zone.Crypto Fear & Greed Index (screenshot). Source: Alternative.meAt 31/100 on Sunday, the Index measured its highest since March 4, and points to the worst of the macro-based cold feet among investors — at least temporarily — being alleviated. Feels good to wake up Monday morning and see that #Bitcoin didn’t sell back down into the 30s like usual. Still above 40k. Sentiment starting to shift… https://t.co/TIrJprHmxW— Steve ⚡ (@decodejar) March 20, 2022

Last week, by contrast, the picture was far gloomier, with research arguing that sentiment could hardly be much lower than it was.Discussing market composition, meanwhile, the dedicated Fear & Greed Index Newsletter last week highlighted the ongoing struggle between bulls and bears at current levels.“The bears have a built a fortress between $40,100 and $42,600,” it read, assessing the need for an “incremental” reassertion of force by bulls up to $42,600.“This breach would wipe out the bears entirely and break their spirit. It’s not an easy task, but if the bulls plan on recapturing their momentum, this would have to be done,” it added.The views and opinions expressed here are solely those of the author and do not necessarily reflect the views of Cointelegraph.com. Every investment and trading move involves risk, you should conduct your own research when making a decision.

Čítaj viac

Bitcoin eyes highest weekly close since early February as BTC price hovers under $42K

Bitcoin (BTC) stayed the near top of its recent trading range on March 20 as the weekly close looked set to crack a multi-week high.BTC/USD 1-hour candle chart (Bitstamp). Source: TradingViewWeekly close could set 4-week highData from Cointelegraph Markets Pro and TradingView showed BTC/USD maneuvering around the upper $41,000 zone Sunday.Friday’s late surge had broadly held, and Saturday saw a return of $42,400 on Bitstamp, matching the high from the start of March.Now, the weekly chart looked set to deliver Bitcoin’s best weekly close since early February.BTC/USD 1-week candle chart (Bitstamp). Source: TradingView”This could change anytime, but frankly the Bitcoin price chart currently looks better than it has for quite a while now,” analyst Lyn Alden summarized at the end of last week.Previous takes had cautioned about a real shift occurring in BTC price action, with popular trader Pentoshi warning that a potential uptick would likely not last and ultimately become the precursor to new lows.Fellow Twitter analyst Credible Crypto meanwhile presented two likely trajectories for BTC/USD based on daily demand holding the market at a specific price.One option involved a break of $42,500 followed by $45,000, while its bearish counterpart delivered a bottom target of $29,000-$32,000.An update to this idea- daily demand held and if we are seeing Option 1 play out- the triangle structure may now actually already be complete. If this is the case, it will become VERY clear in the next couple days. Starting with a break of 42.5k and 45k shortly after. $BTC https://t.co/iSDcDUhpaY pic.twitter.com/RUqs0tzsMI— Credible Crypto (@CredibleCrypto) March 20, 2022On longer timeframes, however, confidence was palpable.”As long as price continues to close above 34k on the W3 timeframe, this hidden bullish div is likely to play out and send us to new ATH,” Credible Crypto added in another update Sunday.Stocks stage a last-minute bouncebackGearing up for another macro week, markets were look altogether stronger despite the headwinds facing Europe and the United States in particular.Related: Bitcoin faces new ‘milestone’ in 2022 as new forecast predicts BTC price ‘in the millions’Despite the ongoing Russia-Ukraine war, European stocks recovered Friday, something which markets commentator Holger Zschaepitz described as “totally crazy.””European stocks have now fully recovered from the shock of Russia’s invasion of Ukraine,” he noted. “Stoxx 600 dropped 10.6% from before invasion on Feb24th to the low point on Mar7. It is now right back where it started, after the biggest weekly rally since Nov 2020.”Should unlikely optimism endure, Bitcoin could profit as its correlation with equities performance persists.

Čítaj viac

Bitcoin spikes to $41.7K highs as Ethereum nears $3K reclaim

Bitcoin (BTC) saw brisk upwards action during the Wall Street trading session on March 18, conforming to predictions that higher levels would see a retest.BTC/USD 1-hour candle chart (Bitstamp). Source: TradingViewBets placed on $46,000Data from Cointelegraph Markets Pro and TradingView followed BTC/USD as it advanced $1,650 from daily lows to nearly matching the $41,700 high from March 16.The move buoyed traders, who began to reinforce their short-term view of levels near the top of Bitcoin’s 2022 trading range being challenged.For popular trader Pentoshi, however, such a result would not mean that BTC/USD had broken its downtrend definitively.”Macro headwinds still too strong but midterm, I think we rally bc seller exhaustion before any shot at new lows or prev lows. So lean towards up then down imo late Q2,” he told Twitter followers on the day.Cold feet over macro conditions, as Cointelegraph reported, became a major issue this week, with multiple predictions of a major drawdown across major assets including BTC coming this year.Analyst Matthew Hyland meanwhile noted that in any case, previous resistance around $40,000 was now increasingly looking flipped to support.Looks like #Bitcoin has been using previous resistance ($40.3k) as new support the past few daysLets see if continues to rally: pic.twitter.com/PkkVYZ1LCG— Matthew Hyland (@MatthewHyland_) March 18, 2022Earlier, Crypto Ed had delivered a near-term forecast of $43,000 for BTC/USD before a potential fresh consolidation period, only then followed by an exit up or down.In a subsequent update, he showed the pair breaking out of a “bull flag” formation in place over recent days. Ether (ETH), however, was a more interesting focus on the day.#BTC Patience is a virtue, but finally breaking out of that bull flag pic.twitter.com/tCH9kVt7W6— Ed_NL (@Crypto_Ed_NL) March 18, 2022

At the time of writing, Bitcoin circled $41,500 with volatility still heightened.All aboard for a summer “altseason?”On the topic of altcoins, the top ten cryptocurrencies by market cap saw varied movements March 18.Related: Bitcoin could see $37.5K weekend dip before ‘bigger move’ next week — new reportETH and Avalanche (AVAX) led the list, each climbing over 5% in 24 hours, but by contrast, other tokens were broadly flat.ETH/USD thus came up on $3,000 once more, having advanced 15% over the past week.ETH/USD 1-day candle chart (Bitstamp). Source: TradingViewThe moves reignited talk of “altseason” appearing, with various commentators arguing for a new golden era for altcoins in the coming months.Popular Twitter account BTCFuel offered the Summer as a potential peak for prices.2/ To assess when the next #altseason peak will happen, I’ll be looking at charts of #Bitcoin, #Ethereum and the dominance of #altcoins of the different past altseasons. By aligning them “correctly” structure-wise, I found this provisional target zone when the peak should happen pic.twitter.com/8H1MyPONiF— BTCfuel (@BTCfuel) March 17, 2022

Čítaj viac

Získaj BONUS 8 € v Bitcoinoch

nakup bitcoin z karty

Registrácia Binance

Burza Binance

Aktuálne kurzy