Autor Cointelegraph By William Suberg

Bitcoin speculators keep BTC price ‘pinned’ below $68.7K: Glassnode

Bitcoin (BTC) recent buyers are the latest hurdle to a breakout from a stubborn trading range in place since June.Key points:Bitcoin short-term holders are keen to sell into range highs as they seek to break even on their investment.BTC price action remains stuck in its near three-month range as a result, Glassnode suggests.Nearly 9% of the BTC supply has a cost basis between $62,000 and $65,000.Bitcoin short-term holders seeking breakeven exitIn the latest edition of its weekly newsletter, crypto analytics platform Glassnode highlighted the ongoing significance of Bitcoin’s speculative investor base.Short-term holders (STHs) — those holding BTC acquired within the past six months — are currently around 7.2% underwater on their investment in aggregate. The cohort’s cost basis, also known as realized price, which Glassnode calculates at $68,700, thus forms a key resistance level to clear.“The cost-basis ladder frames the stalemate. Spot sits just above the Median Realized Price at $63.0K, the level that splits every coin’s cost basis down the middle, and below the Short-Term Holder Cost Basis at $68.7K, the average entry of the market’s most recent buyers,” it wrote. “That cohort is underwater, which historically makes it quick to sell into recoveries, while the median level has absorbed every test from above for more than a month.”Bitcoin realized price data. Source: GlassnodeBTC/USD has been wedged in a narrow range between $58,000 and $68,000 since the start of June. As Cointelegraph reported, a separate battle between buyers and sellers continues within that range, with a 50-month trend line near $65,800 now keeping price even more constricted. Analysis sees this as a classic phenomenon during Bitcoin bear markets, with a downside resolution increasingly likely.This week, trader and analyst Rekt Capital additionally warned that $63,000 was weakening as local support, with price gaining progressively less ground with each rebound from that level.BTC supply dynamics add weight to current spot rangeBitfinex Alpha, the research arm of crypto exchange Bitfinex, noted that a significant portion of the BTC supply has moved onchain during the range-bound period.Related: Bitcoin miners earn under 0.7% of revenue from fees in new 10-year low“The reason the boundaries are so stubborn is due to ownership. The $62,000-$65,000 band holds 1,794,308 BTC at this cost basis, 8.93% of circulating supply per the UTXO Realised Price Distribution (URPD), with the largest holdings at ~$63,800,” it reported on Wednesday.URPD records the price at which coins last moved onchain, with the 1.79 million BTC tranche equal to approximately 8.9% of the total circulating supply.“With price trading inside this band, the largest concentration of holders across any narrow $3,000 range keeps moving between profit and loss and a large volume of coins changes hands as a result,” Bitfinex added.Immediately above the current STH cost basis lies another psychologically significant level — Bitcoin’s old all-time high of $69,400 from November 2021. Bitcoin URPD chart. Source: Bitfinex Alpha

Čítaj viac
Bitcoin eyes $63K as US CPI relief sends September Fed rate pause odds to 60%

Bitcoin (BTC) saw weakness around Wednesday’s Wall Street open as markets reacted to key US inflation data.Key points:Bitcoin ignores good news around US inflation figures as it dips below $63,500.Fed rate-hike odds cool further as attention now switches to Thursday’s PPI numbers.Bitcoin is eroding $63,000 support, the latest market analysis warns.Bitcoin falls despite US inflation data matching expectationsData from TradingView showed BTC/USD dropping below $63,500, erasing the day’s gains.BTC/USD one-hour chart. Source: Cointelegraph/TradingViewUS stocks were calm after the July print of the US Consumer Price Index (CPI) matched expectations, at 0.1% month-on-month and 3.4% year-on-year.“The index for shelter rose 0.1 percent in July, accounting for roughly two-thirds of the monthly all items increase. The index for food also increased 0.1 percent over the month, as the index for food away from home increased 0.3 percent. In contrast, the energy index declined 1.5 percent in July,” an official release from the Bureau of Labor Statistics (BLS) reported.US CPI 12-month % change. Source: BLSWhile not repeating the surprise move to the downside seen in June, CPI inflation avoided injecting volatility into risk assets. Among safe havens, gold remained stable after reaching its highest levels in nine weeks on Tuesday.Fabian Dori, CIO at Sygnum Bank, put the focus on expectations for future Federal Reserve policy changes. Cooling CPI combines with weak labor-market figures to potentially bolster the case for the Fed avoiding interest-rate hikes — an outcome that would benefit crypto and risk-asset liquidity conditions.“An in-line CPI print after Friday’s –23k jobs report points to gradual cooling without a recession scare or a fresh hawkish re-pricing. September rate odds should stay roughly stable, leaving the macro backdrop for risk assets largely unchanged,” he said in emailed comments.The latest data from CME Group’s FedWatch Tool saw 60% odds of the Fed holding rates at the current 3.50-3.75% level at its September meeting — up from 30% a month ago.Fed target-rate probability comparison for September FOMC meeting (screenshot). Source: CME GroupThursday provides the week’s second US macro report with potential implications for market volatility in the form of July Producer Price Index (PPI) numbers, which in June followed CPI in coming in below expectations.“An in-line CPI print does not resolve much after Friday’s payrolls miss. The more interesting detail is that the Bitcoin options market is still charging a material premium for protection” Andrei Grachev, managing partner at DWF Labs, told Cointelegraph. “On the end-August expiry, downside strikes near $60,000 have been costing more than equivalent upside strikes near $70,000.”“Tomorrow’s PPI is the next check on whether that premium starts to ease,” he added.Related: Crypto companies urge AI firms to give Bitcoin developers early accessBTC price $63,000 support “progressively weakening”Discussing BTC price strength, trader and analyst Rekt Capital had more words of caution for Bitcoin bulls. In a post on X, he warned that each bounce from $63,000 was more and more lacking in trajectory. Related: Bitcoin miners earn under 0.7% of revenue from fees in new 10-year low“The progressively weakening support at ~$63k (orange) is clear. 6.27% — > 5.83% — > 3.18% — > and now 1.15% thus far,” he commented alongside an explanatory chart, adding:“At some point the bounces will become so weak that the floor will simply break.”BTC/USD one-week chart. Source: Rekt Capital on X.comRekt Capital previously warned that Bitcoin bear-market history was repeating as its 50-month exponential moving average (EMA), currently at $65,827, had become new resistance.In an update on Wednesday, Bitfinex Alpha, the research arm of crypto exchange Bitfinex, reiterated the strength of the overhead resistance zone.“Equities spent the past two weeks setting all-time highs (ATH) while bitcoin met resistance at the same $65,000-65,500 region level six times. Between 5 and 10 August, the market printed six consecutive daily highs above $65,000 but bitcoin has not recorded a single daily close above that level since 26 July,” it noted.Magazine: Inside the fake crypto startup that fooled North Korean IT workers

Čítaj viac

Bitcoin miners earn under 0.7% of revenue from fees in new 10-year low

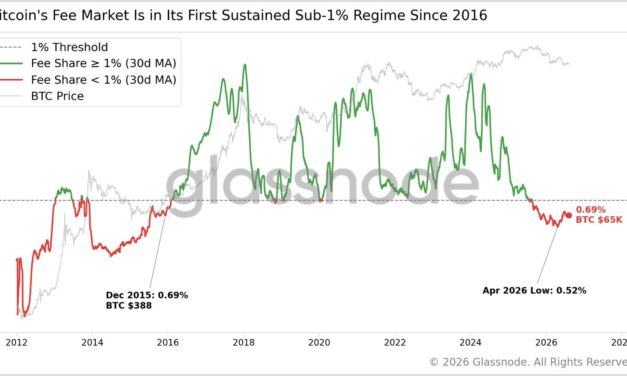
Bitcoin (BTC) transaction fees now account for just 0.69% of miner revenue as major players pivot to AI.Key points:Bitcoin miners now rely on block subsidies more than at any time in the past decade, data shows.Bitcoin hash rate has declined by 33% since October 2025.Analysts warn that miners switching to AI could affect the network.Bitcoin miner fee revenue share returns to 2016 levelsData from onchain analytics platform Glassnode shows that fees as a proportion of miner revenue remain near decade lows after falling to just 0.52% in April.Miners face ongoing pressure as declining Bitcoin prices and rising electricity costs squeeze profits and force smaller players out of the market. Glassnode co-founder Rafael Schultze-Kraft noted that fees had made up less than 1% of miner revenue for almost a year.“Bitcoin was below $400 the last time fee share was this low,” he said on X. Bitcoin fees as a portion of miner revenue. Source: Rafael Schultze-Kraft on X.comWhen transaction fee revenue drops, miners increasingly depend on the fixed block subsidy for income — the amount of newly minted BTC awarded for each mined block, currently 3.125 BTC. Bitcoin’s value has fallen nearly 50% since its October 2025 all-time high, dragging down the US dollar value of the block subsidy and further squeezing miners’ profit margins.The latest data from onchain analytics resource Checkonchain puts the estimated average cost of producing one Bitcoin at $78,254 as of Tuesday — almost 23% above the current spot price.Bitcoin estimated average production cost. Source: CheckonchainBitcoin’s network hash rate, an estimated measure of the computing power securing the network, reflects a mining sector in flux. Hash rate has declined from its October 2025 peak of 1.3 zettahashes per second (ZH/s) to 861 exahashes per second (EH/s), Checkonchain shows — a drop of 33%. Bitcoin hash rate net position change. Source: CheckonchainAnalyst: AI pivot is “concerning development”In analysis published at the weekend, independent analyst William Clemente acknowledged the downturn, while noting that miners would have been incentivized to boost activity through automated difficulty readjustments. With difficulty itself now rising again, miners’ shift toward more lucrative AI computing has become conspicuous.Related: Bitcoin sell pressure ‘closer to exhaustion’ after $4B USDT market-cap drop: CryptoQuant“There is no other way to slice it, hash rate has been in a decline. This has taken place as miner margins got squeezed post 2022 from more competition are higher energy prices, but more importantly the pivot of many into AI/HPC, which so far have shown to be prudent business decisions for the public names that have done it,” he wrote.As Cointelegraph reported, Bitcoin miner CleanSpark recently refocused on AI, switching to operating data centers after missing profit targets. Another miner, Keel Infrastructure, shut down all its US mining operations after revenue fell 50% in the second quarter.“This dynamic has been reinforced as Bitcoin has underperformed AI related assets & the rate of change in demand for compute,” Clemente added.Charles Edwards, founder of hedge fund and AI platform Capriole Investments, directly linked the drop in hash rate to public miners’ AI pivot.“This is the least talked about, concerning Bitcoin development in 2026,” he argued on X, noting that the trend had accelerated since April.

Čítaj viac

Bitcoin drops to one-week low as retail buys gold at highest prices since June

Bitcoin (BTC) headed lower around Tuesday’s Wall Street open as investors’ appetite for gold sent the precious metal to nine-week highs.Key points:Bitcoin takes a backseat as gold steals the limelight climbing to $4,435 per ounce.Analysis eyes the Bitcoin-gold positive correlation still in place.Key resistance near $66,000 keeps BTC price action in check ahead of the US CPI inflation print.Retail investors pile into gold ETFsData from TradingView showed BTC/USD abandoning a low-timeframe rebound to drop back below $64,000.BTC/USD four-hour chart. Source: Cointelegraph/TradingViewThe pair finished down 1.5% on Monday thanks to concerns over the US-Iran war and the latest impasse over the reopening of the Strait of Hormuz oil route. US stocks tracked sideways amid a fresh 5% surge in oil prices.As uncertainty grew, new data showed increasing demand for safe haven gold, which hit $4,435 per ounce on Tuesday, its highest level since June 5. Chinese appetites for the precious metal were already on the radar in August.XAU/USD one-day chart. Source: Cointelegraph/TradingViewTrading resource The Kobeissi Letter highlighted particular interest from the retail sector — currently a key missing component in crypto markets. NYSE ARCA-traded SPDR Gold Shares (GLD) exchange-traded fund attracted daily retail inflows of $50 million on Aug. 5 — the highest single-day tally since mid-March for the largest US physical gold-backed ETF product. The day’s total inflow was $637 million, while the US spot Bitcoin ETFs saw a combined inflow of $244.4 million.“So far in August, investors have added +$1.4 billion to $GLD , putting the ETF on track for its first monthly inflow since February. Investor appetite for gold is back,” Kobeissi Letter said in a post on X.GLD retail-investor netflows data. Source: The Kobeissi Letter on X.comDespite lackluster August BTC price performance, the biggest crypto retained its positive correlation to gold on a 90-day rolling basis, data from onchain analytics platform CryptoQuant showed. “Bitcoin–gold correlation is back to digital-gold-era levels,” CEO Ki Young Ju wrote as an annotation to his data infographics on X.Bitcoin-gold 90-day correlation data. Source: Ki Young Ju on X.comRelated: Bitcoin sell pressure ‘closer to exhaustion’ after $4B USDT market-cap drop: CryptoQuantFamiliar BTC price resistance in place as CPI nearsWithin low time frames, BTC/USD continued to be contained by a long-term trend line, the 50-month exponential moving average (EMA) at $65,827. As Cointelegraph reported, this coincided with an area of potential short liquidations. Since the start of June, the pair has managed just three daily closes above the 50-month EMA.BTC/USD one-day chart with 50-month EMA. Source: Cointelegraph/TradingViewThat’s leading market participants to maintain their monitoring of the zone below $66,000 as rangebound behavior continued.“It’s still stuck in this range, meaning that this recent correction was most likely just a liquidity grab from leveraged longs being positioned in the markets. Consolidation here, and preferably a slight bounce upwards to $64,500 would trigger that we’re not continuing the cascade,” trader and analyst Michaël van de Poppe told X followers on Tuesday.“If there’s a breakout above $65,800, the likelihood of running to $73,000 is there.”BTC/USDT one-day chart. Source: Michaël van de Poppe on X.comWednesday sees the first of this week’s key risk-asset volatility catalysts in the form of the US Consumer Price Index (CPI) print for July. Crypto markets have historically weakened into major US inflation data releases, while July’s soft print sparked daily gains of over 4%. 

Čítaj viac

Bitcoin sell pressure ‘closer to exhaustion’ after $4B USDT market-cap drop: CryptoQuant

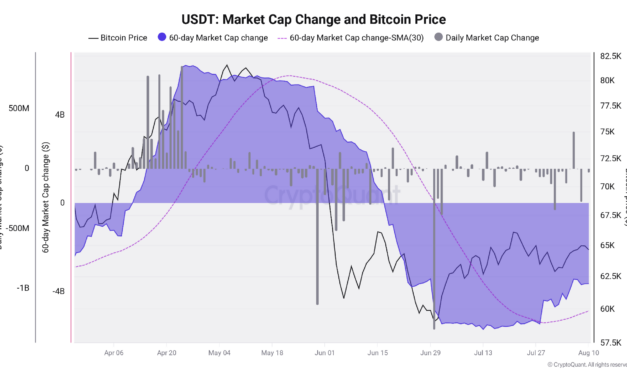
Biggest stablecoin Tether (USDT) has shed $4 billion in market cap in just two months, but history suggests that the downturn is nearly over.Key points:Tether’s 60-day rolling market-cap contraction stays near $4 billion in one of its heaviest drawdowns.Analysis suggests that the worst of bear-market selling pressure could be over as a result.Comparison to 2022 bear-market highlights an ongoing RSI divergence.USDT drawdown puts “acceleration” of Bitcoin selling in doubtOnchain analytics platform CryptoQuant in a blog post last week flagged market cap “undergoing one of its sharpest contractions on record.”“The deterioration has also accelerated at the margin: nearly $870 million of USDT supply disappeared over the latest 11-day period, showing that the contraction is not merely a legacy effect from earlier redemptions,” analysts wrote. CryptoQuant data puts the 30-day simple moving average (SMA) of 60-day USDT market-cap change at minus $4.88 billion as of Aug. 10. USDT 60-day market-cap change vs. BTC/USD. Source: CryptoQuantThe extent of the drawdown echoes crypto bear markets and rivals the largest ever seen. Its severity has implications for Bitcoin and the broader market recovery. Stablecoins provide a key source of liquidity, and when this evaporates, less capital or “dry powder” is available for deployment, showing a lack of interest among investors in stepping in at a given price.“The caution is that correlation between USDT flows and BTC price doesn’t settle causality. Both likely respond to the same risk-off conditions, with redemptions accelerating alongside spot selling rather than strictly ahead of it,” CryptoQuant analysts said. They added:“Periods of sustained USDT expansion have generally coincided with stronger Bitcoin price regimes, while prolonged contractions have accompanied weaker demand, deeper corrections, and deteriorating market conditions.”Expanded USDT 60-day market-cap change vs. BTC/USD. Source: CryptoQuantThe steepest 60-day contraction period for USDT market cap completed on July 13, when it reached minus $5.72 billion.Zooming out, CryptoQuant notes that the most pronounced contraction phases have historically occurred in the final phases of macro market downturns.“Historically, the market’s deepest USDT contraction phases have also marked points where selling pressure was closer to exhaustion than to further acceleration,” it added.Weekly RSI divergence echoes 2022 reversalThe findings add to the mounting body of evidence that suggests the current bear market is in its final stages.Related: Binance Bitcoin volume ratio hits record as futures outweigh spot eight times overAs Cointelegraph continues to report, consensus among market participants increasingly favors a new Bitcoin macro bottom forming before the end of 2026. Both comparisons to previous bear markets and onchain indicators, however, see the downturn continuing in the short term.Independent analyst William Clemente’s Aug. 8 BTC outlook echoed the prognosis while describing the Bitcoin network as “fundamentally healthy.”“I think Bitcoin is ‘cheap’ although we could have a leg lower at some point throughout the year,” he summarized. Two days later, he highlighted an unfolding bullish divergence between BTC/USD and the relative strength index (RSI) on weekly time frames — a classic leading indicator for a market reversal which accompanied the end of the 2022 bear market.BTC/USD one-week chart with RSI divergences marked. Source: William Clemente on X.com

Čítaj viac

Získaj BONUS 8 € v Bitcoinoch

nakup bitcoin z karty

Registrácia Binance

Burza Binance

Aktuálne kurzy