Autor Cointelegraph By William Suberg

Bitcoin hodlers targeting $100K is what's preventing 40% price drawdown, data suggests

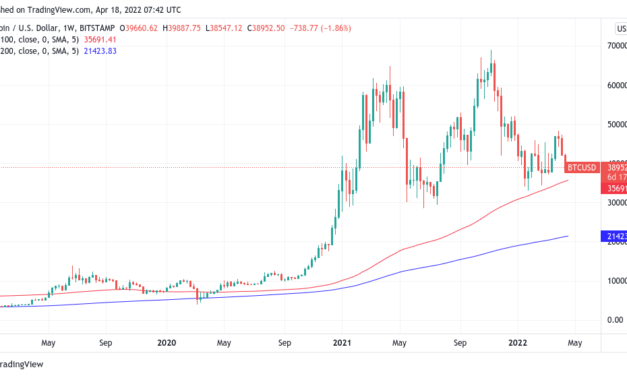
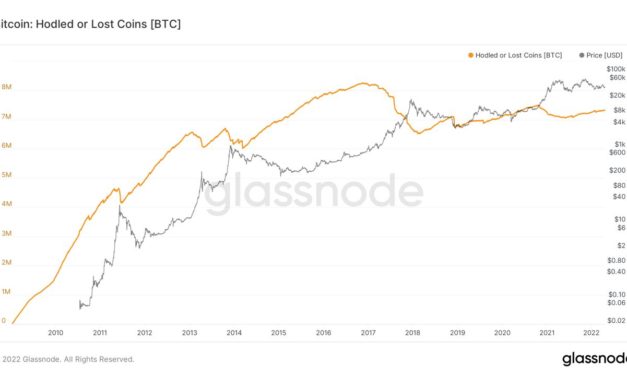
Bitcoin (BTC) dropping to $25,000 or lower is unlikely thanks to hodlers hoping for all-time highs, not speculative traders, new research says.In a series of tweets on April 19, popular analyst Root argued that there is “no real reason” for a dramatic Bitcoin sell-off.No major selling from “maturing” hodlersBitcoin has yet to wow the market with its all-time highs this halving cycle, and this has contributed to a loss of faith among some investors.At the same time, on-chain indicators remain much more bullish than spot price action, and those investors still in the market support the idea that BTC/USD will go far higher in the future.This is thanks to a lack of short-term holders (STHs) on the market, Root notes. Even the most recent all-time highs of $69,000 last November came with relatively few speculatory bets — something which contrasts strongly with the all-time high during the last halving cycle in December 2017.What is more, it is long-term holders (LTHs) hoping for fresh price discovery who are now supporting the market, not new STHs looking to “buy the dip.”“With the HODL Army growing it’s allowing us to make new ATH’s (69k top) without barely any STH’s in the market,” Root explained. “Since we didn’t reach prices above 100K, which so many expected, many still believe this will eventually happen and might therefore hold on to their coins.”Bitcoin hodled or lost coins chart. Source: GlassnodeAs such, Bitcoin’s realized price — the average price at which all coins last moved — at around $25,000 seems an unlikely target thanks to LTHs’ unwillingness to sell. While some chose to do so recently, this was thanks to them buying in at highs earlier in 2021 and wanting to cut their losses, Root continued. More broadly, however, those who purchased during Bitcoin’s first trip above $60,000 have chosen to hodl, not sell.“Conclusion: Some exhaustion coming from the people that bought the run to first 64k peak, but many still holding,” the Twitter thread read. “Older LTH’s mainly holding strong. No real reason to see a drop below realised price.”Bitcoin realized price chart. Source: BuyBitcoinWorldwidePlenty of cold feet over Q2 price actionAs Cointelegraph reported, some market participants remain extremely wary about a capitulation event occurring in the coming months for Bitcoin.Related: BTC could drop to $30K in 2 weeks, trader warns as gold goes for $2K highDriven by macro, this could see $30,000 return, or worse, the 200-week moving average at $21,000 coming in as support.All depends on the United States Federal Reserve and its reaction to inflation, they say, this far from clear thanks to the limited scope for containment measures.Should heavy-handed policy become the norm, however, stocks, commodities and risk assets would be hit hard — heavy headwinds for crypto.The views and opinions expressed here are solely those of the author and do not necessarily reflect the views of Cointelegraph.com. Every investment and trading move involves risk, you should conduct your own research when making a decision.

Čítaj viac

BTC could drop to $30K in 2 weeks, trader warns as gold goes for $2K high

Bitcoin (BTC) is in line for a relief bounce but still risks dropping all the way to $30,000 before May, new analysis warned on April 18.BTC/USD 1-hour candle chart (Bitstamp). Source: TradingView$30,000 dive is April “risk”Data from Cointelegraph Markets Pro and TradingView showed BTC/USD hovering near $39,000 on Monday as bearish prognoses for the pair mounted.After losing $40,000 support overnight into Monday, Bitcoin faced thin liquidity in the absence of United States and European equities trading thanks to the Easter weekend.For popular trader Crypto Ed, a near-term retreat should bottom out at $37,500 before a rebound kicks in.”First need to reclaim $40,000; if we manage that, it’ll certainly give a bullish impulse to the market,” he said in his latest YouTube update.Should that happen, $43,000 could figure as the local high, but going forward, the picture looks bleak. Using Elliott Wave analysis, Crypto Ed predicted a repeat of recent downside moves interspersed with a brief relief bounce. The target, he concluded, was $30,000.”That’s the risk for the coming, let’s say, two weeks,” he added.Popular Twitter account Bitcoin Jack likewise called for the coming weeks to act as a moment of reckoning for longer-term price action.Room for a squeeze up but then heading to the monthly level below in due time is where my thinking is atGuessing early May to decide major trend in to summer time pic.twitter.com/Zo8hARsyo8— //Bitcoin ack (@BTC_JackSparrow) April 18, 2022$30,000 as a target for May or June is nothing new, as Cointelegraph previously reported.Gold strikes out as crypto correlation wanesDespite Bitcoin coming under pressure, there was no sense of pain for safe haven gold on Monday.Related: US dollar strength mimics 2020 Coronavirus crash — 5 things to know in Bitcoin this weekAfter climbing throughout the past week, XAU/USD crept up on the $2,000 mark again, coming within $2 of the resistance level before retreating to around $1,990.Nonetheless, the pair traded at its highest since March 11, giving the U.S. dollar’s own strength a run for its money.”A 50-day correlation coefficient for Bitcoin and gold is around minus 0.4, the lowest since 2018,” journalist Colin Wu noted about the implications of gold and Bitcoin’s diverging price performance. “For now, Bitcoin remains tightly correlated with the Nasdaq 100 index. The Nasdaq 100 is down about 15% this year, while bitcoin has shed some 16%.” XAU/USD 1-day candle chart. Source: TradingViewThe views and opinions expressed here are solely those of the author and do not necessarily reflect the views of Cointelegraph.com. Every investment and trading move involves risk, you should conduct your own research when making a decision.

Čítaj viac

US dollar strength mimics 2020 Coronavirus crash — 5 things to know in Bitcoin this week

Bitcoin (BTC) starts a new week with all quiet on traditional markets but a storm brewing in crypto.As the Easter long weekend continues for the United States and much of Europe, traders are keenly eyeing whether Bitcoin can stay stable for four days without professional investor involvement.So far, the picture has not favored bulls — since Good Friday, BTC/USD has been characterized by sideways action punctuated by episodes of sudden volatility to the downside.That continued overnight into Monday, and now, $40,000 is once again out of reach. What will the atmosphere be like in the coming days?Cointelegraph takes a look at the potential market mover factors in line to influence Bitcoin price performance this week.Holiday cheer costs Bitcoin $40,000It’s a frustrating time for Bitcoin spot traders. Without traditional market guidance, Bitcoin faces four days of “out-of-hours” trading, meaning that liquidity is thinner than normal.This has a habit of making any sudden price moves ripple out and cause large than normal knock-on effects. Should buyer support at a specific price be pulled, for example, panic can set in more easily when there are fewer participants — and less cash — on hand to mitigate it.Such a scenario has played out several times over the Easter weekend already. While mostly trading sideways, BTC/USD saw episodes of sudden downside from which it struggled to recover.Overnight on Sunday, the market dived over $1,000 in a matter of minutes, including an $800 loss in a single one-minute candle.With it came the loss of support at $39,000, data from on-chain monitoring resource Material Indicators confirms.On Friday, Material Indicators noted the block of buyer support immediately below spot price, this now absent and potentially opening up the possibility of a much deeper retracement to come, involving Bitcoin’s 200-week moving average (200 WMA).The 200 WMA currently sits at just above $21,000, data from Cointelegraph Markets Pro and TradingView shows. The level is highly significant, never being broken by spot price during bear markets and continually rising throughout Bitcoin’s history.“50, 100 and 200 Weekly MA are key levels,” Material Indicators meanwhile continued in Twitter comments. “Bull Markets happen when price is above the 50 WMA. The 100 may give a relief rally, but since 2011 it’s never held in a downtrend. The 200 WMA has always marked the bottom + it has confluence with the lifetime support channel.”The 100 WMA “relief rally” site is at $35,740 as of Monday.BTC/USD 1-week candle chart (Bitstamp) with 100, 200 WMA. Source: TradingViewDespite the potentially unreliable holiday price performance, few appeared surprised by the idea that crypto markets en masse are primed for fresh losses.Popular trader Pierre flagged multiple targets hit across altcoins Monday as BTC wobbled, having previously warned that such a downmove would be the “nail in the coffin” for weak tokens.Macro has plenty of surprises up its sleeveWith Western markets closed until Tuesday, there is little scope for a macro-induced move on crypto.Asian markets were mostly flat throughout Monday, with the Hong Kong Hang Seng up a modest 0.67% and the Shanghai Composite Index conversely down 0.67% at the time of writing.Global financial markets, however, are anything but unremarkable this month, as uncharted territory defines the current setup. Surging inflation coupled with rock-bottom interest rates is one such novel feature.For markets commentator Holger Zschaepitz, the focus was on the international bonds markets, these having wiped $6.4 trillion off their value since hitting all-time highs last year.“The biggest bond bubble in 800yrs continues to deflate after rising US inflation data (CPI & PPI) shake up the bond markets. The value of global bonds has dropped by another $400bn this week, bringing total loss from ATH to $6.4tn,” he commented alongside a chart.Global bonds chart. Source: Holger Zschaepitz/ TwitterJapan’s central bank balance sheet expansion, which Zschaepitz previously called the greatest monetary policy experiment “in history,” is meanwhile delivering fresh phenomena in the form of spiking inflation.Inflation is a double-edged sword for Bitcoiners, the tide of rising prices and central bank reactions set to put serious pressure on both stocks and risk assets at first. Only later on, various theories argue, will the tide turn in favor of Bitcoin as a store of value.“The contrast between high equity prices and tame commodities on a 10-year basis may point to greater odds of decreases for stocks,” Bloomberg Intelligence senior commodities strategist Mike McGlone, a proponent of that perspective, wrote in his latest update last week. “The S&P 500 was up about 280% as of the end of 2021, and our rate-of-change graphic shows the index as a top potential reversion risk vs. the Fed.”DXY faces “do or die” decisionOne yardstick for the traditional economy is meanwhile at what could turn out to be a crucial inflection point. The U.S. dollar currency index (DXY), a key measure of dollar strength, is facing a choice between continued upside and a major correction as it lingers at the 100 points threshold.DXY 1-week candle chart. Source: TradingViewIt was a long time coming — the last time that DXY was so bullish was in April 2020 at the height of the coronavirus market shock.DXY has a habit of running in opposition to Bitcoin price, and while that inverse correlation has broken down to some extent in the past year, the odds remain that a major drawdown for USD would be a benefit to BTC.“If we see the DXY roll over again at this trendline be prepared for a strong send,” markets commentator Johal Miles summarized Sunday. “Naturally the FED has key importance here, as any change of course will put pressure on the dollar.”An accompanying chart highlighted the impact of DXY retracements on BTC/USD since late 2014.DXY vs. BTC/USD annotated chart. Source: Johal Miles/ TwitterOn Monday, however, there were no real signs of a reversal, and a brief dip in DXY last week — which coincided with an equally brief rally in BTC — was soon mitigated entirely.“Many calling for corrections on DXY but still looking bullish,” popular chartist Jesse Olson added on the day.Exchange balances lowest since mid-2018What are the more bullish signals coming from Bitcoin in the current environment? Look no further than exchanges for one, as their declining balances point to sustained determination to “hodl” BTC.According to the latest data, not only are buyers continuing to move large tranches of coins off exchanges into cold storage, but those exchanges’ overall BTC balance is now at fresh multi-year lows.Figures from on-chain analytics firm CyptoQuant confirm that the balance of 21 major exchanges was 2.274 million BTC as of Sunday. The last time that the level was so low was in July 2018.Bitcoin exchange reserves chart. Source: CryptoQuantThe impact of such buyer trends has yet to be seen in practice. Despite the available supply declining, a real scramble for BTC has not yet occurred, while sellers have conversely sought to exit at levels approaching $50,000 in recent weeks.The result is a narrow scope of movement for BTC price action as buyers and sellers act in a closely-guarded range. Ki Young Ju, CEO of CryptoQuant, noted the phenomenon playing out last week.As Cointelegraph reported, meanwhile, the likely source of the exchange supply sapping is institutional, rather than retail investors.Crypto sentiment diverges into “extreme fear”Is crypto market sentiment truly indicative of a shock in the making?Related: Top 5 cryptocurrencies to watch this week: BTC, XRP, LINK, BCH, FILBitcoin has been praised as the “only” truly honest market available to investors, and its decline from all-time highs thus foreshadowed this year’s inflationary environment hostile to stocks, commodities and more.Should that hold true, the current state of the Crypto Fear & Greed Index may give investors fresh pause for thought.At 24/100 as of Monday, the Index is back in its “extreme fear” zone, having more than halved since the start of April.Crypto Fear & Greed Index (screenshot). Source: Alternative.meBy contrast, the traditional market Fear & Greed Index is “neutral,” a zone in which it has stayed since exiting the “fear” zone late last month.Fear & Greed Index (screenshot). Source: CNNWhile equally famous for its fickle nature, crypto market sentiment could nonetheless be a warning for those hoping that the good times will continue regardless.The views and opinions expressed here are solely those of the author and do not necessarily reflect the views of Cointelegraph.com. Every investment and trading move involves risk, you should conduct your own research when making a decision.

Čítaj viac

Bitcoin holds $40K over Easter but thin liquidity, 'capitulation' risk haunt traders

Bitcoin (BTC) chose compression over the Easter weekend, sparing nervous traders a fresh dive below $40,000.BTC/USD 1-hour candle chart (Bitstamp). Source: TradingViewDerivatives traders take no risksData from Cointelegraph Markets Pro and TradingView showed BTC/USD acting in a narrowing range with $40,700 as its ceiling Saturday and Sunday.The pair saw little action as the holiday period began, with United States equities markets off from Good Friday onwards, allowing crypto to avoid correlation-based volatility.With Monday likewise a non-trading day, Bitcoin was set for four days of “out-of-hours” trading. While that meant its stocks correlation mattered less, there were other forces at play ready to spook sentiment.Market liquidity stayed lower than on workdays, and while standard, some feared that any sudden moves could be exacerbated as a result of thinner order books.Analyzing derivatives moves over the weekend, Deribit Insights, the research arm of trading platform Deribit, flagged liquidity as one consideration influencing real-time investor decisions.5) So while this could be a bearish bet, it is also likely protective of AUM.But why now?Perhaps they are concerned about Spot/deriv market manipulation over an illiquid weekend.Perhaps just concerned over the next week against falls 40k, but prefer to lose low-cost premium. pic.twitter.com/spNXiurWqr— Deribit Insights (@DeribitInsights) April 16, 2022A slight zoom-out from popular trader and commentator Pentoshi meanwhile delivered a more wary perspective.For him, only a reclaim of levels significantly beyond the current narrow trading range on low timeframes would suffice for a more bullish feeling on what could come next for BTC/USD.”44.5k most important spot for bullish momentum currently. 42k 1D Resistance,” he summarized to Twitter followers on Saturday alongside an explanatory chart. “Below bias is for re-distribution and another leg down. Think buyers need to step in pretty quickly.”BTC/USD annotated chart. Source: Pentoshi/ Twitter100 days until “capitulation”?Pentoshi was meanwhile not the only voice predicting long-term gain but short-term pain for Bitcoin — a narrative, which had gathered momentum throughout 2022.Related: Bitcoin clings to $40K support as focus returns to BTC price ‘supercycle’Analyzing market movements, Kevin Svenson, well known on social media for his bullish sentiment on BTC, warned that current chart behavior was mimicking the period just before Bitcoin’s bear market crash in late 2018.While that event followed a long period of lower lows throughout the year, Bitcoin has been making higher lows in 2022, he noted, but it would not take much for the tables to turn and “capitulation” to enter.”The difference between those higher lows and a breakdown is significant right now, so just being blindly on one side and not considering anything else is a little bit foolish in my opinion,” he said.Discussing why #Bitcoin market psychology is mirroring $6K pre-capitulation. Long Term – Bullish. Medium Term – I see downside risk. pic.twitter.com/reAn6qHg0p— Kevin Svenson (@KevinSvenson_) April 16, 2022

Svenson added that Bitcoin was “getting there” in terms of following a historical pattern of putting in a macro low around 800 days after each block subsidy halving. The last halving — on May 11, 2020 — was 706 days ago.The views and opinions expressed here are solely those of the author and do not necessarily reflect the views of Cointelegraph.com. Every investment and trading move involves risk, you should conduct your own research when making a decision.

Čítaj viac

Bitcoin clings to $40K support as focus returns to BTC price 'supercycle'

Bitcoin (BTC) fooled no one with its criss-crossing of $40,000 on April 15 as traders remained firmly risk-off on BTC.BTC/USD 1-hour candle chart (Bitstamp). Source: TradingViewBitcoin returns to key 2022 Fib levelData from Cointelegraph Markets Pro and TradingView showed BTC/USD bouncing modestly after returning to the $39,500 zone on Thursday.The move erased an impulse move higher from earlier in the week, underscoring the lack of bullish market momentum despite conspicuous demand for Bitcoin among institutional buyers.For popular trader Crypto Ed, there was reason to believe that further downside would soon ensue. Current levels, he warned viewers of his latest YouTube update, did not constitute suitable ground for a long position.”With the upcoming weekend, I would be very careful longing here,” he summarized.In the event, BTC/USD reached around $40,400 before reversing to trade at around $40,150 at the time of writing on Friday.Markets commentator Miles Johal meanwhile noted that the pair was now interacting with the 0.75 Fibonacci level, this having been a support feature throughout 2022.Back to dancing with the 0.75 $BTC pic.twitter.com/dDDVjZSJYa— Miles J Creative (@JohalMiles) April 15, 2022United States financial markets were closed on the day for the Good Friday holiday, sparing crypto traders correlated price moves.Remember the supercycle?Elsewhere, excitement was brewing once again over the concept of Bitcoin being in a so-called “supercycle.”Related: Bitcoin bulls need to reclaim $41K ahead of Friday’s $615M BTC options expiryPreviously also popular, the concept revolves around viewing BTC price action as more than a product of its roughly four-year halving cycles.Doing so, some suggest, explains why Q4 2021 — the year after Bitcoin’s latest block subsidy halving — failed to produce the “blow-off top” common to previous post-halving years.Instead, BTC/USD could just be in a consolidation phase with the majority of its upside still to come.”Interesting. Maybe we never got the blow off top…because it hasn’t happened yet,” Josh Olszewicz, head of research at alternative asset management firm Valkyrie reacted.The supercycle comparison chart was originally posted to Twitter earlier in the week.Bitcoin supercycle chart. Source: Nihkalowz/ TwitterThe views and opinions expressed here are solely those of the author and do not necessarily reflect the views of Cointelegraph.com. Every investment and trading move involves risk, you should conduct your own research when making a decision.

Čítaj viac

Získaj BONUS 8 € v Bitcoinoch

nakup bitcoin z karty

Registrácia Binance

Burza Binance

Aktuálne kurzy