Autor Cointelegraph By William Suberg

Bitcoin sets up lowest weekly close since early March as 4th red candle looms

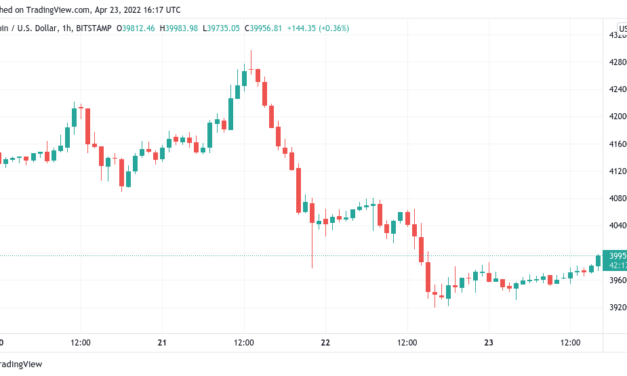
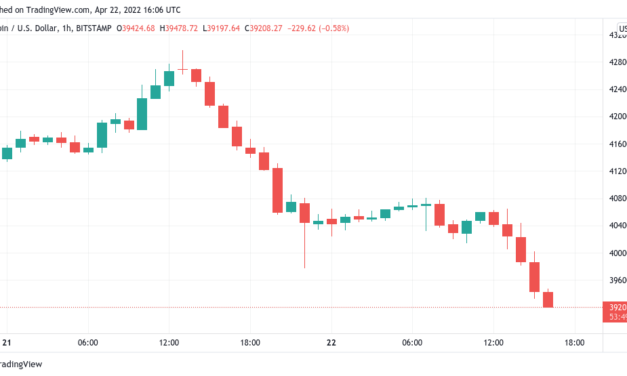
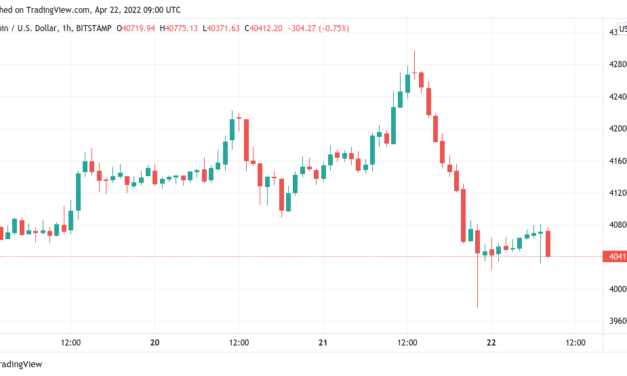
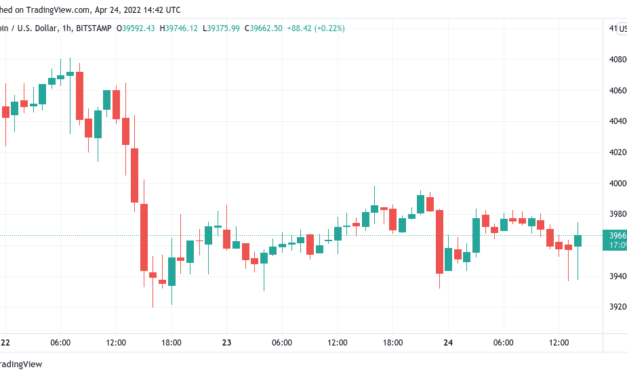
Bitcoin (BTC) stayed below $40,000 on April 24 as the weekly close looked set to be a painful one for bulls. BTC/USD 1-hour candle chart (Bitstamp). Source: TradingViewBinance bids slowly thin below spotData from Cointelegraph Markets Pro and TradingView showed BTC/USD failing to retake the $40,000 mark after losing it before the weekend.As traders braced for classic volatility into the weekly close, Bitcoin looked decidedly unappetizing. At $39,500 on Bitstamp, the spot price at the time of writing would constitute the lowest weekly close since the week of March 7.BTC/USD 1-week candle chart (Bitstamp). Source: TradingView”Pretty obvious uptrend since mid-to-late January imo. If we have our 4th RED weekly close today could be bad though,” Twitter account CryptoBull commented in a discussion with popular analysts Johal Miles and Pentoshi. Four red weekly candles in a row would be a rare event, the account added, noting its absence for the past two years on the weekly chart.”Hasn’t happened since 6/2020. But after that happened we went to up to ATH,” it wrote.Data from on-chain monitoring resource Material Indicators meanwhile showed thinning bids below spot price, which nonetheless continued to retest $40,000 resistance.Binance order book data chart. Source: Material IndicatorsFrance keeps markets on edgeOutside technical signals, attention focused on France Sunday as the Presidential elections came to a close.Related: Bitcoin funding rates show demand to short BTC as $40K becomes resistanceWith incumbent Emmanuel Macron expected to win a second term, warnings nonetheless painted a dire market reaction in the event that his rival, Marine Le Pen, won the presidency.“It would be a terrible day for markets,” Ariane Hayate, fund manager at Edmond de Rothschild Asset Management, told Bloomberg. “The first impact would be on the French 10-year bond yield that could go through the roof.”As Cointelegraph reported, the European Union’s financial fragility has been brought to the fore as inflation soars and central bank balance sheet reductions have yet to kick in.The views and opinions expressed here are solely those of the author and do not necessarily reflect the views of Cointelegraph.com. Every investment and trading move involves risk, you should conduct your own research when making a decision.

Čítaj viac

Bitcoin funding rates show demand to short BTC as $40K becomes resistance

Bitcoin (BTC) consolidated under $40,000 on April 23 as market expectations favored further losses.BTC/USD 1-hour candle chart (Bitstamp). Source: TradingView”Extreme fear” accompanies Bitcoin’s descent to $39,200Data from Cointelegraph Markets Pro and TradingView followed a bearish BTC/USD after the pair touched $39,200 on Friday’s Wall Street open.Falling in line with stocks, Bitcoin now faced the prospect of resistance cementing itself at the $40,000 mark, with traders showing their lack of confidence in a short-term rebound.Data from on-chain analytics site Coinglass confirmed that funding rates across derivatives exchanges were firmly negative into the weekend, suggesting that the majority of market participants expected shorting to be a profitable next trade.BTC funding rates chart. Source: CoinglassFor analyst Filbfilb, co-founder of trading suite Decentrader, the ratio of long to short positions was a furthe cause for concern.Price at $47k: – LS ratio was 1:1Price at $39.5k: – LS ratio = 3.5Ruh-oh. https://t.co/Pazhwgj5vr— filbfilb (@filbfilb) April 22, 2022″Bitcoin back on this crucial level here. Losing this – > $36K seems next,” Cointelegraph contributor Michaël van de Poppe added in a fresh Twitter update on the day.BTC/USD circled $39,800 at the time of writing, having avoided a trip to take buy liquidity below $38,000 so far.Cold feet among traders was meanwhile echoed in sentiment gauges, with the Crypto Fear & Greed Index heading back into the “extreme fear” zone on Saturday.Crypto Fear & Greed Index (screenshot). Source: Alternative.meDXY resistance sought for BTC trend breakDespite the lack of confidence, not everyone was interested in abandoning their faith in Bitcoin beyond the short term.Related: Nasdaq has dotcom crash ‘deja vu’ says trader as Bitcoin correlation rises”Prepare yourself for the next runup. Historically speaking, this has been one of the best ranges for buying Bitcoin!” popular YouTuber Crypto Rover argued alongside a chart comparing Bitcoin price performance to the strength of the U.S. dollar. U.S. dollar currency index (DXY) vs. BTC/USD annotated chart. Source: Crypto Rover/ TwitterAs Cointelegraph reported, the U.S. dollar currency index (DXY) is currently near two-year highs, and a reversal has historically given Bitcoin the fuel to crack long-term downtrends.U.S. dollar currency index (DXY) 1-week candle chart. Source: TradingViewThe views and opinions expressed here are solely those of the author and do not necessarily reflect the views of Cointelegraph.com. Every investment and trading move involves risk, you should conduct your own research when making a decision.

Čítaj viac

Bitcoin follows fresh US stocks dive as analysis 'expects' BTC price to take $37.5K liquidity

Bitcoin (BTC) faced selling pressure at the Wall Street open on April 22 as markets began a rerun of April 21’s losses.BTC/USD 1-hour candle chart (Bitstamp). Source: TradingViewNo let-up for stocks or crypto as losses mountData from Cointelegraph Markets Pro and TradingView showed BTC/USD following a grimly familiar course on April 22, hitting lows of $39,197 on Bitstamp.The previous day had cost bulls $40,000 support, a level tha had yet to cement itself as a meaningful line in the sand at the time of writing.For analytics resource Material Indicators, it was now a case of watching bids getting filled lower down in exchange order books.Between spot and $37,500, there was approximately $100 million in bids waiting on Binance, according to an accompanying chart.”Expecting it to get filled, but watching to see if BTC/USDT liquidity moves to the active buy zone or the buy zone moves to the orders resting on the Binance order book,” Material Indicators commented.BTC/USD order book data chart. Source: Material Indicators/ TwitterU.S. equities showed no signs of slowing their new rout, with the S&P 500 down 1.75% in the first ninety minutes’ trading and the Nasdaq 100 shedding 1.43%.In Europe, the picture was made worse by the bond market sell-off reaching what markets commentator Holger Zschaepitz called “historic proportions.”The European corporate bond market’s ongoing selloff has reached historic proportions, w/high-grade bonds losing a record 8.6% in total return terms since their Aug peak. This is now worse downturn than lows reached during early coronavirus turmoil & the GFC, BBG has calculated. pic.twitter.com/X7Tai3IiU1— Holger Zschaepitz (@Schuldensuehner) April 22, 2022Traders “underestimating failed breakout” Traders were broadly also in a “wait and see” mode when it came to Bitcoin. Cointelegraph contributor Michaël van de Poppe told Twitter followers that BTC/USD was now in a “crucial” area.Related: Nasdaq has dotcom crash ‘deja vu’ says trader as Bitcoin correlation rises”The level has hit. Let’s see how the market will respond from this area on Bitcoin,” he wrote in his latest update.Meanwhile, popular trader Cheds took a more ominous line while examining multi-week price performance.Due to failing to crack the 2022 trading range for good earlier this month, the outlook for Bitcoin may now be more ominous than many cared to believe, he warned on April 22.$BTC my belief is most market participants are underestimating the impact of this failed breakout https://t.co/aREFTXTzYo— Cheds (@BigCheds) April 22, 2022

Bitcoin has no shortage of bearish mid-term price predictions, among them that of former BitMEX CEO, Arthur Hayes, who expects $30,000 to return by June.The views and opinions expressed here are solely those of the author and do not necessarily reflect the views of Cointelegraph.com. Every investment and trading move involves risk, you should conduct your own research when making a decision.

Čítaj viac

Nasdaq has dotcom crash 'deja vu' says trader as Bitcoin correlation rises

Bitcoin (BTC) and its stock market correlation are under fresh scrutiny amid a warning that the Dotcom Bubble is repeating itself in 2022.In a tweet on April 22, popular trader Peter Brandt highlighted similarities between the Nasdaq 100 (NDX) now and twenty years ago.”Deja vu all over again”Bitcoin has shown itself to be highly correlated to U.S. equities this year. In particular, BTC/USD recently became attached to the NDX, which has not passed by some of the industry’s best-known names.As stocks themselves come under pressure from central bank inflation-beating policies, concerns are mounting that the immediate future is anything but rosy for crypto.Brandt, who himself gained attention for predicting some of Bitcoin’s historical price bottoms, now believes that the Nasdaq itself is echoing its performance from the year 2000 — the height of the dotcom crash.Calling it “deja vu all over again,” he uploaded a chart showing the structural similarities.Nasdaq 100 annotated chart. Source: Peter Brandt/ TwitterData from Cointelegraph Markets Pro and TradingView meanwhile shows just how in step Bitcoin and the NDX are this year.As Cointelegraph noted, April 21’s stock sell-off had an immediate knock-on effect on Bitcoin, which briefly dipped below $40,000 and continued to threaten a breakdown on April 22’s Wall Street open.BTC/USD vs. NDX chart. Source: TradingViewLess than a year to run?Zooming out, however, and not everyone believes Bitcoin’s correlated fate will last for long.Related: GBTC premium nears 2022 high as SEC faces call to approve Bitcoin ETFWilliam Clemente, lead insights analyst at mining firm Blockware, specifically gave their relationship less than a year to play out.”Going to go on the record and say that I think we see a decorrelation between Bitcoin and stocks in the next 12 months once this transfer of supply is complete,” he declared. “If/when this occurs, it would be quite reflexive and powerful.”Clemente was referring to what he sees as the transfer of BTC “from correlation trading traditional finance entities to crypto natives, high net worth individuals and forward-looking institutions.””This boring sideways range is an equilibrium of this transfer IMO,” he added in a tweet from April 18.The views and opinions expressed here are solely those of the author and do not necessarily reflect the views of Cointelegraph.com. Every investment and trading move involves risk, you should conduct your own research when making a decision.

Čítaj viac

Bitcoin retests $40K after stocks sell-off meets Fed balance sheet bust

Bitcoin (BTC) headed toward $40,000 on April 22 after a major retracement in equities speared bulls’ latest advance.BTC/USD 1-hour candle chart (Bitstamp). Source: TradingViewBitcoin sheds $3,000 on U.S. stocks plungeData from Cointelegraph Markets Pro and TradingView showed BTC/USD being kept firmly under $41,000 Friday after volatility during the latest Wall Street trading session.Thursday had seen United States markets react sharply to “surging” Treasury yields, the Nasdaq 100 dropping 2% and taking highly-correlated crypto down with it.US stocks fall in a dramatic reversal as yields surge. Nasdaq 100 drops 2% as US 10y yields jump by 7bps to 2.9%. pic.twitter.com/vlgaW9F62C— Holger Zschaepitz (@Schuldensuehner) April 21, 2022With that, Bitcoin briefly lost over $3,000 in a matter of hours, wicking to around $39,800 before recovering.Another macro trigger meanwhile came in the form of the Federal Reserve’s balance sheet reduction finally getting underway. Also set to pressure stocks and risk assets, the move to combat forty-year record inflation was long priced in but was not visible in the data until now.”Looks as if Fed balance sheet expansion has stopped shortly before the $9tn mark is reached,” markets commentator Holger Zschaepitz summarized on the day. “Fed’s total assets have shrunk by $9.6bn to $8,955.9bn. The balance sheet is now equal to 37.3% of the US’s GDP vs ECB’s 83% and BoJ’s 137%.”Fed balance sheet chart. Source: Holger Zschaepitz/ TwitterAs Cointelegraph reported, the European Central Bank (ECB) has yet to show signs of reducing its own balance sheet, itself near $10 trillion.Comments from Fed Chair Jerome Powell served to add additional angst to sentiment, hinting at further key interest rate hikes for May.Crypto traders thus remained cautious, with several noting that the week’s run to near $43,000 had not been accompanied by suitable volume, suggesting its validity was suspect from the start.”Low volume pumps are not to be trusted. They are used for distribution or keeping sellers in control,” popular Twitter trader Roman warned. “We’ve seen many instances of low volume pumps over the last 6 months that all failed at major resistance. Be careful.” That six-month period has seen Bitcoin bulls fail to shift a stiff trading range despite multiple surges within that range.Ethereum risks return to $2,600Thursday’s rout meanwhile spelled additional pain for altcoins, with Ether (ETH) dropping under $3,000.Related: GBTC premium nears 2022 high as SEC faces call to approve Bitcoin ETFETH/USD 1-hour candle chart (Bitstamp). Source: TradingViewIn classic style, the top ten cryptocurrencies by market cap copied Bitcoin’s weakness with daily losses of around 4%.For trader and analyst Rekt Capital, the Ethereum retest was of significance, opening up the door to a deeper comedown to $2,600.Could $ETH dip to $2600 this month?After all, Sept’ 2021 has shown how volatile retests of the black ~$3000 level can be to the downside (Chart 1)Revisiting ~$2600 could still be a possibility if #ETH Weekly Closes below the Ascending Triangle top (Chart 2)#Crypto #Ethereum pic.twitter.com/2cUq9lZvBG— Rekt Capital (@rektcapital) April 21, 2022

The views and opinions expressed here are solely those of the author and do not necessarily reflect the views of Cointelegraph.com. Every investment and trading move involves risk, you should conduct your own research when making a decision.

Čítaj viac

Získaj BONUS 8 € v Bitcoinoch

nakup bitcoin z karty

Registrácia Binance

Burza Binance

Aktuálne kurzy