Autor Cointelegraph By William Suberg

Bitcoin rebounds off 6-week lows amid warning of 'brutal' BTC price bull trap

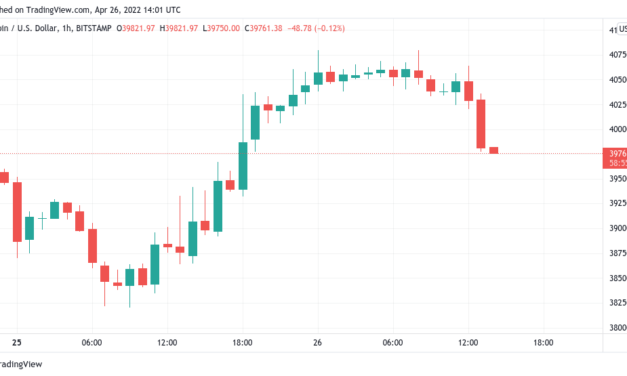
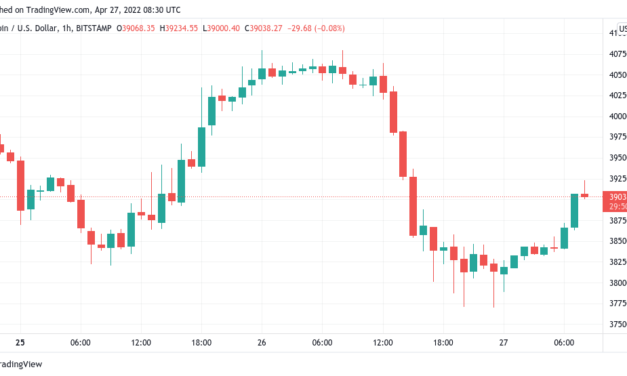
Bitcoin (BTC) reclaimed $39,000 on April 27 after another night of pain saw BTC/USD hit its lowest levels since mid-March.BTC/USD 1-hour candle chart (Bitstamp). Source: TradingView”All assets suffer” at hands of rampant dollarData from Cointelegraph Markets Pro and TradingView showed the largest cryptocurrency trading at $39,200 on Bitstamp at the time of writing, up 2.5%.Tuesday had seen fresh trouble as soon as Wall Street trading began, Bitcoin following stocks downhill once again to hit $37,700 twice.Despite that area already being on the radar as a liquidity grab opportunity, some were far from convinced that the sell-off was done.The current relief, popular trader Kaleo argued, was simply a form of a dead-cat bounce and the real pain would begin when momentum faltered.Dump after this bounce is over with is gonna be so brutal— K A L E O (@CryptoKaleo) April 27, 2022″Well, this price action on Bitcoin isn’t shouting too much for upside, at this point. Tricky as it’s giving back every upwards push again,” Cointelegraph contributor Michaël van de Poppe added.As throughout the week, the U.S. dollar showed no signs of aborting its bull run, adding pressure to crypto as U.S. dollar currency index (DXY) challenged multi-decade highs set in March 2020.”The DXY is reaching higher than my base case, due to policymaker decisions outside of my base case,” Economist Lyn Alden wrote in a Twitter thread about the phenomenon. “Therefore, we need to be aware of the market issues that occur when this happens. It’s no milkshake (eg US increases rates and gets equity buy-in) but rather, all assets suffer.”U.S. dollar currency index (DXY) 1-week candle chart. Source: TradingViewTradFi and crypto feel the fearNerves among crypto and traditional traders alike were thus plain to see, reflected in plummeting market sentiment.Related: Bitcoin repeats rare weekly chart signal that resulted in 50% BTC price dipsThe Crypto Fear & Greed Index reached its lowest level since April 12, which at 21/100 represented “extreme fear” as the guiding market mood.Crypto Fear & Greed Index (screenshot). Source: Alternative.meIts traditional market counterpart, the Fear & Greed Index, until recently lagging crypto in “neutral” territory, also fell into line, recording 27/100 or “fear” on Wednesday.Fear & Greed Index (screenshot). Source: CNNThe views and opinions expressed here are solely those of the author and do not necessarily reflect the views of Cointelegraph.com. Every investment and trading move involves risk, you should conduct your own research when making a decision.

Čítaj viac

Bitcoin fails to hold $40K with traders still hoping for a BTC price relief bounce

Bitcoin (BTC) pierced $40,000 at the Wall Street open on April 26 as its latest relief rally lasted less than 24 hours.BTC/USD 1-hour candle chart (Bitstamp). Source: TradingView$39,500 eyed as BTC safety netData from Cointelegraph Markets Pro and TradingView showed BTC/USD dropping from local highs of $40,800 on April 26.At the time of writing, volatility was in evidence as bulls and bears tussled for $40,000, a level which had been beaten with April 25’s uptick.United States equities contributed to the return of sell-side pressure, with the Nasdaq 100 promptly losing 1.5% on the open and the S&P 500 trading down nearly 1%.For popular trader Crypto Ed, the odds were on for a trip to $39,500 before another relief bounce took the market higher, potentially towards $42,800.#BTC when bounce here, target = $42,800 Wait for bounce, might also drop to the lower box pic.twitter.com/z5YOVHQ1vb— Ed_NL (@Crypto_Ed_NL) April 26, 2022A similar angle came from fellow analyst and trader Rekt Capital, who spied underlying relative strength index (RSI) support as grounds to expect bullish continuation after a possible dip.”BTC may be dipping now but the red diagonal on the RSI suggests that this current rally isn’t over,” he tweeted alongside a chart showing the setup. “$BTC could dip to as low as the red area but should be able to enjoy trend continuation afterwards upon successful retest.”BTC/USD annotated chart with RSI. Source: Rekt Capital/ TwitterAs Cointelegraph reported, RSI has been responsible for various short-timeframe breakouts on BTC/USD in recent months.Dogecoin holds Twitter-inspired gainsOn altcoins, it was Dogecoin (DOGE) once again leading the pack, with its latest gains propelling it back into the top ten cryptocurrencies by market cap.Related: Dogecoin price risks 40% correction despite Elon Musk-Twitter euphoriaFamous as his pet crypto asset, DOGE had profited from Tesla CEO Elon Musk closing a deal to buy Twitter, and DOGE/USD was up 11% in 24 hours at the time of writing.DOGE/USD 1-hour candle chart (Binance). Source: TradingViewAlso performing well was Terra’s LUNA token, while largest altcoin Ether (ETH) copied Bitcoin in failing to hold major support, this time at $3,000.On monthly timeframes, however, ETH/USD was still holding up, Rekt Capital argued, despite the low-timeframe weakness.$ETH is positioning itself for a bullish Monthly CloseStill holding the key black ~$3000 support well#ETH performed a downside wick to ~$2800 recently even though it could’ve wicked to as low as ~$2600 and still maintain its macro uptrend#Crypto #Ethereum pic.twitter.com/xf1Vhsu3L4— Rekt Capital (@rektcapital) April 26, 2022

The views and opinions expressed here are solely those of the author and do not necessarily reflect the views of Cointelegraph.com. Every investment and trading move involves risk, you should conduct your own research when making a decision.

Čítaj viac

Bitcoin repeats rare weekly chart signal that resulted in 50% BTC price dips

Bitcoin (BTC) is facing a rare chart phenomenon that has historically resulted in 50% price drawdowns, new data shows.In a tweet on April 25, popular account Nunya Bizniz noted a fresh warning sign from two key moving averages on BTC/USD.Analyst: BTC could spend 6 months recovering from dipFor only the third time in its history, Bitcoin’s 20-week and 50-week moving averages (WMAs) have both started to slope downwards.While that may look harmless at glance, the result of the first two events — in late 2014 and late 2018 — was BTC/USD losing over 50%.BTC weekly:On 3 occasions the slope of both the 20 & 50ma turned negative.The first 2 lead to 50%+ corrections.This time? pic.twitter.com/eIMsQ6dk8H— Nunya Bizniz (@Pladizow) April 25, 2022Both came at similar points in Bitcoin’s four-year halving cycles, and while slightly ahead of time, it has now been nearly as long since the 2018 dip that bottomed out at $3,100.“I think this chart draws valid parallels,” longtime commentator and macro investor Tuur Demeester commented on the findings. “If bitcoin could not capitulate this time and hold above $35k, it would be an incredibly bullish sign. My base case scenario however, given how weak global markets look, is a downwards slide and 3-6 months of price recovery.”BTC/USD 1-week candle chart (Bitstamp) with 20WMA and 50WMA. Source: TradingViewIn mid-March, the 20-WMA crossed under the 50-WMA, data from Cointelegraph Markets Pro and TradingView shows, in what is commonly known as a “death cross” move among chartists. Despite its name, the phenomenon has not always resulted in significant losses.Dollar strength sparks increasing suspicionAs Cointelegraph recently reported, consensus continues to form over a protracted period of price weakness for Bitcoin, which should come in line with a correction on heavily-correlated global stock markets.Related: Bitcoin spoofs $39.5K breakout at Wall St open as Elon Musk Twitter takeover nearsThe strength of the United States dollar in the face of anti-inflation maneuvers by the Federal Reserve is also in focus as a preemptive warning sign for those forecasting a shock event after two years of liquidity printing.“DXY approaching multi-decade highs,” analyst Dylan LeClair continued in a fresh Twitter thread on the topic on April 24.“The USD continues to strengthen against foreign fiat currencies, tightening financial conditions. A breaking point for a historically over-leveraged economic system is approaching, by design.”U.S. dollar currency index (DXY) 1-week candle chart. Source: TradingViewFor LeClair, it is very much a case of short-term pain, long-term gain for BTC hodlers. The recovery will come via a “pivot” by the Fed, which will be unable to sustain inflation-busting monetary tightening for long.“Fed will eventually be forced to switch back to easing, as a deep global recession will follow any sustained period of monetary tightening,” he forecasted. “Supply chain wreckage from Ukraine conflict & China lockdowns with this level of global indebtedness = sovereign defaults. BTC will fly.”The views and opinions expressed here are solely those of the author and do not necessarily reflect the views of Cointelegraph.com. Every investment and trading move involves risk, you should conduct your own research when making a decision.

Čítaj viac

Bitcoin spoofs $39.5K breakout at Wall St open as Elon Musk Twitter takeover nears

Bitcoin (BTC) saw a classic “fake out” move on April 25 as volatility kept traders firmly on edge. BTC/USD 1-hour candle chart (Bitstamp). Source: TradingViewTraders stay gloomy on BTC outlookData from Cointelegraph Markets Pro and TradingView showed BTC/USD briefly climbing almost $1,000 as April 25’s Wall Street trading session began.The move was short-lived, the pair coming back down to where it started within an hour after hitting local highs of $39,517 on Bitstamp. April 25 had begun with a whimper for Bitcoin bulls, who lost ground on the weekly close and failed to avoid $40,000 flipping to resistance on daily timeframes.For popular trader Crypto Ed, $30,000 was still on the table as a potential short-term target. “To me, it seems any bounce we see in the coming days is a shortlived bounce,” he said in his latest YouTube update, forecasting a “red week.”Crypto Ed added that a push above $40,500 would provide a reason to be “slightly bullish.”Downside momentum had increased after Asian stocks lost heavily over Coronavirus concerns in China. European markets fared better on the open, while in the United States, the Nasdaq 100 even managed to start gaining in the second hour of trading.The S&P 500 was still down 0.43% at the time of writing, nonetheless attempting to make up for lost ground.BTC went for another pop as NASDAQ is bouncing/reliefing a bit harder here.The fight for $39,500 area on BTC will be crucial imo. pic.twitter.com/NTAvYn8Soh— 8,731-541 (94.1%) / #1 CRYPTO SIGNALS/ DM OPEN (@BinanceKiller) April 25, 2022Popular Twitter account John Wick meanwhile voiced caution about making any trades up or down based on current price action.”Waiting this out was a good decision. Still no viable long setup. We have not made lower lows though. Same range for now,” he told followers on the day.”There is however a squeeze forming. We’ll have to wait for the resolve of the breakout.”BTC/USD annotated chart. Source: John Wick/ TwitterDogecoin an early winner in Musk Twitter dealHelping buck the shaky ground for tech stocks was Twitter itself, which added 5% on the open after news that executives were likely to accept Elon Musk’s buyout bid.Related: ‘Something sure feels like it’s about to break’ — 5 things to know in Bitcoin this weekAfter previously voicing opposition, Twitter’s board could agree the deal, which would see Musk acquire the company for $43.4 billion, later April 25. That would equate to $54.20 per share compared to the current spot price of $50.36.”I think there’s a lot of frustration everywhere in the world right now that’s circulating about and you see that reflected on Twitter; this is indicative of that,” MicroStrategy CEO Michael Saylor told Bloomberg.”It’s a bit above my pay grade to determine how the entire chapter ends; it definitely makes for interesting watching.”He added that he “wouldn’t mind” if Musk were to own Twitter.Musk is known for being fond of Dogecoin (DOGE) and critical of Bitcoin’s alleged environmental problems, a perspective that contrasts starkly with former CEO Jack Dorsey’s. Saylor said that he had not spoken to Dorsey about the takeover.DOGE/USD was up 5% on the day at the time of writing, making it the best mover in the top twenty cryptocurrencies by market cap.DOGE/USD 1-hour candle chart (Binance). Source: TradingViewThe views and opinions expressed here are solely those of the author and do not necessarily reflect the views of Cointelegraph.com. Every investment and trading move involves risk, you should conduct your own research when making a decision.

Čítaj viac

'Something sure feels like it's about to break' — 5 things to know in Bitcoin this week

Bitcoin (BTC) starts a new week in an uncertain place facing uncertain times — is $40,000 now resistance?The largest cryptocurrency has just closed a fourth red weekly candle in a row, something that has not happened since June 2020. As cold feet over the macro market outlook continues to be the norm, there seems little to comfort bulls as the week gets underway — and Bitcoin is not done selling off yet.On the back of $4,000 in losses over the past four days alone, price targets now focus on retests of liquidity levels further towards $30,000. It is not all doom and gloom — long-term hodlers and key participants such as miners are showing a more positive stance when it comes to Bitcoin as an investment.With that in mind, Cointelegraph takes a look at the forces at work when it comes to shaping BTC price action in the coming days.Asia woes overtake French election relief The key external event for risk assets at the start of the week is the French election, this being won by incumbent Emmanuel Macron.A sigh of relief for market players concerned about a surprise victory from far-right rival Marine Le Pen, Macron’s second term is expected to lift French stocks in particular on Monday’s open and the embattled euro along with them.The European Union, much like the United States, faces a potent cocktail of inflation and plummeting bond markets, with the European Central Bank (ECB) nonetheless not yet taking decisive steps to raise interest rates or reduce its near $10 trillion balance sheet.Bitcoin was unmoved at the Macron victory, and risk assets are already contending with an Asia downturn on Monday as Coronavirus in China rattles sentiment.The Hang Seng index in Hong Kong is down 3.5% on the day so far, while the Shanghai Composite has shed 4.2%.With crypto en masse heavily correlated to stock market movements currently, a repeat performance by Europe and the United States would produce clear directional cues.“The worry is the current policy support that the government has already put in place may not be effective because of the Covid policies as activities are subdued,” Jenny Zeng, co-head of Asia Pacific fixed income at global asset management firm AllianceBernstein, told Bloomberg.Even before Monday’s losses, the past week was already painful for equities, as noted by markets commentator Holger Zschaepitz.“Global stocks lost $3.3tn in mkt cap this wk as US equities – after peaking Thur morning – experienced steady fall lower as investors seem to reconsider why they have been buying risk assets in world filled w/so much uncertainty,” he told Twitter users Sunday. “Global stocks worth $107.6tn, equal to 127% of GDP.”Bloomberg global stock market cap chart. Source: Holger Zschaepitz/ TwitterA further post flagged the so-called Buffett Indicator — the ratio of total U.S. stock market valuation to GDP — still being in what he called “problematic” territory at over 100%.Dollar strength is back with a vengeanceOne component of the macro landscape firmly in bullish mode — to the chagrin of crypto traders — is the U.S. dollar.The U.S. dollar currency index (DXY), after wobbling at two-year highs last week, now looks to be continuing its uptrend.At 101.61 at the time of writing, DXY is challenging its performance from March 2020, when the Coronavirus crash sent assets worldwide tumbling.Dollar strength has rarely been a boon for Bitcoin, and the inverse correlation, while criticized by some, appears to be firmly in control this month.BTC/USD 1-week candle chart vs. U.S. dollar currency index (DXY). Source: TradingView”Looks like the DXY dev announced a token burn or something,” popular trader Crypto Ed joked in response to the latest move.For Preston Pysh, host of the Investor’s Podcast Network, something does not seem right.”We got the BoJ implementing Yield Curve Control while the Yen is collapsing and we have the FED about to hike 50bps while the dollar is making new highs,” he warned Monday. “Something sure feels like it’s about to break…”Weekly chart prints fourth straight red candleBitcoin is looking anything but rosy this Monday. While the weekend managed to avoid significant volatility, the weekly close still disappointed, coming in at just under last week’s level.This nevertheless means that there are now four red candles in a row on the weekly chart, something that Bitcoin has not seen since June 2020, data from Cointelegraph Markets Pro and TradingView shows.The downtrend then continued overnight to see BTC/USD fall below $39,000, a position it maintains at the time of writing.BTC/USD 1-week candle chart (Bitstamp). Source: TradingViewTraders are eyeing various chart features for clues as to where the pair is headed next, but bullish inklings are decidedly few and far between.For popular trader and analyst Rekt Capital, it is the Ichimoku cloud looming overhead that would cause further losses for Bitcoin.During Retest 1 #BTC fake-brokedown from the Cloud before reversingDuring Retest 2 $BTC wicked sub-Cloud before reversingNow retest 3 is in progressBTC needs to reclaim Cloud as supportIt’s crucial BTC doesn’t flip Cloud into resistance to avoid downside#Crypto #Bitcoin https://t.co/dDLtWwzuTn pic.twitter.com/NQfEbS3nAH— Rekt Capital (@rektcapital) April 24, 2022Popular analyst Cheds, author of Trading Wisdom, meanwhile eyed a potential crossing under the 200-period moving average on the three-day chart. This would be significant, he argued over the weekend, as the last time that this happened after a bull run was the bear market bottom of 2018.“Not a prediction just an observation,” he cautioned.On the topic of December 2018 and its $3,100 floor, Matthew Hyland, known as Parabolic Matt on Twitter, produced further comparisons between that period and current BTC price action.On longer timeframes, he said, holding $37,600 is now “crucial.”#Bitcoin comparison of the 2018/2019 Bear Market Bottom compared to the current structure BTC has been in since January of this year✅Similar Time Frame✅Series of Lower Highs and Higher Lows✅Creation of a higher high✅Pullback after first higher highCrucial $37.6k Holds pic.twitter.com/kzQhvZUTMr— Matthew Hyland (@MatthewHyland_) April 23, 2022

“Looking for that sweep down, at which point i will then be looking for signs of a relief rally to play off from,” fellow Twitter pundit Crypto Tony meanwhile added Monday as part of his own analysis.Hodlers put in a new recordThe “choppy” nature of lower timeframe price action on Bitcoin makes it an uninspiring trade for anyone but the most experienced players.As such, it is perhaps little surprise that the majority of hodlers are choosing to stay hands-off and do what they do best.That is now reflected in on-chain data, which shows that the proportion of the Bitcoin supply that has stayed dormant for at least a year is now at all-time highs.Citing figures from on-chain analytics firm Glassnode, economist Jan Wuestenfeld noted that this translates to the supply more broadly becoming “older” — proportionally, more coins are being hodled for longer rather than spent.According to Glassnode, the supply now dormant for a year or more has broken 64% for the first time on record.The percentage of the #Bitcoin supply last active 1+ years ago just crossed 64% for the first time ever! The percentage of old coins continues to trend up. ↗️ pic.twitter.com/Zyj0hyqFti— Jan Wüstenfeld (@JanWues) April 24, 2022

HODL Waves, a Glassnode indicator showing hodled coins of all ages, meanwhile confirms the trend. Since December 2021, the 1-2 year supply slice has increased more than any other — from under 10% then to nearly 15% as of this week.The 3-5 year band of hodled coins also increased its presence in Q1.Bitcoin HODL Waves chart. Source: Unchained CapitalFundamentals still point to the moonIt is not just casual steadfast hodlers who are stubbornly refusing to reduce their BTC exposure despite the grim outlook.Related: Top 5 cryptocurrencies to watch this week: BTC, DOT, XMR, APE, CAKEA look at Bitcoin’s network fundamentals shows that miners are also anything but bearish when it comes to investing.A frequent story this year but nonetheless an impressive one given that price is moving in the opposite direction, Bitcoin’s network hash rate and difficulty are both due to make new all-time highs this week.Depending on price performance, difficulty should adjust up by around 2.9% in two days’ time, setting a new record of 29.32 trillion in the process.Underscoring the competition to participate in mining, difficulty joins hash rate — an estimate of the processing power dedicated to the blockchain — which is already at its highest ever.Estimates vary by source, but raw data from MiningPoolStats underscores the “up only” trend when it comes to hash rate — a key trigger, some argue, for subsequent bullish price performance.Bitcoin hash rate chart (screenshot). Source: MiningPoolStatsThe trend of increasing hash rate is nothing new, meanwhile, having been long forecast as investment continues to grow. As Cointelegraph reported, as of early April, 20% of Bitcoin mining was being undertaken by publicly-listed companies.The views and opinions expressed here are solely those of the author and do not necessarily reflect the views of Cointelegraph.com. Every investment and trading move involves risk, you should conduct your own research when making a decision.

Čítaj viac

Získaj BONUS 8 € v Bitcoinoch

nakup bitcoin z karty

Registrácia Binance

Burza Binance

Aktuálne kurzy