
Autor Cointelegraph By William Suberg

Bitcoin hits $64K as gold gains while oil shakes off Trump Oman threat

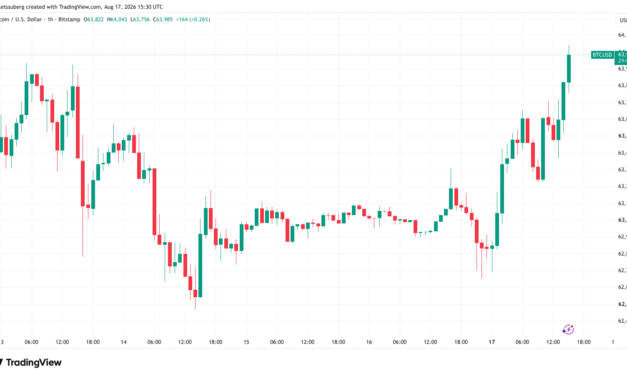
Bitcoin (BTC) returned to $64,000 after Monday’s Wall Street open as US stocks gave way to gold.Key points:Bitcoin continues a rebound from Sunday’s weekly close, gaining 2% on Monday.Oil stays steady after US president Donald Trump threatens to bomb Oman over the Strait of Hormuz.Bitcoin funding rates hit 20-month highs of 0.022 last week, data reveals. Bitcoin inches up as US-Iran rhetoric spreads to OmanData from TradingView showed BTC/USD up by more than 2% on the day, rebounding from Sunday’s weekly close. BTC/USD one-hour chart. Source: Cointelegraph/TradingViewUS equities turned lower as an agreed 60-day ceasefire between the US and Iran was set to expire, with the S&P 500 index down 0.5% from Thursday’s all-time highs. S&P 500 one-hour chart. Source: Cointelegraph/TradingViewSpeaking to Fox News, Trump threatened Oman with military action amid an ongoing dispute over the reopening of the Strait of Hormuz oil route.“If Oman gets in the way, we’ll bomb the s*** out of them,” he told the network.Oil markets appeared unfazed by the tensions, with WTI crude flat at $82.35 per barrel at the time of writing.Safe haven gold was more volatile, gaining just over 1% to start the week to reach a daily high of $4,427 per ounce. Earlier, Cointelegraph reported on a combination of retail and government interest fueling gold’s multiweek highs.XAU/USD one-hour chart. Source: Cointelegraph/TradingViewData from investment research platform Bytetree tracking the 30-day change in inflows to gold-backed exchange-traded funds (ETFs) put the figure at nearly $12 billion through Aug. 13.In a note on Monday quoted by Investing.com, Bank of America strategist Michael Hartnett wrote that long gold remained the trade, describing it as “still [sic] best hedge against dollar debasement, bond collapse, asset inflation, capitalist populism vs socialist populism politics of 2020s.”Related: BTC price loses 200-week trend line as 2022 repeats: Five things to know in Bitcoin this weekFunding rates hit levels not seen since late 2024In its latest Market Color bulletin published on Monday, trading company QCP Capital noted Bitcoin’s continued ability to weather macro tailwinds without a major breakdown from its current range.“Rather than treating individual price levels as directional signals, the more useful observation is that BTC remains close to the lower end of its recent range. A sustained move outside that range would provide more information about market positioning than the relatively contained moves seen within it,” it wrote.Earlier, Cointelegraph reported on expectations that a return to $61,000 would trigger an unwinding of BTC long positions, adding to downside BTC price momentum.The latest data from CoinGlass showed liquidations remaining muted as BTC/USD returned toward $64,000, with 24-hour cross-crypto liquidations at $180 million.Crypto liquidation history (screenshot). Source: CoinGlassIn a sign of long BTC becoming an increasingly crowded trade, derivatives market funding rates hit 20-month highs of 0.022 on Aug. 14, per data from onchain analytics platform CryptoQuant.“The derivatives market sentiment is positive within the current BTC price range, indicating that most traders are taking long positions,” it commented on the readings.CryptoQuant previously noted that futures trading volume on Binance was outweighing spot markets by almost eight times.Bitcoin funding rates chart. Source: CryptoQuant

Čítaj viac
BTC price loses 200-week trend line as 2022 repeats: Five things to know in Bitcoin this week

Bitcoin (BTC) is starting the new week at around $63,000, but bear-market history continues to repeat with weekly close below a key long-term trend line.Key points:Bitcoin has been trading in a range between $57,700 and $67,300, but last week’s close came with a drop below the key 200-week moving average at $64,216.Markets are pricing in near-70% odds of a hold by the Federal Reserve in September, as July meeting minutes are due this week.Japan Q2 GDP figures fall short of expectations at 1.1% as analysis warns of “global tightening” that could impact Bitcoin and risk assets. Bitcoin sees weekly close below 200-week moving averageBitcoin price action enjoyed a modest rebound after Sunday’s weekly close, seeing local highs of $63,655 on Bitstamp.BTC/USD one-hour chart. Source: Cointelegraph/TradingViewData from TradingView shows BTC/USD continuing to tread water as the week begins, failing to challenge either side of a narrow trading range.Analyst Benjamin Cowen, however, drew attention to the fact that BTC/USD is now back below its 200-week simple moving average (SMA). As Cointelegraph reported, this moving average was a defining feature in the 2022 bear market, when it turned resistance in August before BTC entered its long-term bottoming phase.“What is interesting is how in both summer 2022/2026, Bitcoin capitulated below the 200W SMA, then bounced, then gave it up in mid-August,” he wrote in a post on X.BTC/USD one-week chart with 200 SMA. Source: Cointelegraph/TradingViewCommenting, trader and analyst Rekt Capital added that price had failed to reach his own weekly-close target of $63,220, thus positioning for further downside in future.“A rejection from $63,220 would fully confirm the breakdown and send price lower within the current ~$58,000-$66,000 Range (blue-blue)” he told X followers alongside an explanatory chart.BTC/USD one-week chart. Source: Rekt Capital on X.comFed minutes due amid policy dissentFriday sees the release of preliminary Purchasing Managers’ Index (PMI) data for the manufacturing and services sectors. The data has recently been in an uptrend diverging from relatively weak employment figures, which have seen several months of downward revisions. Last week’s Consumer Price Index (CPI) and Producer Price Index (PPI) releases, meanwhile, painted a softer-than-expected picture of US inflation trends.  This sparked a rethink on future interest-rate hikes by the Federal Reserve. The latest data from CME Group’s FedWatch Tool shows near-70% odds that the Fed will hold rates at their current 3.50-3.75% range, compared with 42% odds a month ago.Fed target-rate probability comparison for September FOMC meeting (screenshot). Source: CME Group“A pair of reports showing moderating inflation is helping keep the outlook for monetary policy from turning too hawkish,” trading resource Mosaic Asset Company summarized in analysis released on Sunday.Mosaic noted that while CPI came in at 3.4% year-on-year, this was still far above the Fed’s 2% target — a goal that chair Kevin Warsh continues to state will be achieved. On Wednesday, the Fed will publish the minutes of its July meeting.  Rate hikes were paused in the prior meeting with the largest split among officials over the move since 1970.Last week, Cleveland Federal Reserve Bank president Beth Hammack, who was one of three dissenting voices calling for a 0.25% rate hike in July, questioned whether public patience would tolerate it if the return to 2% rates took several years.“Maybe we’d get there, but if it takes another three to four years to get there, is that OK? Is that enough?” she said at an event with the Dayton Area Chamber of Commerce in Kettering, Ohio, quoted by Bloomberg.Japan on the radar as GDP disappointsJapan’s central bank is on the radar for risk-asset traders this week after Q2 GDP figures significantly missed expectations. Quarter-on-quarter and year-on-year GDP increased 0.3% and 1.1%, respectively — below the anticipated 0.5% and 2.0%.The timing of the print comes as markets see the Bank of Japan (BoJ) hiking rates from current 1.0% levels in September amid surging bond yields and continued weakening in the yen. Previously, Cointelegraph reported on a rare joint intervention in yen currency markets by Japan and the US after JPY/USD weakened to new 40-year lows.BoJ interest-rate probabilities (screenshot). Source: RateProbabilityThe GDP print, meanwhile, included the first drop in private consumption in eight quarters, signaling that existing stimulus measures were failing to prop up consumer confidence.“The boost to consumption from policy measures is already fading, and inflation will increase in H2 as firms will pass on increased costs, deteriorating consumers’ purchasing power,” Norihiro Yamaguchi, lead Japan economist at Oxford Economics, told CNBC.The yen avoided major volatility on the back of the GDP data, lingering near 159 per dollar on Monday.USD/JPY four-hour chart. Source: Cointelegraph/TradingViewResponding to the aftermath, Axel Adler Jr., a contributor to onchain analytics platform CryptoQuant, noted potential implications for risk assets to come. Japan’s 10-year bond yield hit 2.93% on Monday, its highest levels since 1996.“For now, this is not a signal to sell risk assets. But the market is approaching an important point: JGB > 3% + further BOJ rate hikes + a stronger yen + rising US Treasury yields,” he wrote in an X post. “If these factors align, Japan’s rate normalization could turn into a global tightening of financial conditions and hit stocks and Bitcoin.”Japan 10-year bond yields one-day chart. Source: Cointelegraph/TradingViewBitcoin forgotten as consumer sentiment lows contrast with stocks gainsRising stocks paired with record-low consumer sentiment are flashing a new warning sign for Bitcoin, which is increasingly being overlooked.In the latest edition of its regular newsletter, The Week Onchain, crypto analytics platform Glassnode revealed a striking divergence between Bitcoin and equities in terms of sentiment.“Consumer Confidence remains among the weakest readings of the past decade even after two consecutive improvements, while the US Stock Market Index set a fresh all-time high on August 7 and holds just beneath it,” it summarized.The softer US inflation prints helped send the S&P 500 to all-time highs of 7,816 on Thursday. At the same time, the consumer sentiment survey by the University of Michigan is expected to drop 7.6% in August.“Weak sentiment next to record prices looks like a contradiction until the driver is named: households that expect living costs to rise and the economy to soften are moving out of cash and into assets. The equity market, carried above all by the AI trade, is where that capital lands,” Glassnode commented.US consumer sentiment data. Source: University of MichiganBitcoin continues to be left out of this capital rotation. A sign of change, Glassnode argued, would be a sustained rebound in institutional inflows to the US spot Bitcoin exchange-traded funds (ETFs).Last week, these saw net outflows of $267.2 million, per data from UK-based investment company Farside Investors. Just one out of five trading days finished with net inflows, totaling a mere $7.8 million.US spot Bitcoin ETF netflows (screenshot). Source: Farside InvestorsExchange BTC reserves grow with whale inflows in focusBitcoin supply dynamics are the latest troubling feature for its price trajectory, CryptoQuant analysis reports.Related: Here’s what happened in crypto todayWhales have started to dominate exchange inflows, exacerbating an existing absence of retail interest and causing exchange BTC reserves to reverse higher. Binance’s whale ratio reached 0.71 on Aug. 10, its highest since early March. “Exchange deposits do not necessarily mean immediate selling, but they increase the amount of BTC available for trading or hedging,” CryptoQuant commented.Binance exchange whale ratio. Source: CryptoQuantBinance’s BTC reserves totaled 674,332 BTC on Sunday, up 2.57% month-to-date and at their highest since November 2025.“The long-running trend of BTC leaving exchanges may therefore be weakening,” CryptoQuant continued.Binance BTC reserves. Source: CryptoQuantAs Cointelegraph reported, exchange activity has been driven by derivatives markets as BTC/USD trades in a tight range since early June. On Binance, futures trading volume was eight times that of spot markets in early August.

Čítaj viac

Bitcoin price drops to $62.5K as trader warns weekly close may spark more losses

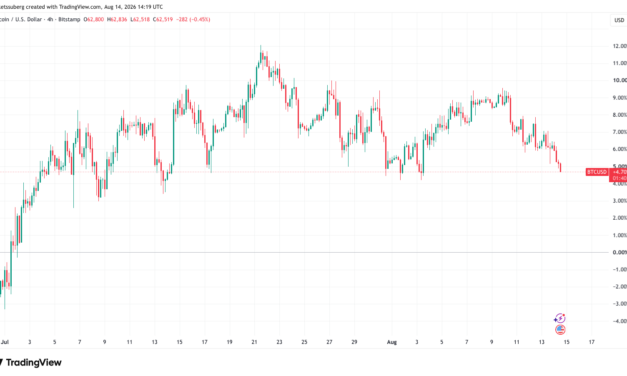
Bitcoin (BTC) declined into Friday’s Wall Street open as traders increasingly saw a BTC price breakdown next.Key points:Bitcoin stays below $63,000, heading steadily closer to new August lows while US stocks build on record highs.Analysis says that $63,220 must be reclaimed by the weekly close to avoid a deeper rout.Markets look to PCE inflation data as the next key test for risk assets.Bitcoin price sags with stocks at all-time highsData from TradingView showed BTC/USD down 1.3% on the day at $62,570, near its lowest levels month-to-date.BTC/USD four-hour chart. Source: Cointelegraph/TradingViewDespite encouraging US inflation data lifting risk assets and reducing the odds of interest-rate hikes, Bitcoin failed to follow US equities, which closed Thursday’s session at all-time highs. The S&P 500 and tech-heavy Nasdaq Composite Index were both green at the time of writing, up 0.11% and 0.14%, respectively.BTC/USD vs. S&P 500 one-hour chart. Source: Cointelegraph/TradingViewCommenting on Bitcoin price performance, trader and analyst Rekt Capital warned that Sunday’s weekly close needed to be above $63,220.“A Weekly Close below the orange level would probably set price up for a breakdown,” he wrote in a post on X.The analyst noted that $63,000 was now failing as support after weakening throughout August, having previously noted that the 50-month exponential moving average (EMA) at $65,827 was back as resistance, copying the 2022 bear market.BTC/USD one-week chart. Source: Rekt Capital on X.comCointelegraph previously reported on increasing chances of a long liquidation event for Bitcoin as it approaches an area of liquidity around $61,000 amid growing open interest (OI) in derivatives markets.“Traders have added substantial risk, most of it long, into a market that shows no matching demand,” onchain analytics platform Glassnode summarized in the latest edition of its regular newsletter, The Week Onchain.PCE in focus after Bitcoin ignores inflation reliefIn its latest analysis, trading and investment company QCP Capital drew attention to crypto markets’ refusal to rally on improving US inflation conditions — a phenomenon it described as “increasingly important.”Related: Bitcoin speculators keep BTC price ‘pinned’ below $68.7K: Glassnode“Last week, BTC demonstrated resilience in absorbing several negative headlines without a sustained breakdown,” it wrote, adding:“This week has reinforced the distinction between resilience and momentum: the range remains intact, but softer inflation data have so far generated only a muted response from crypto.”QCP added that macro traders are now focused on the Aug. 26 Personal Consumption Expenditures (PCE) index release, known as the Federal Reserve’s preferred inflation gauge. The index’s last print in July marked its first monthly decline since 2020, per data from the Bureau of Economic Analysis.US PCE data percentage change (screenshot). Source: BEA

Čítaj viac

Bitcoin Eyes New August Lows as Binance Longs Face a ‘Cleanout’

Bitcoin (BTC) long positions are “facing liquidation” as volatility shows signs that a range breakout is finally coming.Key points:Bitcoin long positions face multiple threats as BTC price action heads toward new August lows, analyst warns.The correlation between Binance open interest and price reached 0.25 on Thursday as both fell.The Bitcoin bull market is not ready to make a comeback, CryptoQuant CEO Ki Young Ju says.Bitcoin longs feel the squeeze as price dropsInsights published on onchain analytics platform CryptoQuant by community analyst “BorisD” on Thursday suggest that leveraged long BTC positions are being flushed out as BTC/USD targets month-to-date lows.BTC/USD one-hour chart. Source: Cointelegraph/TradingViewThe analysis focuses on the relationship between price and open interest (OI) on Binance. OI represents total active derivative positions, both long and short, and reflects capital commitment in a given market. While price has traded in a narrow range since June, CryptoQuant data show that Binance OI has gradually increased, reaching $8.15 billion on Wednesday as futures increasingly steer the market while spot traders sit on the sidelines. Bitcoin open interest on Binance. Source: CryptoQuantWith price now seeing downside volatility on lower time frames, the correlation between price and OI has entered a state of flux, potentially squeezing long positions that have built up in the low $60,000 zone.“In the Bitcoin market, the Binance Open Interest (OI) Correlation and liquidation warning signals clearly reveal the process of leveraged positions being flushed out. Initially, as the price fell, the correlation shifted to the negative side, indicating that OI was rising despite declining prices,” the analyst wrote.“This showed a double-sided squeeze and [an] increasingly complex liquidity structure — driven by long positions trying to buy the dip on one end, and additional short positions entering the market on the other.”BTC/USD vs. Binance OI data. Source: CryptoQuantThe latest correlation data showed a reading of 0.25, a number that the analyst said reflects declining long positions as price continues to fall, suggesting the “anticipated cleanout has begun.”“The simultaneous drop in both price and OI indicates that leveraged long positions are giving up, getting stopped out, or facing liquidation,” the analyst continued.Data from CoinGlass put total 24-hour cross-crypto liquidations at $236 million at the time of writing.Crypto liquidation history (screenshot). Source: CoinGlassCryptoQuant CEO: “Stars haven’t aligned” for Bitcoin bull marketIn his latest market commentary, CryptoQuant CEO Ki Young Ju said conditions for a renewed Bitcoin bull market have yet to emerge.Related: Bitcoin speculators keep BTC price ‘pinned’ below $68.7K: Glassnode“The stars haven’t aligned for a Bitcoin bull run just yet,” he wrote on X alongside a basket of onchain indicators still in “bear” territory.Bitcoin onchain indicator heatmap. Source: Ki Young Ju on X.comCointelegraph has previously reported on several composite onchain indicators reaching similar conclusions about the current stage of the BTC price cycle. One of them, from onchain analytics platform Glassnode, is currently in its longest “capitulation” phase since the end of Bitcoin’s last bear market in 2022.

Čítaj viac

Bitcoin keeps traders guessing near $64K as stocks gain on cool US PPI data

Bitcoin (BTC) edged away from weekly lows on Thursday after the US Producer Price Index (PPI) narrowly cooled in July.Key points:Bitcoin avoids further downside as US PPI data provides a boost to US equities.Cleveland Fed president stays hawkish on the outlook for interest-rate policy. Bitcoin long liquidations make $61,000 a key level to watch.July PPI extends cooler US inflation trendBTC/USD was up around 0.5% on the day near $63,900 with volatility broadly absent, data from TradingView showed.BTC/USD one-hour chart. Source: Cointelegraph/TradingViewThe July US Producer Price Index (PPI) print was unchanged month-on-month at 0.2%, while year-on-year increased 4.7% versus an anticipated 4.9%, per data from the Bureau of Labor Statistics (BLS).“In July, a 0.2-percent increase in the index for final demand services and a 2.2-percent advance in prices for final demand construction offset a 0.7-percent decrease in the index for final demand goods,” the BLS release said. “Falling gasoline and energy prices provided the biggest relief,” Econoday analysts highlighted.US PPI one-month % change. Source: BLSUS stocks gained at the Wall Street open as PPI further cooled market bets on interest-rate hikes from Federal Reserve policymakers. The S&P 500 index and tech-heavy Nasdaq Composite index were up 0.87% and 0.94%, respectively, at the time of writing.CME Group’s FedWatch Tool showed 65.6% odds of those policymaker holding rates at the current 3.50-3.75% level at the Federal Open Market Committee (FOMC) September meeting. Wednesday’s July Consumer Price Index (CPI) numbers matched expectations, already resulting in a boost to the rate-pause outlook.Fed target-rate probability comparison for September FOMC meeting (screenshot). Source: CME GroupAfter their biggest split over the interest-rate path since 1970 in July, Fed officials continued to strike a cautious tone over policy. Speaking at an event with the Dayton Area Chamber of Commerce in Kettering, Ohio, Cleveland Federal Reserve Bank president Beth Hammack questioned whether even recent cooler data prints would be enough to bring inflation down to the Fed’s 2% target.“Maybe we’d get there, but if it takes another three to four years to get there, is that OK? Is that enough?” she said, quoted by Bloomberg.Hammock was one of three officials to vote in favor of a 0.25% rate hike in July.Related: Bitcoin speculators keep BTC price ‘pinned’ below $68.7K: GlassnodeBitcoin faces long position liquidations at $61,000With BTC price action still acting within a tight range, market participants’ attention focused on the extremes.Rafael Schultze-Kraft, cofounder of onchain analytics platform Glassnode, suggested that $61,000 could become a flashpoint thanks to the large potential long position liquidations that would occur if price were to reach it.“Long liquidation risk has built up around $61K in the past weeks. If we get there, I’d expect forced selling to add momentum to the downside,” he wrote in a Tuesday X post.Previously, Cointelegraph reported on $63,000 now forming another key BTC price level as repeated retests increased the odds of support failure.Bitcoin futures liquidation heatmap. Source: Rafael Schultze-Kraft on X.com

Čítaj viac

Získaj BONUS 8 € v Bitcoinoch

nakup bitcoin z karty

Registrácia Binance

Burza Binance

Aktuálne kurzy

