Autor Cointelegraph By William Suberg

Fed ‘will determine the fate of the market’ — 5 things to know in Bitcoin this week

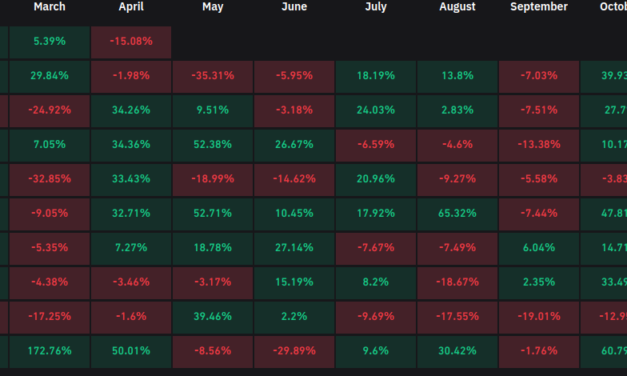
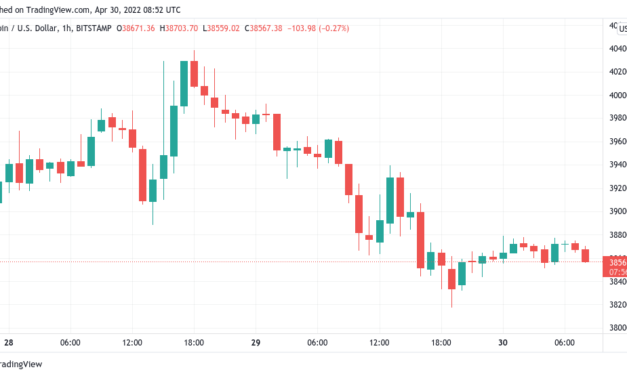
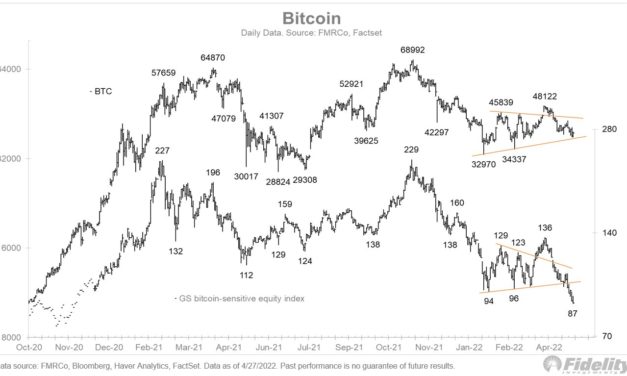
Bitcoin (BTC) starts a new week with much to make up for after its worst April performance ever.The monthly close placed BTC/USD firmly within its established 2022 trading range, and fears are already that $30,000 or even lower is next.That said, sentiment has improved as May begins, and while crypto broadly remains tied to macro factors, on-chain data is pleasing rather than panicking analysts.With a decision on United States economic policy due on May 4, however, the coming days may be a matter of knee-jerk reactions as markets attempt to align themselves with central bank policy.Cointelegraph takes a look at the these and other factors set to shape Bitcoin price activity this week.Fed back in the spotlightMacro markets are — as is now the standard — on edge this week as another U.S. Federal Reserve meeting looms.As inflation runs rampant worldwide, it is expected that Chair Jerome Powell will make good on his previous pledges and announce key interest rate hikes.Wednesday will be pivotal. The Fed is expected to confirm a $95B per month sell program which has not yet been unleashed on the market. https://t.co/gRRwd059Lw— Charles Edwards (@caprioleio) May 2, 2022How severe and how quickly they are applied is a matter for debate, and a separate debate concerns whether markets have already “priced in” various options.Any shocks are likely to spark at least temporary volatility across markets, and over the past six months or so, crypto has been no exception.Attention is thus on the Federal Open Markets Committee (FOMC) meeting to be held on May 3 and May 4.“First came the Fed. Then the Netflixpocalypse. Then the Russian invasion. Then the sanctions. Then the Fed and the largest treasury dump ever. This week it was earnings. Next week the Fed again,” macro analyst Alex Krueger summarized over the weekend:“The Fed’s QT announcement on Wed will determine the fate of the market.”Krueger was referring to a policy known as quantitative tightening (QT) — the counterpart to quantitative easing, or QE, which describes the Fed’s pace of economic support withdrawal in a bid to reduce its $9 trillion balance sheet.Risk assets, already sensitive to a conservative environment, are already tipped by Bitcoiners to lose big in the coming months, taking crypto down with them.“It’s easy to overlook this, given the broad retreat of the market last week, but: Along with meme stocks, the Bitcoin-sensitive equity basked is already making new lows,” Jurrien Timmer, director of global macro at asset management giant Fidelity Investments, added.An accompanying chart of the Goldman Sachs Bitcoin-sensitive equity index — 19 major cap stocks with exposure to crypto — spelled out the relative pain already being experienced.Goldman Sachs Bitcoin-sensitive equity index chart. Source: Jurrien Timmer/ TwitterNext week will see the focus shift back toward inflation itself with the publication of U.S. consumer price index (CPI) data for April.Time for $28,000 Bitcoin?At around $37,600, April’s monthly close was decidedly uninspiring for Bitcoin hodlers, data from Cointelegraph Markets Pro and TradingView shows.BTC/USD 1-month candle chart (Bitstamp). Source: TradingViewDespite subsequently regaining some ground, BTC/USD has reaffirmed at least a short-term desire to trade in a narrow range well below the top of its 2022 trading corridor of $46,000.Expectations were previously high that April would deliver better performance, but in the end, 2022 ended up being Bitcoin’s worst April on record, with overall losses of 17.3%, data from on-chain monitoring resource Coinglass confirms.BTC/USD monthly returns chart. Source: CoinglassOn the back of that, it is thus little wonder that the mood among analysts is equally cautious.“The BTC chart is heavy right now, & a break below $35k could cause a rush for the exit… But I don’t trust breakdown patterns in this range. We’ve seen short squeezes and ATH breakout traps over the past year,” popular trader Chris Dunn tweeted on May 1:“Risky to anticipate, better to react… I’d love a $26k washout.”Dunn is far from alone in calling for a capitulation event to take the market to $30,000 or under. “In regards to talk of capitulation, I believe that it would require Bitcoin to go below $30k,” analyst Matthew Hyland argued in one of several tweets about Bitcoin’s volume profile:“Low volume since May of last year which brought BTC to $30k. Low volume = low turnover of buyers and sellers. Below 30k would unlock the buyers who bought pre-65k in early 2021.”Hyland explained that low-volume markets are apt to see larger price swings, and a significant BTC price dip may be necessary to reignite engagement amid an overall lack of participation at current levels.To unlock higher volume, it would require Bitcoin to flush below 30k Based on the volume levels between 20k-30k (which BTC spent less than 3 weeks in), I wouldn’t expect it to match the volume profile we saw last May however it would still standout compared to current volume: pic.twitter.com/msQRmz9UVi— Matthew Hyland (@MatthewHyland_) May 1, 2022

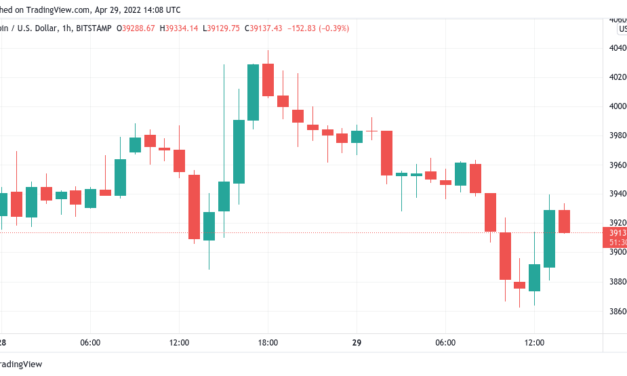
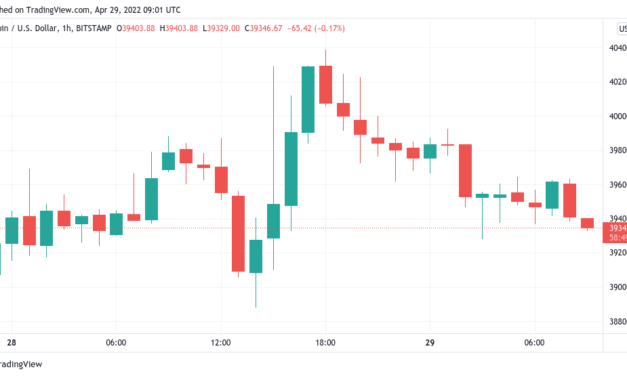
Over the weekend, meanwhile, calls emerged for a near-term trip to $35,000.U.S. dollar strength keeps up the pressureApril may have come and gone, but the ogre of the U.S. dollar index (DXY) remains firmly in the room.A single day of consolidation on April 29 is already history, and on May 2, DXY was already attempting to continue a breakout that has seen dollar strength hit its highest since 2002.At 103.4 as of press time, DXY shows no signs of a more significant pullback, much to the disappointment of Bitcoiners at the mercy of inverse correlation.U.S. dollar index (DXY) 1-month candle chart. Source: TradingView“At the moment, the inverse relationship between bitcoin and the DXY […] depicts that if the index holds above the 102 DXY resistance level, this could weaken bitcoin, and the price action could retrace to the $35k and below area, particularly if the rising DXY can be attributed to the tightening of monetary policy,” on-chain analytics firm Glassnode’s latest Uncharted newsletter explained.In the event, 102 was little problem for DXY, which may stand to gain even more should the Fed rate hike decision be on the upper end of the spectrum.“The development of the USD is highly dependent on the Fed’s course of action. The rising inflation and potential 50bps rate hike in early May could strengthen the DXY,” Glassnode added.As Cointelegraph recently reported, other major world currencies have suffered along with crypto in USD terms in recent weeks, with a particular focus on the fate of the Japanese yen. Japan, unlike the U.S., continues to print vast amounts of liquidity, devaluing its currency even further.Trader: Illiquid supply outweighs price dip significanceLast week saw a new record for the proportion of the Bitcoin supply dormant for at least a year — 64%.As seasoned hodlers — or at least those who bought before the July 2021 bottom near $28,000 — there is thus a determination not to capitulate yet.Now, more data has been added to the mix, and it comes in the form of illiquid supply. According to Glassnode’s Illiquid Supply Change indicator, recent weeks have produced large increases in the overall segment of the BTC supply, which is now no longer available for purchase.The result is Illiquid Supply Change reaching levels not seen since late 2020 when BTC/USD began to exhibit signs of a “supply shock” as market participants piled into what was already a solidly “hodled” asset class.“This number is reaching peak high numbers, which we’ve also seen in 2020 (the build-up). Ultimately, a large number of coins are ‘illiquid,’ which adds to the potential of a possible supply shock,” Cointelegraph contributor Michaël van de Poppe said as part of comments on the numbers.Continuing, Van de Poppe argued that the indicator “tells a lot” and could even take some of the fear out of a dip to $30,000.“Yes, the market can still make a new lower low in which the bear market continues (relatively; the altcoin bear market is currently already active for a year, which means that retail is gone) and a hit of $30K can be reached. But, fundamentally, the data tells a lot,” he added.Bitcoin Illiquid Supply Change chart. Source: GlassnodeCrypto sentiment “crosses over” macroIn what could be a silver lining under current circumstances, crypto sentiment is already pointing higher this week, even as traditional market sentiment remains nervous.Related: Top 5 cryptocurrencies to watch this week: BTC, LUNA, NEAR, VET, GMTThe Crypto Fear & Greed Index, having hit two-week lows of 20/100 last week, has now exited its “extreme fear” zone.Crypto Fear & Greed Index (screenshot). Source: Alternative.meAt 28/100, Crypto’s index is now even above its traditional finance (TradFi) counterpart, the Fear & Greed Index, which on May 2 measured 27/100.Fear & Greed Index (screenshot). Source: CNNShould crypto continue to fulfill its function as a bellwether of market moves to come, there may be modest cause for relief at the data.28/100 marks Crypto’s best reading since April 17.The views and opinions expressed here are solely those of the author and do not necessarily reflect the views of Cointelegraph.com. Every investment and trading move involves risk, you should conduct your own research when making a decision.

Čítaj viac

These are the BTC price levels to watch as Bitcoin risks worst April on record

Bitcoin (BTC) sits at a historically important price point for hodlers, but where could it be headed in the coming days?As the monthly close looms and various countries prepare for the May holidays, traders are mapping out the options — with some surprises.$35,000 becomes key focusWhile Bitcoin market commentators rarely agree on much, one thing is more or less accepted this week — that April’s monthly close will be volatile.Due over the weekend, that volatility has the potential to be exacerbated by a lack of trading volume thanks to markets being off either for the weekend or long weekend.Even with macro participation, however, the situation would seem not to favor Bitcoin bulls. As Cointelegraph reported, Friday saw major indices, with the notable exception of China, finish in the red.”Nothing bullish about this candle other than that it’s still above monthly support (but that could change today),” popular Twitter trader Cryptotoad thus summarized as part of his latest update. “Next monthly support at $35k.” April has so far delivered 15% losses on BTC/USD, the worst month of April in Bitcoin’s history, data from on-chain monitoring resource Coinglass shows.BTC/USD monthly returns chart (screenshot). Source: CoinglassBTC/USD has so far managed to avoid a drop below liquidity at around $37,500, but Cryptotoad is not the only one arguing that this could now become a near-term chart focus.Jordan Lindsey, founder of trading firm JCL Capital, flagged $35,000 as one of what he sees as just two important “big technical levels.””The only two levels that matter now in Bitcoin. $35k is channel support and below is major technical breakdown. Price is technically bullish since $38k on Feb 4th posted on this account and neutral since $53k breakdown. Everything else has been noise,” he told Twitter followers Friday.BTC/USD annotated chart. Source: Jordan Lindsey/ TwitterShould that drop materialize, it would place Bitcoin not so far from last week’s worst case scenario target of $30,000, described as both an “ultimate bottom” and a likely level to reach by June.”Decent relief” could follow spot level retentionAdopting a more optimistic view, meanwhile, fellow trader Credible Crypto argued that avoiding the sub-$37,000 dip places Bitcoin in a stronger position.Related: $27K ‘max pain’ Bitcoin price is ultimate buy-the-dip opportunity, says research”If we can hold here we should see some decent relief,” he tweeted Saturday alongside a chart illustrating the prognosis.”As per my last update I can see valid arguments for both but give the edge to the bullish scenario due to wave structure. Easy invalidation at 37.7k, if we hit that expect a flush into the orange region and 36k’s.”At the time of writing, with around 12 hours left until the close, BTC/USD traded at $38,600.BTC/USD annotated chart. Source: Credible Crypto/ TwitterThe views and opinions expressed here are solely those of the author and do not necessarily reflect the views of Cointelegraph.com. Every investment and trading move involves risk, you should conduct your own research when making a decision.

Čítaj viac

Bitcoin retreats toward $38K after Friday sparks losses for 'nearly everything' outside China

Bitcoin (BTC) fell into the May holiday weekend after late trading saw crypto losses echo “basically everything.”BTC/USD 1-hour candle chart (Bitstamp). Source: TradingViewMacro keeps BTC firmly in its placeData from Cointelegraph Markets Pro and TradingView showed BTC/USD reversing at $38,180 on Bitstamp to circle $38,600 on April 30. The pair had performed weakly during Friday, this nonetheless echoing the vast majority of traditional assets — with the notable exception of Chinese equities.”Almost everything went down today besides gold, platinum, and Chinese stocks,” economist Lyn Alden summarized.With that, the S&P 500 finished Friday down 3.6% and the Nasdaq 100 down 4.5%. Hong Kong’s Hang Seng, on the other hand, gained 4% overall. The U.S. Dollar Index (DXY), despite wobbling after hitting twenty-year highs, further failed to offer respite as it began to consolidate near its two-decade peak.”Would be pretty hard to rally price against a macro bear market in the short term. It’s what happens after a correction that counts,” statistician Willy Woo argued as part of a Twitter debate. “But also the DXY is at multiple technical resistances, if the govt steps in with yield curve control then we could see markets rally.”Yield curve control is also being watched as a major watershed moment not just for crypto but for the economies ruled by governments who instigate it. “YCC is the end game,” ex-BitMEX CEO Arthur Hayes forecast in his latest blog post released last week. “When it is finally implicitly or explicitly declared, it’s game over for the value of the USD vs. gold and more importantly Bitcoin. YCC is how we get to $1 million Bitcoin and $10,000 to $20,000 gold.”U.S. Dollar Index (DXY) 1-hour candle chart. Source: TradingView”Supply shock squeeze” curiosity gathers paceExplaining why BTC/USD continues to stay in a range, meanwhile, Woo said that events could be mimicking Q4 2020 — just before Bitcoin broke out of what was then a three-year trading range.Related: Trader flags BTC price levels to watch as Bitcoin still risks $30K ‘ultimate bottom'”Bitcoin price is sideways because of Wall St is selling futures contract in a macro risk-off trade. Meanwhile institutional money is scooping spot BTC at peak rates and moving to cold storage,” he wrote. “It’s times like these I remember the Q4 2020 supply shock squeeze.”An accompanying chart showed flows in and out of exchanges compared to spot price, showing the impact of “supply shock.”Bitcoin exchange net flows vs. BTC/USD annotated chart. Source: Willy Woo/ TwitterAs Cointelegraph reported, meanwhile, that same conclusion is also being drawn from data covering Bitcoin whales.The views and opinions expressed here are solely those of the author and do not necessarily reflect the views of Cointelegraph.com. Every investment and trading move involves risk, you should conduct your own research when making a decision.

Čítaj viac

Bitcoin disappoints on bull run as AMZN stock sees biggest 1-day drop since 2014

Bitcoin (BTC) fell into the Wall Street open on April 29 as United States markets opened to volatility, including an 11% drop in Amazon stock.BTC/USD 1-hour candle chart (Bitstamp). Source: TradingViewAll change at the FedData from Cointelegraph Markets Pro and TradingView confirmed BTC/USD dipping to $38,622 on Bitstamp Friday.Despite a let-up in the U.S. dollar’s relentless bull run, Bitcoin showed little signs of strength as it remained firmly under $40,000.Macro factors remained against the largest cryptocurrency along with risk assets more broadly, commentators noted, as the Federal Reserve reduced its balance sheet.The start of #Fed deleveraging? Fed balance sheet has shrunk for the 2nd consecutive week. Total assets now at $8,939bn, equal to 36.6% of US’ GDP vs ECB’s 82% or BoJ’s 137%. pic.twitter.com/0GRR5VgGIe— Holger Zschaepitz (@Schuldensuehner) April 29, 2022For Amazon, meanwhile, the pain was immediately obvious as missed earnings targets resulted in AMZN’s biggest intraday loss in eight years.The S&P 500 traded down 1% at the time of writing, while the Nasdaq 100 was down 0.9%.Focusing on Bitcoin, popular trader and analyst Rekt Capital argued that the relative strength index (RSI) may need to form a higher low and rebound in order to provide the market with the fuel for a breakout on short timeframes.#BTC ultimately rejects at this resistanceNow pulling backCould $BTC find a base and then rebound once the RSI Higher Low has been revisited?#Crypto #Bitcoin https://t.co/nneXL2BrKe pic.twitter.com/AKMzmmdGds— Rekt Capital (@rektcapital) April 29, 2022

Whales flip to bear market bottom buyingIn its latest chart update on whale behavior, meanwhile, data from on-chain analysis platform Whalemap showed that buying behavior is echoing the bear market bottom of late 2018.Related: Bitcoin set for volatile monthly close after BTC price ‘checks all boxes’ for major moveAccording to its data, whales with balances of between 1,000 and 10,000 BTC are busy accumulating BTC to the extent that they were when BTC/USD hit $3,100 in December that year. The volumes even outdo those from the $3,600 crash in March 2020.“Whales are accumulating as much Bitcoin today as they were at the $3K lows,” analyst and indicator creator Charles Edwards commented. “These are holders with approx. $40M – $400M in their wallets today. In 2018, that was $4M – 40M (but there were no ‘institutions’ then either).”Bitcoin 1,000–10,000 BTC wallet inflows chart. Source: WhalemapThis week, Whalemap also noted that current spot price levels represent historically significant ground for buyers and sellers alike.The views and opinions expressed here are solely those of the author and do not necessarily reflect the views of Cointelegraph.com. Every investment and trading move involves risk, you should conduct your own research when making a decision.

Čítaj viac

Bitcoin price slow to react as US dollar rally stops at 20-year highs

BTC/USD 1-hour candle chart (Bitstamp). Source: TradingViewTrader eyes $40,600 as “crucial” breakerData from Cointelegraph Markets Pro and TradingView showed BTC/USD hugging support near $39,300 after failing to hold $40,000.The pair had managed some modest upside despite a “parabolic rally” in U.S. dollar strength throughout the week.The U.S. dollar index (DXY) finally began cooling Friday after reaching its highest levels since 2002.Despite its inverse correlation, BTC/USD had yet to show any signs of direct benefit from the changing mood at the time of writing.Cointelegraph contributor Michaël van de Poppe was nonetheless confident that bullish momentum would return to Bitcoin in the short term.“Bitcoin is getting into a narrow playing field and is ready for a big impulse move,” he told Twitter followers on the day. “I’m betting on the upside, as the DXY is showing some weakness too. Crucial level to break: $40.3-40.6K first.”Van de Poppe had previously highlighted current spot price levels as crucial to hold in order to open up the path towards $42,000 and above.U.S. dollar currency index (DXY) 1-day candle chart. Source: TradingViewFurther tailwinds for BTC came in the form of Asian market trading, meanwhile, with the Shanghai Composite Index up 2.4% and Hong Kong’s Hang Seng managing 10% on the day in a broad comeback from earlier Coronavirus-induced sell-offs.Hang Seng Tech Index jumps 10% after China makes another pro-market statement. A meeting is set to occur soon between govt & major tech comps, raising hopes that the regulatory landscape for this industry is set to ease going forward. https://t.co/9JG07mzvej (HT @knowledge_vital) pic.twitter.com/4RuFkAHqzn— Holger Zschaepitz (@Schuldensuehner) April 29, 2022European indices were flatter, with Germany’s DAX up 1.2% and the FTSE 100 up 0.35% in London.Research warns over hodler “capitulation”Examining who among Bitcoin holders is selling in current conditions, popular analyst Root identified changing tendencies among long-term holders (LTHs) — those with coins unmoved for 155 days or longer.Related: $27K ‘max pain’ Bitcoin price is ultimate buy-the-dip opportunity, says researchThose who bought in between $18,000 and the all-time highs of $69,000 — a significant chunk of the LTH base — are being forced to exit due to external forces, he warned.“They are de-risking/capitulating due to macro conditions,” part of a Twitter thread read, Root adding that it is “bullish how price has been holding up really well.”As Cointelegraph reported, the percentage of the BTC supply dormant for a year or more has nonetheless made new all-time highs this month, according to data from on-chain analytics firm Glassnode.Bitcoin (BTC) stayed rangebound on April 29 as a welcome retracement saw the U.S. dollar come down from 20-year highs.Bitcoin active supply chart. Source: GlassnodeThe views and opinions expressed here are solely those of the author and do not necessarily reflect the views of Cointelegraph.com. Every investment and trading move involves risk, you should conduct your own research when making a decision.

Čítaj viac

Získaj BONUS 8 € v Bitcoinoch

nakup bitcoin z karty

Registrácia Binance

Burza Binance

Aktuálne kurzy