Autor Cointelegraph By William Suberg

'Kwontitative easing' — BTC price hits $43K in UST as Terra empties $2.2B Bitcoin bag

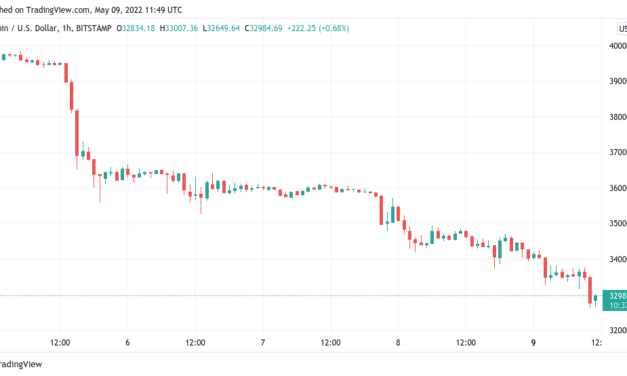
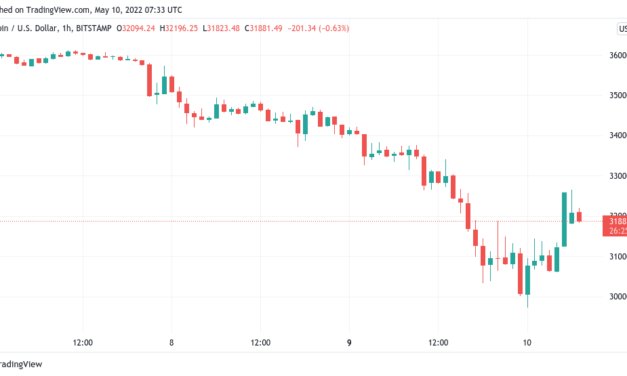
Bitcoin (BTC) fell below $30,000 for the first time in ten months on May 10 as turmoil at Blockchain protocol Terra continued.BTC/USD 1-hour candle chart (Bitstamp). Source: TradingViewBitcoin price bounces at $29,700Data from Cointelegraph Markets Pro and TradingView showed BTC/USD plumbing lows of $29,731 on Bitstamp.The first trip under the $30,000 mark since July 2021, overnight BTC price performance came amid both declining stock markets and fresh trouble for Terra’s U.S. dollar stablecoin, TerraUSD (UST).As Cointelegraph continues to report, UST saw an attack involving mass selling this week, which culminated in Terra using its giant 750 million BTC reserves to prop up its USD peg.Initial liquidity steps to mitigate the impact of the threat proved insufficient, however, and UST subsequently fell to lows of $0.67, according to data from CoinMarketCap.At the same time, BTC/UST on major exchange Binance began behaving erratically, reaching highs of more than $42,000 while other Bitcoin dollar markets struggled to preserve $30,000.Which has caused a massive surge in BTCUST (Not Bitcoin valued in dollars, but valued in the UST stablecoin). pic.twitter.com/Xn7qcy4VMZ— Blockchain Backer (@BCBacker) May 10, 2022Rumors of a full meltdown at Terra spread rapidly on social media. Nonetheless, the firm’s vocal co-founder, Do Kwon, remained calm after announcing the mass BTC liquidity injection.Kwon retweeted a summary of the situation from Jose Macedo, Founding Partner at Delphi Ventures, who argued that Terra’s contingency measures would ultimately lead to greater decentralization of the crypto industry’s largest decentralized USD stablecoin.”Haters will criticise this for centralisation and they’re right, for now. @LFG_Reserve made $UST more robust, but also temporarily more centralised,” he wrote on May 9.Data from on-chain monitoring resource BitInfoCharts meanwhile confirmed the moves, the wallet balance of Terra nonprofit, the Luna Foundation Guard (LFG), going from 70,000 BTC ($2.23 billion) to 0 BTC.Luna Foundation Guard (LFG) Bitcoin wallet (screenshot). Source: BitInfoChartsLFG suggested that not all the previously owned BTC had been sold, and pledged to update the community.$35,000 on the tableBTC/USD nonetheless managed to recover from its own collapse to trade at near $32,000 at the time of writing on May 10. Related: Pro traders adopt a hands-off approach as Bitcoin price explores new lowsSome were even willing to “buy the dip,” among them El Salvador, with President Nayib Bukele confirming the purchase of 500 BTC at an average price of $30,744.”I don’t know how deep the markets are going to correct, as an additional outlier of the LUNA UST peg is playing it’s part of the drop,” Cointelegraph contributor Michaël van de Poppe reacted overnight. “All I know, is that the UST peg is a temporary shock and I’m assuming we’ll trade around $35K in the next 24-48 hours for Bitcoin.”The “shock” had still not resolved at the time of writing, as UST traded at 8% below USD parity. Terra’s LUNA token was at $32 after hemorrhaging over 50% of its value in 24 hours. LUNA/USD 1-day candle chart (Binance). Source: TradingViewA Twitter survey by popular commentator Benjamin Cowen revealed the majority of over 12,000 respondents believed that the peg would ultimately be restored.The views and opinions expressed here are solely those of the author and do not necessarily reflect the views of Cointelegraph.com. Every investment and trading move involves risk, you should conduct your own research when making a decision.

Čítaj viac

Bitcoin sets news 2022 lows as analyst says trip to $24K realized price ‘entirely possible’

Bitcoin (BTC) set a new record low price for 2022 on May 9 as crypto markets continued selling off prior to the Wall Street opening.BTC/USD 1-hour candle chart (Bitstamp). Source: TradingViewBTC price sinks under $36,700Data from Cointelegraph Markets Pro and TradingView confirmed the firmly bearish achievement for BTC/USD, which hit $32,637 on Bitstamp.With the latest installment of a string of losses in May, the pair continued to trade under $33,000 at the time of writing, with weekly losses now at 15%.“Bitcoin sweeping the lows here, that’s probably next liquidity,” Cointelegraph contributor Michaël van de Poppe told Twitter followers in one of several posts on the day:“We could go towards $30-31Kish as that’s a daily block, but I’d be looking at longs around these regions.”$30,000 forms a popular floor level among commentators, which some nonetheless believe that Bitcoin could dive to $25,000 or even lower.28.8k incoming https://t.co/FC7EZABqgD— Matthew Hyland (@MatthewHyland_) May 9, 2022Among this week is Dylan LeClair, who identified Bitcoin’s realized price — the total at which each coin last moved — as a likely target.“A bitcoin dip down to it’s realized price (average on-chain cost basis) is entirely possible and has been consistent with previous market bottoms in bear market cycles,” he began a Twitter thread by stating on May 9:“Realized price is $24.3k at the moment.”LeClair added that such a capitulation would have been “unlikely” without accompanying weakness in traditional markets. This year, however, has provided just that impetus.Going back to December, I outlined this possibility and prefaced it with the opinion that it’s unlikely to occur unless a significant liquidity crises emerged in legacy markets.Well, it looks like we’re getting one. Stay safe out there.[3/3] pic.twitter.com/qJtNnkYysM— Dylan LeClair (@DylanLeClair_) May 9, 2022

Bitcoin saw some support around the 2022 lows, so far avoiding a deeper retest of levels not seen since last year.“We’ve seen renewed selling in Bitcoin and the wider digital token market as the prospect of increasing interest rates and a deteriorating economic environment continues to weigh on risk assets,” analysts at major exchange Bitfinex, meanwhile, told Cointelegraph in private comments. “In Europe, equities are sharply lower, following the Nasdaq experiencing its sharpest one-day fall since June 2020. Investors exiting positions may be adding some momentum to the protracted sell off that we’ve witnessed over the past few days.”LUNA stands out among altcoin routAmid a hastening sell-off, altcoins also began to lose significant value.Related: First 6-week losing streak since 2014 — 5 things to know in Bitcoin this weekBTC/USD 1-day candle chart (Bitstamp). Source: TradingViewEther (ETH) traded below $2,400 for the first time since Feb. 24, down 7% on the day in line with the majority of the top ten cryptocurrencies by market cap.The largest weekly losses in the top ten belonged to Terra (LUNA), which shed 27% on the back of controversy over its TerraUSD (UST) stablecoin.LUNA/USD 1-day candle chart (Binance). Source: TradingViewThe views and opinions expressed here are solely those of the author and do not necessarily reflect the views of Cointelegraph.com. Every investment and trading move involves risk, you should conduct your own research when making a decision.

Čítaj viac

First 6-week losing streak since 2014 — 5 things to know in Bitcoin this week

Bitcoin (BTC) starts the second week of May 2022 by bringing up bearish ghosts from its past — how much worse could the picture get for hodlers?After falling to nearly $33,000, the largest cryptocurrency is giving market participants new and old a run for their money, and the fear is palpable.A brutal combination of macro cues, which are set to continue this week and beyond, forms the backdrop for some historical chart retests that no one wanted to see again.As calls for capitulation continue, there is still a lack of agreement about just how far BTC/USD could or should fall to put in a convincing long-term bottom. Cointelegraph takes a look at factors poised to contribute to market movements in the coming days, as Bitcoin closes in on its 2022 lows.Six weekly closes in the redWhichever way you dice it, there is little to be bullish about when it comes to Bitcoin price charts this week. The weekly close on May 8 at $34,000 meant that BTC/USD delivered its sixth weekly red candle in a row.That chart feature has not been seen in nearly eight years — the last occurrence began in August 2014, data from Cointelegraph Markets Pro and TradingView shows. Then, as now, Bitcoin was in the second year of its four-year halving cycle, having seen its first blow-off top at just over $1,000 in November 2013. This cycle, however, has been different, as that blow-off top either did not arrive or was a lot more muted than previous cycles.BTC/USD 1-week candle chart (Bitstamp). Source: TradingViewMeanwhile, macro conditions have taken care of any hope of a late surge among the majority of analysts, who now expect financial tightening by central banks worldwide to keep risk assets such as crypto firmly in check.Back to the chart and BTC/USD has lost over $4,000 or 11.1% in May already. Historically, the worst month of May on record was in fact last year, in which the pair lost 35.3%, data from on-chain monitoring resource Coinglass shows.After April’s performance, however, the odds of a comeback feel slim. For four years in a row prior to 2022, Bitcoin conversely saw gains of at least 32% in April, but this year printed a 17.3% loss — its worst on record.BTC/USD monthly returns chart (screenshot). Source: CoinglassBTC 100-week moving average fallsAs such, the advice from analysts when it comes to short-term Bitcoin price action is practically unanimous as the week begins: be careful.After the weekly close, BTC/USD continued dropping down towards $30,000, at the time of writing looking to test $33,000 and January’s lows of $31,800 next.“Don’t try to catch this knife,” on-chain analytics resource Material Indicators told Twitter followers alongside a chart showing bid support disappearing from the Binance order book.Monday’s order book data shows a major bid wall in place at $33,000. It was put there as another wall of buy interest at around $33,800 was dealt with swiftly by the market, showing the veracity of sell-side pressure in the current environment.BTC/USD order book data (Binance). Source: Material Indicators“Historically $69.5M in BTC bid liquidity would serve as support, but historically it also had a significant amount of liquidity below it. That does not seem to be the case here,” Material Indicators added about that first line of defence.Last week’s weekly candle also saw Bitcoin dive below its 100-week moving average (WMA) for the first time since March 2020.Then, as with some previous piercings of the 100 WMA, BTC/USD then went on to test the 200 WMA as support. For popular Twitter account Bitcoin Back, the implications this time around are thus obvious.“Both previous times led to capitulation to 200-week moving average in 2014 and 2018,” he wrote in part of his latest update. “Today’s chart has many differences from those two times, and those two times were very similar to each other.”BTC/USD 1-week candle chart (Bitstamp) with 100, 200 WMA. Source: TradingViewBlockchain Backer nonetheless added that he expected a “big dive in” on Monday following the latest display of weakness.As Cointelegraph reported, meanwhile, expectations even long before the weekly close were for Bitcoin to fall to or below $30,000 in the coming weeks.US CPI primed to continue inflation narrativeBitcoin’s rundown in the first week of May was overwhelmingly thanks to the broader macro weakness now firmly in place across global markets.Stocks are particularly problematic in this respect, as crypto’s ongoing correlation to those indices makes for a grim ride for investors.Things came to a head last week after tightening confirmations from the United States Federal Reserve — the S&P 500 capped its first five straight weekly drop since 2011.Now, amid the ongoing Russia-Ukraine conflict and associated financial pressures, another force is due to return.Inflation, already at its highest in the U.S. since the early 1980s, is tipped only to get worse thanks to the fallout from trade disruption and sanctions on Russia.This week will see consumer price index (CPI) data for April released, and the odds are that the numbers will reflect the extent of the geopolitical turmoil like no others before it.U.S. President Joe Biden will speak on the inflation issue on May 10 prior to the CPI print on May 11.March CPI was 8.5%, while noises are already coming from analytics circles that inflation may be peaking now or in the near future.“We expect inflation to peak this summer between 6%-7% and to recede to 3%-4% next year with no recession. … We may have spotted the first signs of peaking inflation already, in lower three-month than y/y rises of several price and wage measures.” – @yardeni pic.twitter.com/4mXXxFvmIN— Carl Quintanilla (@carlquintanilla) May 8, 2022“The best scenario for a bottom for me would be capitulation somewhere in the next few days followed by a lower than expected CPI print on wednesday,” popular trading account Daan Crypto Trades argued. “That would be my cue to bet big.”Big or small, CPI events have tended to spark short-term BTC price volatility in recent months.Calculating capitulation On the topic of “capitulation” — a mass sell-off as investors panic sell their bitcoins — data shows that the temptation to initiate may be strong.Currently, over 40% of the Bitcoin supply is being held at a loss, and this is the highest proportion since April 2020, just after the COVID-19 crash.7.7 million #Bitcoin are currently sitting in loss. This is the highest amount since April 15th, 2020. That’s almost 41% of the total circulating supply. pic.twitter.com/uXPR9PiJHT— On-Chain College (@OnChainCollege) May 7, 2022

At that time, a genuine capitulation event did take place, as evidenced first and foremost by price. Analyzing unrealized profits and losses across hodlers at the time, as defined by on-chain analytics firm Glassnode, likewise confirmed capitulation on March 16, 2020.Just nine days later, the firm’s net unrealized profit/loss metric exited the “capitulation” zone and reached “hope – fear” — one shade towards a recovery.Currently, the metric measures “optimism – anxiety,” and is travelling downwards towards “hope – fear” territory.Bitcoin net unrealized profit/loss chart. Source: GlassnodeSentiment collapses to macro bottom zoneIt’s no surprise that overall crypto market sentiment has not benefited from the events of May so far.Related: Top 5 cryptocurrencies to watch this week: BTC, ALGO, XMR, XTZ, THETAAccording to the Crypto Fear & Greed Index, however, it is only this week that the reality of the situation has hit home for the majority.As of May 9, the classic sentiment gauge measures 11/100, firmly in its “extreme fear” bracket and also at levels which have historically formed bottoms.Crypto Fear & Greed has halved in value in just two days.Crypto Fear & Greed Index (screenshot). Source: Alternative.meThe traditional financial market equivalent, the Fear & Greed Index, has meanwhile begun to diverge from crypto, steady at 30/100 or “fear” on May 9 even after last week’s mayhem.“With Bitcoin now having retraced all the way down to $33.9k, trader sentiment has fallen to six week lows,” research firm Santiment commented on the situation. “We typically prefer to see capitulation signs like this, as weak hands leaving the space is generally what is needed for a truly notable bounce.”Fear & Greed Index (screenshot). Source: CNNThe views and opinions expressed here are solely those of the author and do not necessarily reflect the views of Cointelegraph.com. Every investment and trading move involves risk, you should conduct your own research when making a decision.

Čítaj viac

Bitcoin price target now $29K, trader warns after Terra weathers $285M 'FUD' attack

Bitcoin (BTC) prepared for a rare bear feature to return on May 8 after an overnight sell-off took the market ever closer to January lows.BTC/USD 1-hour candle chart (Bitstamp). Source: TradingViewBTC circles $34,400 lowsData from Cointelegraph Markets Pro and TradingView showed BTC/USD dipping to $34,200 on Bitstamp, recovering to trade around $500 higher at the time of writing.The pair had seen brief support around the $36,000 mark, but this gave way as thin weekend liquidity added to the volatilityBitcoin liquidations themselves were limited, however, as market sentiment had long expected a deeper pullback after a tumultuous week on stock markets.Data from on-chain monitoring resource Coinglass countered 24-hour liquidations for both Bitcoin and Ether (ETH) running at around $80 million.Crypto liquidations chart. Source: CoinglassUpdating his short-term price outlook, popular Twitter commentator Credible Crypto envisaged a “flush” taking BTC/USD to as low as $29,000, marking a new 2022 low.Bids near $30,000, among them those of a whale trader on exchange Bitfinex, may prove too enticing to leave unfilled.Lows at 34.4k almost taken, so eyes now on a flush into 29-32k along with filling that finex whale’s bids. Dude doesn’t miss. Not at my comp so no charts, this post is just so you guys don’t blow up my phone asking what now lol. Still not expecting lows at 28k to be taken. $BTC https://t.co/K1uhD9n52X— Credible Crypto (05.27) (@CredibleCrypto) May 8, 2022The downside momentum into May 8 accompanied news of trouble at Blockchain protocol Terra. The firm, which pledged to buy unlimited amounts of BTC to back its U.S. dollar stablecoin, TerraUSD (UST), saw its first major test as a market participant mass sold UST worth almost $300 million.While disruption was minimal, UST briefly saw its dollar peg eroded by up to 0.8%.”Today’s attack on Terra-Luna-UST was deliberate and coordinated,” Caetano Manfrini, legal officer at Brazilian crypto business forum GEMMA, responded to the events.  “Massive 285m UST dump on Curve and Binance by a single player followed by massive shorts on Luna and hundreds of twitter posts. Pure staging. The project is bothering someone. on the right path!”Do Kwon, the Terra co-founder now well known for both his Bitcoin buys and social media engagement, remained conspicuously cool.Those of you waiting for the earth to become unstable-I’m afraid you will be waiting until the age of men expiresCities have returned to the dustOceans have gone bone dryThe map of continents have been drawn anewAnd dinosaurs once again roam the earth Gluck— Do Kwon (@stablekwon) May 8, 2022

Despite Kwon’s words, however, UST traded around 0.5% below its $1 target at the time of writing, according to data from CoinMarketCap.In further comments, Cointelegraph contributor Michaël van de Poppe admitted that the event “was not fueling the markets” but categorized it as “FUD.””Let’s see how price is reacting here on Bitcoin as we’re sweeping all those lows currently, little overextended to the downside,” he told Twitter followers in part of his latest update. Weekly chart threatens bear pattern absent for eight yearsZooming out, meanwhile, the Bitcoin chart still looked decidedly unappetizing.Related: Any dip buyers left? Bulls are largely absent as the total crypto market cap drops to $1.65TOn weekly timeframes, BTC/USD was near to completing its sixth consecutive red weekly candle — something which had only occurred once before in its history back in 2014.BTC/USD 1-week candle chart (Bitstamp). Source: TradingViewThat year followed the blow-off top of Bitcoin’s first halving cycle and subsequent comedown, exacerbated by the hacking of then major exchange Mt. Gox.#Bitcoin has only printed 6 weekly red candles in a row ever. That was May 2014. Eight years ago!— Michaël van de Poppe (@CryptoMichNL) May 7, 2022

Previously, Bitcoin’s four straight red weekly closes had already put it in a situation last occurring after the March 2020 COVID-19 crash.The views and opinions expressed here are solely those of the author and do not necessarily reflect the views of Cointelegraph.com. Every investment and trading move involves risk, you should conduct your own research when making a decision.

Čítaj viac

Bitcoin clings to $36K as data suggests BTC price sell-off came from short-term holders

Bitcoin (BTC) found a new home at $36,000 into May 7 as volatility finally cooled into the weekend. BTC/USD 1-hour candle chart (Bitstamp). Source: TradingViewTerra down at least $250 million in crunchData from Cointelegraph Markets Pro and TradingView showed BTC/USD circling the $36,000 mark overnight after losing 12% in just 72 hours.Still near its lowest levels since late February, the pair had nonetheless avoided a rematch of 2022 lows at the time of writing despite low-volume weekend market conditions.In his latest Twitter update on May 6, popular trader Anbessa highlighted the planned support level to buy Bitcoin in what he described as a “fakeout” — a zone beginning at just under $33,000.#Bitcoin Update Twitter friendly, easy words BTC support, BTC fakeout we want to buy. Chop very profitable it was. Now waiting for final HTF entry we do. Superior we are. pic.twitter.com/Lt5XT5rRKw— AN₿ESSA (@Anbessa100) May 6, 2022While some eyed profit opportunities, however, there was no hiding others’ losses, notably those of the Luna Foundation Guard (LFG), the nonprofit organization attached to Blockchain protocol Terra which this week purchased $1.5 billion of BTC in over-the-counter deals.According to data from on-chain monitoring resource BitInfoCharts, LFG was down over $240 million on its BTC stash at the time of writing, this not including the week’s latest purchase.As Cointelegraph reported, Terra and its co-founder Do Kwon remain committed to buying unlimited amounts of BTC to back their U.S. dollar stablecoin, TerraUSD (UST).LFG wallet data overview (screenshot). Source: BitInfoChartsBitcoin-skeptic gold bug Peter Schiff meanwhile suggested that whales were responsible for keeping BTC/USD at $36,000.February buyers may have exited BTC positionsAnalyzing possible reasons for the extent of Bitcoin’s losses beyond stock markets, on-chain analytics platform CryptoQuant noted that speculators may have had an overriding influence on the week’s proceedings.Related: ‘Someone is blowing up’ — Bitcoin sees 2022 volume record amid hopes capitulation is overExchange inflows, it revealed on the day, had involved coins dormant for maximum three months, and thus likely to be owned by more speculative investors.Three months ago, around the start of February, was when BTC/USD had begun rising rapidly after putting in its $32,000 lows. As such, those investors would have hit breakeven point this week.BTC/USD 1-day candle chart (Bitstamp) with potential buy and sell areas highlighted. Source: TradingView”According to CryptoQuant data, the decline in the past two days may be dominated by short-term holders. On the 5th and 6th, a total of 11.76k “young” BTC held for less than 3 months flowed into the exchange,” journalist Colin Wu commented on the numbers.Exchange inflow coin age chart. Source: CryptoQuantThe views and opinions expressed here are solely those of the author and do not necessarily reflect the views of Cointelegraph.com. Every investment and trading move involves risk, you should conduct your own research when making a decision.

Čítaj viac

Získaj BONUS 8 € v Bitcoinoch

nakup bitcoin z karty

Registrácia Binance

Burza Binance

Aktuálne kurzy