Autor Cointelegraph By William Suberg

BTC price breakout due 'relatively soon' as Bitcoin volumes spook traders

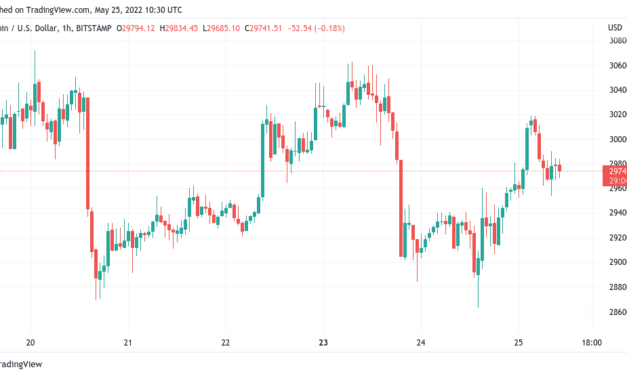
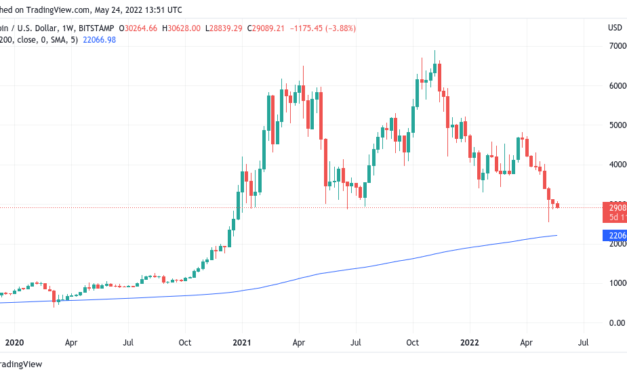
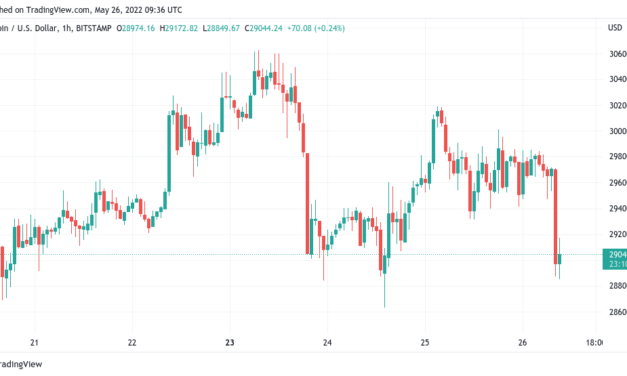
Bitcoin (BTC) disappointed bulls on upside prior to the May 26 Wall Street open as BTC/USD returned under $29,000.BTC/USD 1-hour candle chart (Bitstamp). Source: TradingViewMarkets “eerily calm” post FOMCData from Cointelegraph Markets Pro and TradingView tracked an uninspiring day for Bitcoin, with $800 of losses coming in a single hourly candle several hours before the start of trading.The largest cryptocurrency had avoided volatility on the release of minutes from the United States Federal Reserve’s Federal Open Markets Committee (FOMC). These had avoided any serious divergence from already known facts about economic policy, and despite concerns anti-inflation measures could lead to a recession, no mention of the word “recession” appeared in the minutes.Even legacy markets remained comparatively cool, with analyst Dylan LeClair describing the situation as “eerily calm” based on volatility data.Cointelegraph contributor Michaël van de Poppe, who on May 25 had predicted a move towards $32,800 for BTC/USD, reiterated that a breakout from its current trading zone was “coming relatively soon.”Breakout is coming relatively soon for #Bitcoin and if we combine that with FA, then we can clearly assume that;- Jobless claims- PCE inflation Are going to be the trigger. If inflation slows down or jobless claims are fine, the FED might be slowing down the policy. pic.twitter.com/WCEgQhMvXm— Michaël van de Poppe (@CryptoMichNL) May 26, 2022For the meantime, however, on-chain signals meant that there was likely no impetus for significant price changes, according to fellow trader and analyst, Rekt Capital.Analyzing on-chain volumes, it became clear that neither buyers nor sellers were prepared to make a bold statement at current levels.”Previous periods of high sell-side BTC volume preceded periods where buyer volume started trickling in in the following weeks. But now, we’re seeing that a) seller volume is declining over time. And b) no $BTC buyer volume has come in following the high seller volume,” he explained to Twitter followers on the day.BTC/USD 1-week annotated chart. Source: Rekt Capital/ TwitterAs Cointelegraph reported, NVT Golden Cross, a long-term metric designed to catch price tops and bottoms using volume, flashed red this week as it appeared that on-chain transactions were not significant enough to support even $30,000 levels.Dogecoin targets new yearly lows in altcoin routAltcoins presented a mixed bag on the day, with Ether (ETH) noticeably among the weakest of the  major cap tokens.Related: U.S. dollar index retreats from 20 year highs — but will DXY topping spark a Bitcoin recovery?With the exception of the May 12 wick, ETH/USD traded at its lowest in ten months on May 26, hitting $1,815 on Bitstamp.”The question will be whether we can bounce from here and break the $1,940 level,” Van de Poppe said. “If that happens, I’m assuming we’ll continue $2,050. If it doesn’t, then the markets are looking at

Čítaj viac

Bitcoin 'finally' due for $32.8K as long-term BTC price metric flashes overvalued

Bitcoin (BTC) briefly returned to $30,000 before the May 25 Wall Street open as range adherence lingered.BTC/USD 1-hour candle chart (Bitstamp). Source: TradingViewTrader: BTC should challenge 2-week highsData from Cointelegraph Markets Pro and TradingView showed BTC/USD managing to hit $30,189 on Bitstamp before consolidating back under the $30,000 mark. While appearing uninspiring at first glance, Bitcoin on low timeframes was a source of fresh interest for Cointelegraph contributor Michaël van de Poppe, who predicted a run to near $33,000 next.“Bitcoin broke through $29.4K and ran towards the next resistance zone,” he told Twitter followers. “If we hold $29.4K, we’ll be good towards $32.8K. Finally.”$32,800 would represent Bitcoin’s highest since May 9 — just before the Terra implosion sparked its cascade to ten-month lows.Fellow trader Nebraskan Gooner meanwhile eyed a series of higher lows on the 4-hour chart, highlighting $30,400 as “the line to beat.”#BitcoinVery interesting..$30.4k the line to beat now. pic.twitter.com/8T7Iw1b62q— Nebraskangooner (@Nebraskangooner) May 24, 2022Metric hints BTC price “overvalued”Beyond intraday price action, however, cold feat among many analysts remained. Related: Largest difficulty drop since July 2021 — 5 things to know in Bitcoin this weekFor on-chain analytics platform CryptoQuant, concerning signs from the network transaction value (NVT) Golden Cross metric suggested a retracement was incoming.Designed to catch local tops and bottoms, a spike in NVT Golden Cross, as was occurring on the day, reinforced the idea that volume was not sufficient to sustain upwards trajectory.“We have a significant change in the NVT Golden Cross indicator where it has reached its most overvalued position since April last year before the dip to the June lows,” CryptoQuant contributing analyst Kripto Mevsimi told Cointelegraph.As Cointelegraph reported, forecasts for a generational bottom in BTC/USD included as low as $15,500 this week.A new all-time high, meanwhile, might have to wait until 2024, when Bitcoin’s next halving cycle begins.Bitcoin NVT Golden Cross chart. Source: CryptoQuantThe views and opinions expressed here are solely those of the author and do not necessarily reflect the views of Cointelegraph.com. Every investment and trading move involves risk, you should conduct your own research when making a decision.

Čítaj viac

Bitcoin price returns to weekly lows under $29K as Nasdaq leads fresh US stocks dive

Bitcoin (BTC) fell on the May 24 Wall Street open as weakness in stocks saw sell-side pressure return.BTC/USD 1-hour candle chart (Bitstamp). Source: TradingViewEquities give crypto no respiteData from Cointelegraph Markets Pro and TradingView followed BTC/USD as it revisited its lowest levels of the past seven days.At the time of writing, BTC/USD traded at around $28,800 amid volatility, having hit $28,614 on Bitstamp — a zone last seen on May 18.The S&P 500 lost 2.4% on the open, while the Nasdaq 100 managed a 3.5% decline.Stocks once again controlling the price of #Bitcoin. What’s surprising is how well it’s holding up relatively though. Most stocks having way larger daily drops than $BTC.— IncomeSharks (@IncomeSharks) May 24, 2022In a fresh Twitter update, Cointelegraph contributor Michaël van de Poppe flagged a pivot point of $29,400 remaining as resistance, opening up the opportunity for a “sweep” of lower support levels.”No break of that area at $29.4K, so we’ll see levels that Bitcoin could be testing here,” he commented alongside a chart showing the targets. “Grey zone has been supported the past week, but a sweep and test around $28.3Kish isn’t a bad thing either. Would be massive for longs.”BTC/USD annotated chart. Source: Michaël van de Poppe/ TwitterFor on-chain monitoring resource Material Indicators, meanwhile, a wall of bid support formed the basis for assessing where BTC/USD could go next.Woke up to #Bitcoin sitting on top of ~$50M in bid liquidity. This could be a good setup for a rally, but lately these concentrations of liquidity have been getting taken. Waiting to see if this is truly support or it aims to get filled. #FireChartshttps://t.co/VzE3V2kA8Q pic.twitter.com/VgKJw9h0kP— Material Indicators (@MI_Algos) May 24, 2022

A subsequent update showed the market eating into the wall, which had little presence below $28,800.Altcoin drop intensifiesAltcoins once more accelerated declines on the day, with several of the top ten cryptocurrencies by market cap approaching 10% daily losses.Related: Bitcoin dives to fill CME gap amid claim new all-time highs will take 2 yearsEther (ETH) lost $2,000 to trade at around $1,920 at the time of writing and approaching its last line of support above the wick down to $1,700 lows seen last week.ETH/USD 1-hour candle chart (Binance). Source: TradingViewThe biggest loser on the day was Solana (SOL), which traded down 9.3% at $48.The views and opinions expressed here are solely those of the author and do not necessarily reflect the views of Cointelegraph.com. Every investment and trading move involves risk, you should conduct your own research when making a decision.

Čítaj viac

Bitcoin price may bottom at $15.5K if it retests this lifetime historical support level

Bitcoin (BTC) could be in for a return to levels not seen since before its 2020 bull market if history repeats itself.That was according to new analysis released on May 24, which studied Bitcoin’s interaction with its 200-week moving average (WMA).Bitcoin floor target could be between $15,500 and $19,000In a Twitter thread, popular trader and analyst Rekt Capital explained how BTC/USD could behave should it fall to retest the 200WMA.A lifeline throughout Bitcoin’s history, the 200WMA is a constantly rising line of last support that has never been definitively broken. Currently sitting at around $22,000, data from Cointelegraph Markets Pro and TradingView shows that the level continues to act as a line in the sand when it comes to bear markets.In times past, Rekt Capital notes, Bitcoin has been “wicked” below the 200WMA — briefly capitulating before rising back above, allowing it to remain as support and not instead flip to resistance.Those wicks, however, have involved up to 28% of the spot price, meaning that should a similar wick occur now, Bitcoin would end up at $15,500.”BTC tends to wick -14% to -28% below the 200-MA. And since the $BTC 200-MA now represents the price point of ~$22000… A -14% downside wick below the 200-MA would result in a ~$19000 Bitcoin,” Rekt Capital wrote.”And if BTC were to repeat the March 2020 downside wicking depth below the 200-MA $BTC would revisit the ~$15500 price point.”BTC/USD 1-week candle chart (Bitstamp) with 200WMA. Source: TradingView”Pay attention” below $23,000As Cointelegraph reported, much has been made of Bitcoin price action on May 24 compared to March 2020 at the height of the COVID-19 cross-market crash.Related: Bitcoin dives to fill CME gap amid claim new all-time highs will take 2 yearsRekt Capital additionally examined historical drawdowns from all-time highs and Bitcoin’s “death crosses” this month, producing a BTC price target of $22,700 — almost exactly at the current 200WM.”BTC is slowly approaching the 200-MA Historically, the 200-MA tends to offer fantastic opportunities with outsized ROI for long-term $BTC investors (green circles),” he added alongside a chart showing interactions. “Should BTC indeed reach the 200-MA support… It would be wise to pay attention.”BTC/USD annotated chart with 200-week MA. Source: Rekt Capital/ TwitterFellow analyst PlanB, the creator of the stock-to-flow BTC price models, has also long championed the role of the 200WMA as support.The views and opinions expressed here are solely those of the author and do not necessarily reflect the views of Cointelegraph.com. Every investment and trading move involves risk, you should conduct your own research when making a decision.

Čítaj viac

Bitcoin dives to fill CME gap amid claim new all-time highs will take 2 years

Bitcoin (BTC) stuck to “rangebound movements” into May 24 as price action avoided expected volatility.BTC/USD 1-hour candle chart (Bitstamp). Source: TradingViewNo joy for BTC bulls after DXY downmoveData from Cointelegraph Markets Pro and TradingView showed BTC/USD returning to circle $29,000 after failing to hold $30,000 support.On hourly timeframes, the pair thus continued a familiar pattern of swings between the two zones, refusing to explore more extreme territory either up or down.”The crucial breaker for Bitcoin is again the $29.4K area. If that breaks – > next test at $30K,” Cointelegraph contributor Michaël van de Poppe summarized in his latest Twitter update. “Overall, range-bound movements.”The ongoing World Economic Forum Annual Meeting likewise gave no meaningful market-moving signals on its first days as Bitcoiners gathered in Oslo for what Human Rights Foundation chief strategy officer Alex Gladstein called the “diametrically opposed” Oslo Freedom Forum.BTC/USD did manage to close the CME futures gap to the downside, which had opened at the end of the previous week. “US Stocks showing signs of reversal this week. $BTC dropped with them, and now will pump back with them. Very obvious CME gap fill. Don’t be left behind,” popular Twitter account IncomeSharks continued.CME Bitcoin futures 1-hour candle chart. Source: TradingViewContinuing the macro theme, markets commentator tedtalksmacro offered an explanation as to why crypto and risk assets more broadly were not making more of the new weakness in the U.S. dollar. The U.S. dollar index (DXY) stood at 102 on the day, down 3 points from its twenty-year highs seen last week.You’d think that the dollar index dumping would mean higher equities and #BTC but nope!The DXY is moving lower due to hawkish comments from the ECB and not due to a natural increase in risk-appetite… hence zero impact on crypto and stonks.(The euro makes up ~58% of the DXY) https://t.co/jSd6KlJk3L pic.twitter.com/GXICGmV1Pd— tedtalksmacro (@tedtalksmacro) May 24, 2022Two-year wait for $69,000?Looking ahead, meanwhile, hopes of significant gains for Bitcoin were few and far between.Related: Bitcoin’s current setup creates an interesting risk-reward situation for bullsFor Il Capo of Crypto, the Twitter commentator well known for their sober takes on the BTC price outlook, hodlers should only hope to beat current $69,000 all-time highs in 2024.That year marks Bitcoin’s next block subsidy halving, when the reward given to miners decreases by 50% from 6.25 BTC to 3.125 BTC per block.No. I expect a good recovery after this last leg down (100-500% bounces depending on the coin), but later this year we could see the continuation of the bear market. Not expecting new ATHs until mid-late 2024 (post next halving) https://t.co/U7lfFPmSqN— il Capo Of Crypto (@CryptoCapo_) May 24, 2022

General consensus already favors a further “capitulation” style event to take BTC/USD below May’s $23,800 lows.As Cointelegraph reported, current spot price action presents an increasing squeeze on miner profitability. Difficulty was set to decrease by an estimate 3.2% on May 25, its largest downmove since July 2021.The views and opinions expressed here are solely those of the author and do not necessarily reflect the views of Cointelegraph.com. Every investment and trading move involves risk, you should conduct your own research when making a decision.

Čítaj viac

Získaj BONUS 8 € v Bitcoinoch

nakup bitcoin z karty

Registrácia Binance

Burza Binance

Aktuálne kurzy