Autor Cointelegraph By William Suberg

Bitcoin price hits 11-week high as US Treasury doubles debt buyback size

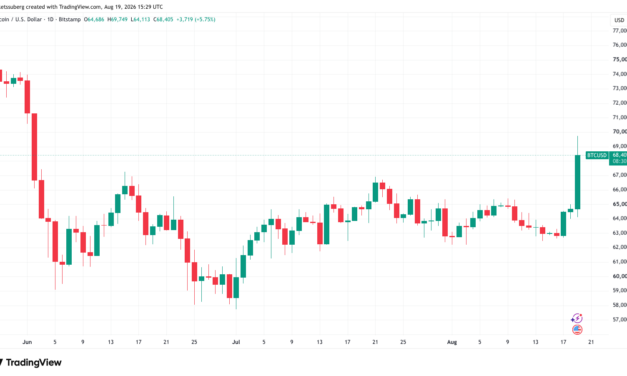
Bitcoin (BTC) saw its highest levels since the start of June after Wednesday’s Wall Street open as markets reacted to a US government liquidity move.Key points:Bitcoin spikes 6% on the day to hit $69,749, its highest level since June 2.The US Treasury plans to at least double the maximum size of debt buyback operations to $4 billion. This might fuel a broader risk-asset rally.A lack of stablecoin liquidity on exchanges means that BTC price upside remains limited, says Bitfinex. Stablecoin liquidity has decreased by $14 billion since May.Bitcoin surges as US bond yields fall on buyback planData from TradingView showed BTC/USD passing $69,700 on Bitstamp, up 6% on the day.BTC/USD one-day chart. Source: Cointelegraph/TradingViewUS stock markets opened higher after the US Treasury Department announced that it would at least double the level of government debt buybacks, from $2 billion to a minimum of $4 billion per operation, beginning on Sept. 9. The US 30-year bond yield, which had hit its highest level in nearly 20 years on Tuesday, fell immediately on the news and was at 5.19% at the time of writing, down 9bps.“This increase in buyback operation sizes reflects Treasury’s desire to provide greater liquidity support in longer-dated nominal sectors where there is consistent strong sponsorship from market participants, as evidenced by the significant volume of high-quality offers Treasury routinely receives in longer-dated buyback operations,” an official press release stated.US 30-year bond yields one-day chart. Source: Cointelegraph/TradingViewIncreased debt buybacks mean that the US government will add liquidity as a buyer to the longer-term debt market. Earlier, analysts pointed to increasing corporate debt, especially in the AI sector, as one motivator of the yield surge. “This is NOT a debt paydown, it is just a rearrangement of the maturity schedule of Treasuries,” Peter Boockvar, chief investment officer at One Point BFG Wealth Partners, said, quoted by CNBC.The announcement comes as US national debt approaches the symbolic milestone of $40 trillion. On Tuesday, trading resource The Kobeissi Letter noted that interest payments on the debt pile had reached $1.4 trillion over the past 12 months alone, tripling since 2020.“If rates remain stable, interest payments are set to rise to $1.7 trillion by November 2028,” it forecast in a post on X alongside data from Bank of America.US Treasury interest payment data. Source: The Kobeissi Letter on X.comStablecoin liquidity keeping Bitcoin rebound in check: BitfinexDiscussing current BTC price strength versus the S&P 500, which hit new all-time highs last week, crypto exchange Bitfinex pointed to Bitcoin’s own liquidity problem. Stablecoin supplies on exchanges, it noted, had decreased by $14 billion since May.Related: Bitcoin has ‘largely purged’ froth that preceded 50% drop from $126K: BlackRock“Until stablecoin supply turns, the rally stays unfunded,” it told X followers.Stablecoin liquidity acts as “dry powder” waiting on the sidelines to be deployed into cryptoassets, and its absence reflects a belief among investors that major opportunities are not yet imminent.Data from onchain analytics platform CryptoQuant’s Stablecoin Supply Ratio (SSR) indicator, which measures Bitcoin’s market cap relative to the aggregate stablecoin market cap, reflects tightening liquidity conditions over the past six weeks in particular.A higher SSR means that stablecoin liquidity is leaving exchanges, and since June 30, it has risen from 9.82 to 11.69. The highest SSR reading of 2026 was observed on Jan. 14 at 12.83.Bitcoin SSR data. Source: CryptoQuant

Čítaj viac
Bitcoin has ‘largely purged’ froth that preceded 50% drop from $126K: BlackRock

Bitcoin (BTC) falling more than 50% from its $126,200 all-time high was a “positioning correction,” BlackRock says.Key points:A BlackRock report attributes Bitcoin’s decline below $60,000 to cascading liquidations as leverage was purged from the market.The long-term BTC investment thesis as a “low-correlation diversifier” remains intact, analysts confirm.BlackRock sees Bitcoin’s risk-asset correlation declining as time goes on.BlackRock predicts falling correlation of BTC with risk assetsIn a report published this week, the world’s largest asset manager preserved its bull thesis despite waves of outflows from its spot Bitcoin exchange-traded fund (ETF) in 2026.BlackRock’s iShares Bitcoin Trust (IBIT) saw net outflows of $78.9 million in the week through Aug. 14. Across all ETF products, outflows totaled $267.2 million.“We view bitcoin’s ~50% pullback from October 2025 highs as a positioning correction rather than a change in its investment case. A historically overleveraged market, enabled by perpetual futures, suffered cascading liquidations compounded by slowing ETP outflows and digital asset treasury demand,” the report states.US spot Bitcoin ETF netflows (screenshot). Source: Farside InvestorsDuring last year’s peak, Bitcoin experienced a surge in speculative positioning. BlackRock pointed to open interest on Bitcoin derivatives markets passing $90 billion in early October amid heavy use of leverage. The unwinding of these positions increased the correlation between BTC/USD and risk assets more broadly. “A macro-driven risk-off catalyst (China tariff headlines) triggered large-scale deleveraging across precious metals and crypto markets. The resulting liquidation waves drove prices down to cycle lows below $60,000 per bitcoin by June 2026,” it explained.Bitcoin futures open interest data (screenshot). Source: BlackRockInstitutional Bitcoin demand has suffered this year as a combination of geopolitical uncertainty and growing inflation pressures saw capital flowing into established risk-asset classes, among them US equities, with the S&P 500 hitting record highs last week. Bitcoin has failed to follow suit, but BlackRock forecasts that this may change.“With speculative excess now largely purged, we believe bitcoin’s recent episodes of elevated risk correlation should normalize lower, consistent with its longer-term record as a low-correlation diversifier,” it continued.Longer-term resilience of BTC stands outThe report highlights that long-term BTC investment returns follow key political and macro events. These include the COVID-19 outbreak in March 2020, the US presidential election the same year, as well as the regional banking crisis and president Donald Trump’s multiple international trade-tariff declarations. Related: Bitcoin price spike to $64.5K was ‘low-volume liquidity trap’: AnalysisWhile it initially struggled following some of these events, Bitcoin produced solid returns on a 60-day basis. In the case of the 2020 election, these hit as high as 113%.“Through multiple shocks in recent years, bitcoin often outperformed both the S&P 500 and gold in the weeks and months following the onset of disruptions,” BlackRock commented.“This pattern has held true thus far in 2026 amid ongoing conflict between the U.S. and Iran, with bitcoin delivering positive returns and outperforming equities and gold following the onset of hostilities in February and the end of the ceasefire agreement in July.”Macro asset returns comparison (screenshot). Source: BlackRockFurther data puts Bitcoin’s 12-month realized volatility at 40% compared to 26% for gold and 12% for the S&P 500. The rolling six-month correlation between Bitcoin and the S&P, presented as a 10-year average, is now 0.18 — still notably higher than gold’s 0.06 reading.“Bitcoin’s underlying investment case aligns more closely with that of gold — as a global monetary alternative and a hedge against inflation, global disorder, and declining trust in fiat currencies. Even for gold, which tends to be viewed as a standard uncorrelated, store-of-value asset, brief periods of high equity correlation exist, including COVID in 2020-2021 and the monetary easing cycle in 2023,” the report added.Bitcoin vs. S&P 500 correlation data (screenshot). Source: BlackRockSince October 2025, BTC price performance has led some to question its role as a form of “digital gold.” In a Q1 report, asset manager Grayscale described short-term behavior as being more like a growth stock than gold, noting its low correlation to the latter.

Čítaj viac

Bitcoin tags $65K as S&P 500 rebounds from 2-week lows on US-Iran rhetoric

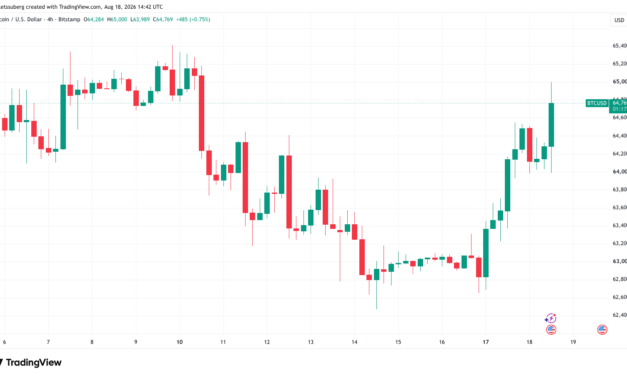
Bitcoin (BTC) hit $65,000 after Tuesday’s Wall Street open as US stocks rebounded in spite of geopolitical pressure.Key points:Bitcoin reaches $65,000 for the first time since Aug. 10 as risk assets navigate fresh US-Iran signals.Analysis warns of surging US 30-year bond yields, which hit 29-year highs of 5.34%.BTC price analysis flags decision time on a head-and-shoulders bottoming structure.Bitcoin diverges from US stocks as Trump says Strait of Hormuz “open”Data from TradingView showed BTC/USD building on the week’s gains as the S&P 500 bounced from 7,696, its lowest level since Aug. 4.BTC/USD four-hour chart. Source: Cointelegraph/TradingViewThis came after US president Donald Trump posted a map of the closed Strait of Hormuz oil route to Truth Social where it was labeled “new US territory.”Both the US and Iran lay claim to control of Hormuz, with Trump threatening US ally Oman with military action over its plans to work with Iran on charging tolls to shipping traffic. In a subsequent post, Trump confirmed that further diplomacy with Iran was not on the agenda.“There are no talks or conversations going on, or scheduled, with the Islamic Republic of Iran. The Naval Blockade remains in full force and effect. The Hormuz Strait is open and operating. All water mines have been removed or detonated,” he wrote.S&P 500 one-day chart. Source: Cointelegraph/TradingViewAs on Monday, oil avoided major volatility, with WTI crude down 1% at the time of writing at $84 per barrel. US government bonds continued to show strain, with the 30-year yield hitting 5.34%, its highest since January 2007.“Bond prices are sending warnings,” BNY Mellon analyst Geoff Yu wrote in a research note quoted by the New York Times. Yu said that the surge came as “investors demand more compensation for inflation risk,” while also attributing the upside to government borrowing. US 30-year bond yields one-month chart. Source: Cointelegraph/TradingViewBTC price faces crunch rebound testUpdating X followers on BTC/USD, trader and analyst Aksel Kibar eyed the culmination of a potential reverse head-and-shoulders pattern at $62,300. Related: Bitcoin price spike to $64.5K was ‘low-volume liquidity trap’: Analysis“If $BTCUSD is going to rebound, it has to come from here,” he argued on Monday.Kibar offered a $53,000 target in the event of the head-and-shoulders structure failing, with $76,000 a potential upside target should the rebound sustain. BTC/USD one-day chart. Source: Aksel Kibar on X.comPreviously, Cointelegraph reported that underwater investors were contributing to Bitcoin’s inability to break higher. Its rebound to $64,500 also stopped short of an overhead trend line, the 50-month exponential moving average (EMA). This moving average is now in place as resistance at $65,827.

Čítaj viac

Bitcoin price spike to $64.5K was ‘low-volume liquidity trap’: Analysis

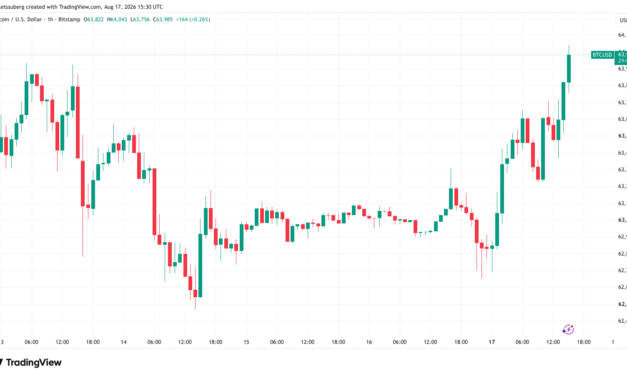
Bitcoin (BTC) short liquidations hit their highest in almost one month as it hit $64,500 on Monday, new data reveals.Key points:Bitcoin passed $64,000 thanks to a short squeeze on derivatives markets, CryptoQuant says.An ongoing downward funding-rate reset from 0.006% to 0.003% over 24 hours could mean further short squeezes.The absence of spot demand raises doubts whether the upside is sustainable after a week of $267.2 million in net ETF outflows.Bitcoin short liquidations near one-month high BTC/USD rallied after Sunday’s weekly close, gaining up to 3% on Monday to top out at one-week highs of $64,550 on Bitstamp. BTC/USD one-hour chart. Source: Cointelegraph/TradingViewExamining the impetus behind the latest BTC price gains, onchain analytics platform CryptoQuant pointed to illiquid markets and funding-rate imbalances among exchanges.Before rebounding on Monday, BTC circled near $62,750. Around this level, funding rates between exchanges began to diverge. Shorts were dominant on major platforms such as Binance, Bybit, OKX and Deribit, while the funding rate on HTX briefly spiked to 0.05%.Funding rates refer to periodic payments exchanged by long and short traders on Bitcoin derivatives markets in order to maintain their positions. Positive aggregate funding rates show that long traders are actively paying shorts, with the reverse true for negative funding rates.“This crowded short positioning served as the primary catalyst, fueling a short squeeze that drove prices higher,” CryptoQuant continued.BTC/USD one-hour chart with exchange funding-rate data (screenshot). Source: CryptoQuantData puts total Bitcoin short liquidations at 637 BTC for Monday, the largest single-day tally since July 21.Describing the event as a “low-volume liquidity trap,” CryptoQuant nonetheless suggested that the market could see more short squeezes next, with funding rates already declining again as traders increase short exposure.Bitcoin short liquidations. Source: CryptoQuantCrucial spot demand remains absentPreviously, Cointelegraph reported that Bitcoin futures markets accounted for the majority of trading volume in the current range, with spot traders broadly uninterested. Related: BTC price loses 200-week trend line as 2022 repeats: Five things to know in Bitcoin this weekIn further analysis on Monday, CryptoQuant called the lack of spot demand the primary hurdle to sustained upside, alongside the lack of inflows to the US spot Bitcoin exchange-traded funds (ETFs).“A break below $60K alongside rising exchange inflows would weaken the structure and increase downside risk toward $50K. Selling pressure is cooling, but demand still needs to return,” it commented.Recent buyers who remain underwater on their BTC allocation have helped cement the current trading range. Short-term holders — wallets holding a UTXO for less than 155 days — have their cost basis at around $68,700, reinforcing that level as resistance.

Čítaj viac

Bitcoin hits $64K as gold gains while oil shakes off Trump Oman threat

Bitcoin (BTC) returned to $64,000 after Monday’s Wall Street open as US stocks gave way to gold.Key points:Bitcoin continues a rebound from Sunday’s weekly close, gaining 2% on Monday.Oil stays steady after US president Donald Trump threatens to bomb Oman over the Strait of Hormuz.Bitcoin funding rates hit 20-month highs of 0.022 last week, data reveals. Bitcoin inches up as US-Iran rhetoric spreads to OmanData from TradingView showed BTC/USD up by more than 2% on the day, rebounding from Sunday’s weekly close. BTC/USD one-hour chart. Source: Cointelegraph/TradingViewUS equities turned lower as an agreed 60-day ceasefire between the US and Iran was set to expire, with the S&P 500 index down 0.5% from Thursday’s all-time highs. S&P 500 one-hour chart. Source: Cointelegraph/TradingViewSpeaking to Fox News, Trump threatened Oman with military action amid an ongoing dispute over the reopening of the Strait of Hormuz oil route.“If Oman gets in the way, we’ll bomb the s*** out of them,” he told the network.Oil markets appeared unfazed by the tensions, with WTI crude flat at $82.35 per barrel at the time of writing.Safe haven gold was more volatile, gaining just over 1% to start the week to reach a daily high of $4,427 per ounce. Earlier, Cointelegraph reported on a combination of retail and government interest fueling gold’s multiweek highs.XAU/USD one-hour chart. Source: Cointelegraph/TradingViewData from investment research platform Bytetree tracking the 30-day change in inflows to gold-backed exchange-traded funds (ETFs) put the figure at nearly $12 billion through Aug. 13.In a note on Monday quoted by Investing.com, Bank of America strategist Michael Hartnett wrote that long gold remained the trade, describing it as “still [sic] best hedge against dollar debasement, bond collapse, asset inflation, capitalist populism vs socialist populism politics of 2020s.”Related: BTC price loses 200-week trend line as 2022 repeats: Five things to know in Bitcoin this weekFunding rates hit levels not seen since late 2024In its latest Market Color bulletin published on Monday, trading company QCP Capital noted Bitcoin’s continued ability to weather macro tailwinds without a major breakdown from its current range.“Rather than treating individual price levels as directional signals, the more useful observation is that BTC remains close to the lower end of its recent range. A sustained move outside that range would provide more information about market positioning than the relatively contained moves seen within it,” it wrote.Earlier, Cointelegraph reported on expectations that a return to $61,000 would trigger an unwinding of BTC long positions, adding to downside BTC price momentum.The latest data from CoinGlass showed liquidations remaining muted as BTC/USD returned toward $64,000, with 24-hour cross-crypto liquidations at $180 million.Crypto liquidation history (screenshot). Source: CoinGlassIn a sign of long BTC becoming an increasingly crowded trade, derivatives market funding rates hit 20-month highs of 0.022 on Aug. 14, per data from onchain analytics platform CryptoQuant.“The derivatives market sentiment is positive within the current BTC price range, indicating that most traders are taking long positions,” it commented on the readings.CryptoQuant previously noted that futures trading volume on Binance was outweighing spot markets by almost eight times.Bitcoin funding rates chart. Source: CryptoQuant

Čítaj viac

Získaj BONUS 8 € v Bitcoinoch

nakup bitcoin z karty

Registrácia Binance

Burza Binance

Aktuálne kurzy