Autor Cointelegraph By William Suberg

Bitcoin to set a new record 9-week losing streak with BTC price down 22% in May

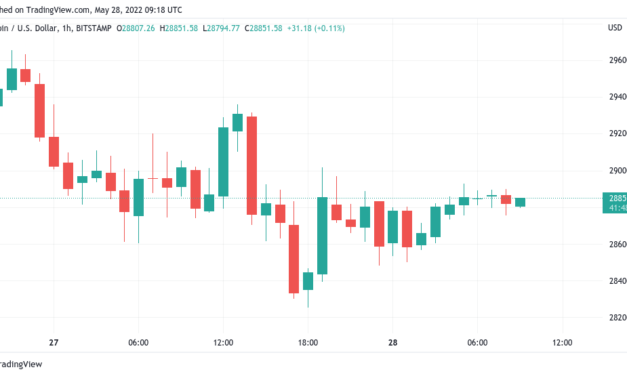
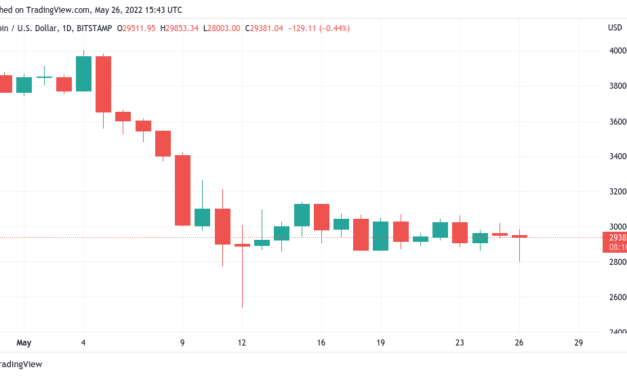
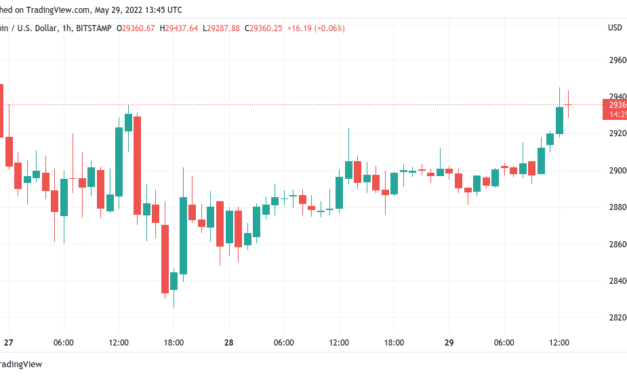
Bitcoin (BTC) threatened to continue an unprecedented losing streak on May 29 as BTC/USD stayed in a right intraday range.BTC/USD 1-day candle chart (Bitstamp). Source: TradingViewStocks correlation offers no comfort to BTC bullsData from Cointelegraph Markets Pro and TradingView flagged the largest cryptocurrency heading for nine weeks of downtrend in a row — the most in history.Already at a dubious record, Bitcoin’s weekly chart closes provided the backdrop to weakness that continued to disappoint analysts over the weekend.Even stock markets, troubled by central bank tightening, managed to put in gains over the week, while Bitcoin and the majority of altcoins added to losses.”Most concerning has been the divergence between Equities and Crypto. S&P and NASDAQ have traded about 10% higher since 20 May lows while both BTC and ETH have traded lower in the same period,” trading firm QCP Capital wrote to subscribers of its markets newsletter, the latest edition of which was released on May 29. “This is not the direction of decoupling we were hoping for!”QCP echoed existing sentiment over Bitcoin’s underperformance compared to previously highly-correlated equities.Continuing, popular Twitter account Il Capo of Crypto forecast fresh pressure thanks to those indices now encountering sellside friction of their own.”Last time SPX rallied making a new high while $BTC was making lower highs, we saw bearish continuation once SPX reversed. Now SPX is at resistance,” a post on the day read.Bitcoin faces the “darling dips of May”With that, BTC/USD was primed to end the month down around 22%. Related: Small Bitcoin whales may be keeping BTC price from ‘capitulation’ — analysisThis would make May 2022 the second worst May in Bitcoin’s history, data from on-chain monitoring resource Coinglass confirmed.BTC/USD monthly returns chart (screenshot). Source: CoinglassAnalysis of downtrends over time meanwhile revealed that the current descent from highs was the fourth-longest ever, now at 200 days.Noted by analyst Matthew Hyland, the longest-ever such downtrend occurred in 2014-15 and lasted more than twice as long.#Bitcoin is currently in its 4th longest downtrend in its entire history: pic.twitter.com/bnT8uXIOsb— Matthew Hyland (@MatthewHyland_) May 29, 2022As Cointelegraph further reported, historical patterns dictate that a period of sideways price action could now continue, followed only later a capitulation event and macro bottom.The views and opinions expressed here are solely those of the author and do not necessarily reflect the views of Cointelegraph.com. Every investment and trading move involves risk, you should conduct your own research when making a decision.

Čítaj viac

Bitcoin price stuck below $29K as Terra LUNA comes back from the dead

Bitcoin (BTC) analysts faced another day of frustration on May 28 as BTC/USD refused to offer volatility up or down.BTC/USD 1-day candle chart (Bitstamp). Source: TradingView”Not the decoupling we wanted”Data from Cointelegraph Markets Pro and TradingView showed the largest cryptocurrency sticking in a narrow short-term range into the weekend.Previously forecast support levels to avoid a deeper correction managed to hold in the May 27 Wall Street trading session, but a bounce higher was similarly absent as commentators looked for fresh cues.”Short resistance and long support until one of them breaks. Keep it simple in ranges as they are there to engineer liquidity for trend continuation or reversals,” popular trading account Crypto Tony summarized in part of a recent tweet.Others focused on Bitcoin’s relative underperformance when compared with stocks, which finished up at the end of the week. The S&P 500 gained 2.47% on May 27, while the Nasdaq Composite Index was up 3.33%.Well, it looks like this time might be different. Also, this is not the decoupling that we wanted. #Bitcoin $BTC https://t.co/3YSFbL4rcb pic.twitter.com/krFEurFkaf— Jan Wüstenfeld (@JanWues) May 27, 2022Unlike Bitcoin, equities markets were making the most of a continued downtrend in the strength of the U.S. dollar.The U.S. dollar index (DXY) circled 101.6 on the day, down from highs of 105, which had marked a peak last seen in late 2002.Analyst Matthew Hyland noted that the index’s reversal meant that it was now challenging its overall uptrend from the beginning of the year.US Dollar (DXY) Weekly RSI heading toward a crucial test of the trend line that started at the start of the year: pic.twitter.com/529BsZxshD— Matthew Hyland (@MatthewHyland_) May 28, 2022

Do Kwon confirms LUNA rebirthOn altcoins, the revival of the controversial Blockchain protocol Terra was greeted by limp performance.Related: Exchanges back ‘Terra 2.0 revival plan’ via airdrops, listing, buyback and burningTerra co-founder Do Kwon confirmed the launch of the new mainnet for in-house token LUNA on the day.To view your $LUNA (or $LUNA2 as some exchanges call them) token balances, you only need to log into station and refresh the pageFor new users coming in from IBC et all, create a station wallet with the same ledger and station should walk you through the remaining steps https://t.co/1ZKmCGKLvp— Do Kwon (@stablekwon) May 28, 2022

At the same time, concern was mounting over other major altcoin projects, notably Celsius (CEL), which had managed to drop from $0.80 to around $0.50 in under a week.CEL/USD 1-hour candle chart (FTX). Source: TradingViewHex (HEX), a project which had aroused suspicion throughout its existence, suffered a similar fate, declining from just over $0.11 a week ago to lows of under $0.05.The top ten cryptocurrencies by market cap nonetheless copied Bitcoin’s low-volatility behavior in the 24 hours to the time of writing, with only Dogecoin (DOGE) seeing noticeable moves, this time to the upside to reclaim $0.08.DOGE/USD 1-hour candle chart (Binance). Source: TradingViewThe views and opinions expressed here are solely those of the author and do not necessarily reflect the views of Cointelegraph.com. Every investment and trading move involves risk, you should conduct your own research when making a decision.

Čítaj viac

Bitcoin price approaches key support levels to avoid 'cascade south'

Bitcoin (BTC) clung to $29,000 at the May 27 Wall Street open as crucial support levels lay just hundreds of dollars from spot price.BTC/USD 1-day candle chart (Bitstamp). Source: TradingViewTrader demands higher low above $28,000Data from Cointelegraph Markets Pro and TradingView confirmed volatility once again waning in a frustrating week’s price action.BTC/USD found itself in a tight corridor on the day, and for Cointelegraph contributor Michaël van de Poppe, it would not take much deviation to disrupt the status quo.”Technically speaking, when it comes to Bitcoin, you clearly want to see a higher low happening here, and if that we happens, we can start seeing continuation,” he said in his latest YouTube update.Levels to hold now were nearby — $28,600 and $28,200 in order to avoid a rematch of the week’s $28,000 low and risk giving up the chance of a higher low construction.”If that is lost, then I’m going to expect ourselves to get towards $26,000 as then we’re going to start cascading south even more,” he concluded.Equally wary was commentator Bob Loukas, who eyed the Bollinger Bands volatility indicator on the day to warn of potential incoming upset.$BTC – Weak and not a good look there, no urgency, with that primary trend lower. Should have seen at least a rally early in the cycle, coming of some capitulation. Stay safe. pic.twitter.com/fYfZka2R1C— Bob Loukas (@BobLoukas) May 27, 2022Across social media, the sense that a capitulatory move was coming for crypto prevailed, this having characterized sentiment throughout recent weeks.In-profit supply favors bearsMeanwhile, looking at the network as a whole fueled concerns that current prices could not endure.Related: Small Bitcoin whales may be keeping BTC price from ‘capitulation’ — analysisAnalyzing the percentage of the supply in profit, Kripto Mevsimi, a contributing analyst at on-chain analytics platform CryptoQuant, drew bearish conclusions.Currently, around 55% of the supply was in profit, he explained, and compared to historical behavior, more price capitulation should enter in order to provide some guarantee of a macro bottom.First, however, there should be a sideways period for BTC/USD which precedes the final dip. This would make current price performance chime with the 2018 bear market and the March 2020 crash.”Next; 2-3 months of boring price action. Then last capitulation possible with %30-%50 additional price drop,” he summarized.An accompanying chart compared the three phases beginning with the 2017 high of $20,000.Bitcoin supply in profit vs. BTC/USD annotated chart. Source: CryptoQuantThe views and opinions expressed here are solely those of the author and do not necessarily reflect the views of Cointelegraph.com. Every investment and trading move involves risk, you should conduct your own research when making a decision.

Čítaj viac

Small Bitcoin whales may be keeping BTC price from 'capitulation' — analysis

Bitcoin (BTC) could still see a major price capitulation, but more whales need to start selling first, data suggests.In one of its daily QuickTake market updates on May 27, on-chain analytics platform CryptoQuant highlighted increasingly bearish whale behavior.Small whale selling should spark “absolute capitulation”Amid widespread consensus that BTC/USD should put in a lower low than its May 12 pivot price of $23,800, some of Bitcoin’s largest holders are showing signs of impatience.Looking at unspent transaction outputs (UTXOs) from various “bands” of whale wallets, CryptoQuant contributor Binh Dang flagged selling from the top cohort increasing since April.Those entities with $1 million or more, known as “giant” whales, have upped their distribution of coins, while smaller whales — those with under $1 million — have been slower to shift their position.”After the dip was at the end of January, we still saw the accumulation because all of the leading value bands went up, but from the 21st of April to now, giant whales (range over 1M$ – USD) have been distributing and do not get any signals to accumulate now,” Dang explained.”If minor whales and retailers give up, I think we will see the absolute capitulation and bottom also. If not, I will keep an eye on positive movements in the range of $1M to consider a reversal.” An accompanying graphic showed realized supply from giant whales decreasing sharply, with $100,000-$1 million whales only now beginning to follow suit.By contrast, the $10,000-$100,000 and $1,000-$10,000 bands showed no signs of capitulation.”Giant whales keep going on the distribution. Minor ones and retailers keep the defensive state,” CryptoQuant lead on-chain analyst Julio Moreno added in private comments to Cointelegraph.Data from fellow on-chain analytics firm Glassnode meanwhile confirmed an overall decrease in the number of entities qualifying as whales.Once again, an acceleration since April pointed to whale distribution, and as of May 27, overall whale numbers were at their lowest since July 2020.Bitcoin entities with a balance above 1,000 BTC vs. BTC/USD chart. Source: GlassnodeEyes on volume triggersEarlier in May, whale buy levels formed key support targets below $27,000.Related: Bitcoin ‘good to go up’ after BTC price hits lowest since Terra crashFor on-chain monitoring resource Whalemap, these were of interest in the aftermath of the initial May 12 dip.In subsequent analysis, researchers showed that capitulatory events of the kind forecast for BTC/USD required coins moving at both a profit and a loss in elevated amounts.”On May 12th both profits AND losses were higher than usual,” part of an explanatory tweet stated, alongside a chart of moving profit/ loss (MPL) data. “A good example of capitulation was in Dec 2018 when similar MPL activity was present (but at a much larger scale).”This week, on-chain transaction volume saw a noticeable increase, Cointelegraph reported.Bitcoin moving profit/ loss (MPL) vs. BTC/USD annotated chart. Source: Whalemap/ TwitterThe views and opinions expressed here are solely those of the author and do not necessarily reflect the views of Cointelegraph.com. Every investment and trading move involves risk, you should conduct your own research when making a decision.

Čítaj viac

Bitcoin 'good to go up' after BTC price hits lowest since Terra crash

Bitcoin (BTC) recovered from a major dip at the May 26 Wall Street open as the market quickly exhausted buy support. BTC/USD 1-day candle chart (Bitstamp). Source: TradingViewBitcoin volume surges with more expectedData from Cointelegraph Markets Pro and TradingView showed BTC/USD dropping to $28,000 on Bitstamp — its lowest since May 12 and the Terra LUNA implosion. Progress had already accelerated to the downside on the day, this culminating in a liquidity grab that sent 24-hour BTC liquidations to $117 million.BTC liquidations chart. Source: CoinglassA subsequent bounce saw a recovery above $29,000, where Bitcoin traded at the time of writing.For Cointelegraph contributor Michaël van de Poppe, the swoop to fill bids was enough to ensure some fresh upside.Now we’re good to go up as all the liquidity is taken on the downside. Let’s go!— Michaël van de Poppe (@CryptoMichNL) May 26, 2022He added that his existing targets for BTC/USD — $32,800 and $35,000 — remained in force.Analyzing order book data, meanwhile, on-chain monitoring resource Material Indicators warned that given the thin liquidity remaining at lower levels, a future dip could encounter less resistance.”We are seeing A LOT of Bitcoin liquidity changing hands today. Everywhere a bid wall appears, it gets absorbed,” it told Twitter followers alongside a chart from major exchange Binance. “Currently there are no more huge bid walls and there is only ~$122M between $28k – $25k. Expecting to see more BTC move on chain.”BTC/USD order book chart (Binance). Source: Material Indicators/ TwitterFellow trading account Il Capo of Crypto, continuing a conservative outlook on near-term price action, predicted that the current bounce would be the “last bull trap” before a return to $25,000 based on order book performance.May 26 thus stood out from other trading days during the week, thanks to volume returning to BTC/USD markets. As Cointelegraph reported, its absence was becoming a source of concern for analysts.Bitcoin’s “most important chart” gives hope of recoveryCasting the net farther out, market commentators were keen to see signs of an overall change in trend on Bitcoin.Related: Bitcoin price may bottom at $15.5K if it retests this lifetime historical support levelFor popular analyst Root, those signs came from the behavior of long-term holder (LTHs) on the day.According to on-chain data, LTHs were finally slowing sales of BTC, as shown by their cost basis leveling out. Cost basis refers to the price at which LTH accounts purchased BTC on aggregate, and when it falls, it reflects declining LTH resolve.Commenting in Twitter thread, Root described the data as “perhaps the most important chart in BTC currently.” “For the past months, we’ve had LTH capitulation ⁠— shown by the rapidly falling LTH Cost Basis,” it wrote. “An uptick is a first sign that LTH’s might have stopped capitulating! Note: early signal, but finally a change in trend!”He added that those LTH entities selling were those who purchased BTC at the top and that the sales thus had a capitulatory quality to them.The views and opinions expressed here are solely those of the author and do not necessarily reflect the views of Cointelegraph.com. Every investment and trading move involves risk, you should conduct your own research when making a decision.

Čítaj viac

Získaj BONUS 8 € v Bitcoinoch

nakup bitcoin z karty

Registrácia Binance

Burza Binance

Aktuálne kurzy