Autor Cointelegraph By William Suberg

Bitcoin may hit $14K in 2022 but buying BTC now ‘as good as it gets:’ Analyst

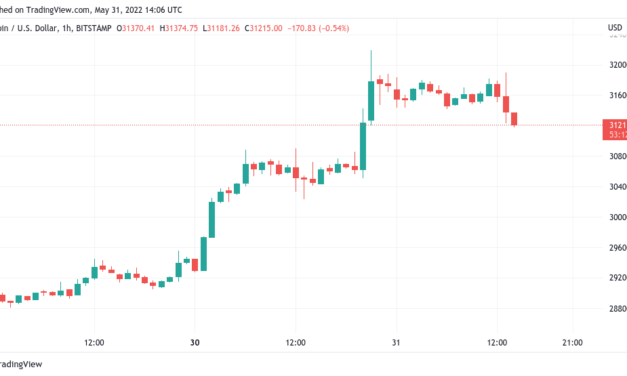
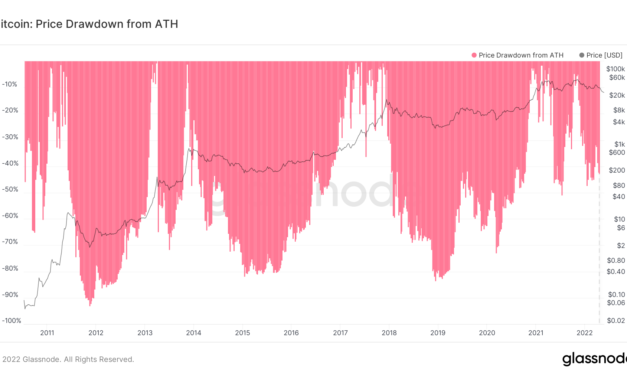
Bitcoin (BTC) faces a “cycle bottom” this year in which it could drop over 50% from current levels, research claims.In a Twitter thread on June 1, Venturefounder, a contributor at on-chain analytics platform CryptoQuant, forecasted 2022 as Bitcoin’s year to “capitulate.”Bitcoin now has “best 3-year ROI ever”Based on historical patterns involving Bitcoin’s halving cycles, this year should be the bearish black sheep of the current four-year cycle, Venturefounder wrote.Just like 2018 and its bear market, BTC/USD should find itself a macro floor at some point in 2022, and whcalculating previous dips from all-time highs, this could be anywhere between $14,000 and $21,000.“670 days until the next Bitcoin halving, we are on time to BTC performance comparing to past cycles,” one tweet explained:“In the next 670 days, BTC will capitulate in the next 6 months and hit cycle bottom ($14-21k), then chop around in $28-40k in most of 2023 and be at ~$40k again by next halving.”Such a prognosis, while not music to the ears of bulls, such a prognosis would not be without precedent. After hitting $3,100 in December 2018, Bitcoin managed a recovery to $13,800 seven months later before reversing downhill again to bottom at the March 2020 lows of $3,600.Even the 2019 local high was not enough to beat the record high of the time set in December 2017 — $20,000.That level could yet again become a feature of the spot price chart, Venturefounder believes. Those willing to ride the wave and invest — even now — will nonetheless be on the right side of history.“In other words, buying Bitcoin from this point to the next 6-12 months is as good as it gets. Probably the best 3-year % ROI ever,” he added:“We may not be at THE cycle bottom, but we are within the range of BTC cycle bottoms. This is the best you can do when timing the market cycles.”Bottom forecasts keep comingOthers have meanwhile already estimated the likely bottom range at $14,000 or nearby. Related: ‘Mega bullish signal’ or ‘real breakdown?’ 5 things to know in Bitcoin this weekThat price would represent a drop of around 80% from the current $69,000 all-time high, corresponding to the previous cycle’s low in percentage terms. Current levels around $31,000 are comparatively modest as a drawdown, data from on-chain analytics firm Glassnode shows.BTC/USD drawdowns from all-time highs chart. Source: GlassnodeLast month, fellow analyst Rekt Capital calculated a potential target of $15,500 once BTC/USD dips below its 200-week moving average.Sellers may face difficulties in driving the market so far down. MicroStrategy, which owns the largest BTC corporate treasury, has pledged to buy into any cascade toward the $20,000 mark.Arthur Hayes, former CEO of trading giant BitMEX, has also confirmed that he would be interested in BTC at $20,000.The views and opinions expressed here are solely those of the author and do not necessarily reflect the views of Cointelegraph.com. Every investment and trading move involves risk, you should conduct your own research when making a decision.

Čítaj viac

Bitcoin drops 1.5% on US market open amid warning miners may 'capitulate' in months

Bitcoin (BTC) fell in line with United States equities on May 31 as the return of Wall Street began with a whimper.BTC/USD 1-hour candle chart (Bitstamp). Source: TradingViewStocks take BTC price south againData from Cointelegraph Markets Pro and TradingView showed BTC/USD returning to near $31,000 at the start of trading after markets returned from a public holiday.The move reflected those of stocks indices, with the S&P 500 losing 1.1% at the open and the Nasdaq Composite Index trading down 1%.With volatility in evidence, preexisting suspicions over the staying power of Bitcoin’s recent rise remained vocal among social media commentators.I still think the rise in #BTC price is fake. It is clear that we do not know how high it will rise. But I have no doubt that it is pumped…We can see a very negative delta on the daily time frame as well as imbalances in favor of sellers in the aggressive seller zone… pic.twitter.com/kcvffm9IFj— M_Ernest_​₿ (@M_Ernest_) May 31, 2022″It is not unlikely that equities will give away some of their gains from last week,” analyst Jan Wuesterfeld wrote in the latest edition of his Bitcoin Market Intelligence newsletter on the day. “In my mind, if that happens, Bitcoin will probably also give away some of the gains made over the weekend and on Monday (reconnection in this case).”Others focused on uninspiring long-term price signals. Kevin Svenson, a contributing analyst to on-chain analytics platform CryptoQuant, highlighted Bitcoin’s 20-month exponential moving average (EMA) as a source of possible future contention.”In previous cycles, Bitcoin spent 6 – > 13 months below the 20m/EMA after breaking down below it. We currently just experienced our first month below the 20m/EMA,” he explained. “If human emotion repeats, then we will be below the 20m/EMA until (at least) November 2022 … and 13m’s is May 2023.”BTC/USD 1-month candle chart (Bitstamp) with 20EMA. Source: TradingView”No trend” of distribution by minersA potential silver lining for Bitcoin came in the form of miner behavior.Related: ‘Mega bullish signal’ or ‘real breakdown?’ 5 things to know in Bitcoin this weekAmid warnings that miners’ cost price is now above spot, creating the threat of capitulation similar to the bottom of the 2018 bear market, data suggested that panic had not yet set in.”Bitcoin miners are regarded as smart money and speculators in the BTC markets,” fellow CryptoQuant contributor and analyst Venturefounder wrote in a bulletin on the day. “As BTC price recovers, Bitcoin miners have not shown any trend of net distribution, in fact, the net accumulation trend which started in July 2021 continues.” Bitcoin miner BTC reserves annotated chart. Source: CryptoQuantAn accompanying chart showed that miners had increased their BTC reserves in the second half of May, in particular.The views and opinions expressed here are solely those of the author and do not necessarily reflect the views of Cointelegraph.com. Every investment and trading move involves risk, you should conduct your own research when making a decision.

Čítaj viac

Bitcoin faces ‘uphill battle’ despite BTC price gaining 35% from $23.8K bottom

Bitcoin (BTC) put in fresh gains overnight into May 31 as the monthly close looked set to seal losses of around 15%.BTC/USD 1-hour candle chart (Bitstamp). Source: TradingViewAsks stack up above $33,000Data from Cointelegraph Markets Pro and TradingView showed BTC/USD consolidating once more after a fresh burst took it to $32,200 on Bitstamp.The pair thus capped the second day of more bullish momentum, this nonetheless failing to impress analysts, who widely believed that the moves were untrustworthy.Those misgivings continued on the day amid discussions over whether the latest gains amounted to a “dead cat bounce.”Is this #BTC movement real? I think not. The rise has been sold…1- Inflow of >3,500 BTC in the spot market at its maximum (30.7k).2- Negative Delta with a daily green candle of 4.5%. (delta divergence).3- Also positive gamma. MM stops the market. pic.twitter.com/I1rEhjH0nq— M_Ernest_​₿ (@M_Ernest_) May 30, 2022“BTC is poised for a bigger move. Before you ape in, remember how crypto likes to squeeze shorts and trap longs,” on-chain analytics resource Material Indicators wrote in one of several tweets over the past 24 hours:“You can mitigate risk by waiting to confirm breakout or fakeout. FireCharts shows where liquidity rests in the order book. Monthly close Tues.”Order book data from major exchange Binance, meanwhile, showed a solid $61 million sell-wall appearing at $33,500 at the time of writing.BTC/USD order book data (Binance). Source: Material IndicatorsPopular Twitter account Il Capo of Crypto further continued a bearish stance while admitting that the bounce had run contrary to previous forecasts.Nice push from the bulls yesterday. This week I’ve been mostly wrong because I thought we were going down and didn’t expect this bounce. However, this move up is showing the same signs as the move that deviated above 45k-46k. Bearish scenario still in play. https://t.co/ktv0jbC6aY— il Capo Of Crypto (@CryptoCapo_) May 31, 2022

Fellow account Venturefounder added that BTC/USD would need to reclaim its 200-day moving average near $43,000 to “resume a new bull market,” calling such a target an “uphill battle.”Whales bide their timeAmid unimpressive volumes accompanying the bounce, meanwhile, additional concerns focused on whales.Related: ‘Mega bullish signal’ or ‘real breakdown?’ 5 things to know in Bitcoin this weekAs noted by Caue Oliveira, analyst at Brazilian analytics outfit BlockTrends, Bitcoin’s largest entities have yet to show faith in recent lows being a macro floor. “Whales/institutions not yet deployed all their firepower on the market!” he summarized in a Twitter thread:“These large entities continue to reduce activity, exposing their caution with the global scenario. A close look at their moves can provide the true signal of a real reversal.”An accompanying chart showed a steep drop-off in whale movements in May.Bitcoin whale wallet activity chart. Source: Caue Oliveira/ TwitterContinuing, Oliveira said that activity from institutional platform Coinbase Pro likewise suggested that most investors were waiting on the sidelines.“At the moment, I don’t see any evidence of a real ‘buy the dip’ by these participants,” he added.Whale-focused monitoring resource Whalemap further contended that without a piercing of the 200-week moving average, Bitcoin had not yet put in a true macro bottom.What are the chances now? pic.twitter.com/WoSDMip8mU— whalemap (@whale_map) May 30, 2022

That moving average was at around $22,200 as of May 31.The views and opinions expressed here are solely those of the author and do not necessarily reflect the views of Cointelegraph.com. Every investment and trading move involves risk, you should conduct your own research when making a decision.

Čítaj viac

Bitcoin ‘ready’ for $32.8K after consolidation as BTC price gains 6.3%

Bitcoin (BTC) stayed higher on May 30 as early week gains saw BTC/USD retain $30,500.BTC/USD 1-day candle chart (Bitstamp). Source: TradingView$32,000, $35,000 flagged as lines in the sandData from Cointelegraph Markets Pro and TradingView showed the largest cryptocurrency consolidating near $30,600 at the time of writing after hitting highs of $30,900 on Bistamp.Its best performance since May 16, the return to relative strength was welcomed by analysts, some of whom began to discuss the possibility of a range breakout.“Finally, Bitcoin is making the run upwards,” Cointelegraph contributor Michaël van de Poppe told Twitter followers. “Some more consolidation here and we’re ready to break further upwards in which $32.8K and $35K are the resistances. The moment that the market gets to $35K, that’s the point where I’m expecting everyone to turn bullish.”Fellow trader and analyst Rekt Capital agreed, requiring at least $32,000 to break and hold for a change of trend.#BTC is enjoying a rebound from the very bottom of the Macro Range Low, after holding it as support for the past few weeksThat said $BTC would need to break orange ~$32K resistance to enable a rally to ~$35KFor the moment, not too meaningful a move, macro-wise#Bitcoin pic.twitter.com/tL7OpKOybm— Rekt Capital (@rektcapital) May 30, 2022To the downside, meanwhile, van de Poppe highlighted the area near the May 29 weekly close as crucial support to now hold.That weekly close had remained disappointing, marking the ninth red candle in a row for BTC/USD.Adopting a conservative perspective, trading account TXMC Trades was unsure of Bitcoin’s ability to crack the range, while United States markets were off for the Memorial Day holiday.Still just range bound despite the quickness of the pump. LTF double top at resistance. Will #BTC break out of a well defined consolidation on a market holiday in the US without a catalyst? My base case is no, but I’ve been wrong before. pic.twitter.com/0gjs6GXizc— TXMC (@TXMCtrades) May 30, 2022

No bright future for stocksAhead of markets returning on May 31, doubts similarly lingered over the true momentum behind their newfound strength, which showed itself last week.Related: ‘Mega bullish signal’ or ‘real breakdown?’ 5 things to know in Bitcoin this weekBitcoin had been initially slow to react, but its copycat behavior lent weight to the idea that higher levels across risk assets could ultimately prove to be a fakeout.Commenting on the fortunes of the S&P 500, trader and analyst Pentoshi admitted that he did not see much more upside to come.“I think we are nearing the upside being capped for SPX in red box after we got that beautiful swing low on the weekly,” he said alongside a chart showing targets.  “Very hesitant to think this can sustain momentum (only gives Fed more reason to tighten).”The U.S. dollar index (DXY) retreated for another day, breaking below 101.5 for the first time since late April.U.S. dollar index (DXY) 1-day candle chart. Source: TradingViewThe views and opinions expressed here are solely those of the author and do not necessarily reflect the views of Cointelegraph.com. Every investment and trading move involves risk, you should conduct your own research when making a decision.

Čítaj viac

‘Mega bullish signal’ or ‘real breakdown?’ 5 things to know in Bitcoin this week

Bitcoin (BTC) is bouncing back this week as a sudden surge challenges weekly highs.In what should provide some desperately needed confidence to bulls, BTC/USD is back at weekly highs on May 30, gaining several percent overnight.In contrast to recent weekly closes, the May 29 candle managed to limit the downside and reverse course immediately as the new week began.Nonetheless, Bitcoin has now sealed nine red weekly candles in a row, something never seen before in its history.Just how bearish is the largest cryptocurrency going into June? The macroenvironment remains troubled, while retail interest is nowhere to be seen and calls for a deeper capitulation remain. That said, should it continue its latest strength, Bitcoin still stands a chance of breaking out of its current trading corridor. Cointelegraph takes a look at the factors primed to move the market in the coming days. Can Bitcoin avoid 10 weeks of red?Thanks to an unexpected but welcome U-turn overnight into May 30, Bitcoin is breaking with tradition this week.Asian trading provided the backdrop to some solid gains, with both Japan’s Nikkei and Hong Kong’s Hang Seng index up over 2% at the time of writing. The trigger came from news that China is planning to relax some of its latest COVID-19 restrictions and open up the economy.Bitcoin, nonetheless, outperformed equities prior to European trading getting underway.After an initial red hourly candle following the weekly close, BTC/USD abruptly rose from $29,300 to current levels nearing $30,700, data from Cointelegraph Markets Pro and TradingView shows.BTC/USD 1-week candle chart (Bitstamp). Source: TradingViewWhile caution remains thanks to the weekly close still being red, Bitcoin could end its nine-week losing streak this week as long as next week’s closing price is at least $29,500.For some, the overnight action alone has been enough to get noticeably more positive on the near-term outlook.“Bitcoin on the verge of a mega bullish signal,” Jordan Lindsey, founder of JCL Capital,told Twitter followers:“IMO not a time to be greedy looking for bottom ticks.” Trader Crypto Tony noted that Bitcoin is still in a familiar trading range and should clear some key levels before being considered to have a firm trajectory. For him, this is $31,000, now not so far away.Good morning legends Nice relief waves to see this morning on #Altcoins .. Remember #Bitcoin is still in a range, so we need to clear $31,000 for this relief to continue Updates to come — Crypto Tony (@CryptoTony__) May 30, 2022Others focused on the idea of current gains being just another relief bounce and that Bitcoin should return lower afterward.This is why you should be able to change your bias as new data comes in That really was a fake breakdown and now we see the real one #BTC pic.twitter.com/7AXOEffeT0— CryptoBullet (@CryptoBullet1) May 30, 2022

Popular trading account TMV Crypto, meanwhile, flagged the overnight lows as key support to hold going forward.“Not sure if we should be very bullish here on BTC + ETH,” fellow trader and analyst Crypto Ed added in a Twitter thread posted on May 30.He pointed to thin weekend volumes supporting the bounce, suggesting that higher levels did not have the bid interest required to cement themselves as new support yet.“Saw some on my feed going short, which was understandable when seeing the weakness in the charts,” he continued:“Once again a great example to be cautious over the weekend. Too often you get played on thin order books hence I prefer to not open new positions over the weekend.”A CME futures gap left from May 27 at $29,000, meanwhile, provides a further bearish target.CME Bitcoin futures 1-hour candle chart. Source: TradingViewAnalyst: Stocks rebound is “bear market rally”With United States markets closed for a public holiday on May 30, it will be up to Europe and Asia to dictate the day’s mood.And, with the World Economic Forum behind them, crypto hodlers may be able to breathe a small sigh of relief going into the new month, prior to another U.S. Federal Reserve meeting in mid-June.Asian stocks’ return to form after eight weeks of losses formed the major macro focus on the day. After failing to take advantage of a similar rally in the U.S. last week, Bitcoin now appears to be capitalizing on the mood, which commentators nonetheless warn is likely not an indicator of an overall trend reversal.Monetary tightening from the Fed and other central banks has not only got stock traders down but has ignited talk of a major recession as the price economies pay. “We are in the middle of a bear market rally,” Mahjabeen Zaman, head of investment specialists at Citigroup Australia, told Bloomberg:“I think the market is going to be trading rangebound trying to figure out how soon is that recession coming or how quickly is inflation going down.”The tightening is due to become real this week. June 1 is thought to be when the Fed begins reducing its balance sheet, currently at a record high of $8.9 trillion.The European Central Bank (ECB) will halt its asset purchases later in the year, it revealed last week.May 31 will further see consumer price index (CPI) data released for the Eurozone, ahead of similar data for the U.S. on June 10.“Stock Investors watching for signs of stability,” markets commentator Holger Zschaepitz wrote on May 28 alongside the CBOE Volatility Index:“Wall St’s fear gauge, investors’ sentiment & bond spreads are tracked for clues on where the market might go next. But only one of the 5 sentiment indicators suggests that the worst is over in the markets.”CBOE Volatility Index. Source: Holger Zschaepitz/ TwitterDollar strength tags one-month lowsComing to test support levels throughout the past week has been the strength of the U.S. dollar.After surging to levels not seen since December 2002, the U.S. dollar index (DXY) is finally coming back down to Earth and even challenging its year uptrend.This may still act as a silver lining for risk assets should the trend continue, as inverse correlation has worked in Bitcoin’s favor in particular in the past.“This could just be the start of the bull run of 2022!” an emboldened Crypto Rover argued, uploading a comparative chart showing the Bitcoin-DXY inverse correlation and how it played out in past years.Bitcoin vs. DXY annotated chart. Source: Crypto Rover/ TwitterCrypto Ed, however, is not convinced that the good times will be back, courtesy of ongoing dollar weakness.DXY: bounced from my green box, but is was a weak bounce. Rejected at S/R and going down again. But I see a falling wedge here, don’t think this will go much deeper. pic.twitter.com/1ZEtiDbX1v— Ed_NL (@Crypto_Ed_NL) May 30, 2022

“DXY is printing a reversal pattern, a falling wedge. Another reason for not being too enthusiastic for BTC,” a further tweet added.Nonetheless, at 101.49, DXY was at its lowest since April 25.U.S. dollar index (DXY) 1-day candle chart. Source: TradingViewBitcoin nearing a “cyclic bottom”Not everyone is bearish among Bitcoin analysts, and one of them, CryptoQuant CEO Ki Young Ju, has the data to prove why.Uploading the latest readings from Bitcoin’s realized cap distribution, Ki argued that, in fact, BTC/USD is currently at a similar stage to March 2020.Realized cap reflects the price at which each Bitcoin last moved, and can be broken down into age bands. These, in turn, show the proportion of the BTC supply that makes up its realized cap which last moved a certain length of time ago. Right now, 62% of the realized cap involves unspent transaction outputs (UTXOs) from six months ago or longer.For Ki, this signifies floor territory for BTC price, as has been the case historically — and most significantly during the March 2020 COVID-19 crash.“$BTC is getting close to the cyclic bottom,” he summarized:“Now UTXOs over 6 months old take 62% of the realized cap. In the 2020 March great sell-off, this indicator reached 62% as well.”Bitcoin realized cap UTXO bands vs. BTC/USD chart. Source: Ki Young Ju/ TwitterCryptoQuant previously reported on UTXO data as it relates to the size of Bitcoin investor holdings, but drew more conservative conclusions. Last week, it appeared that the largest Bitcoin whales were still distributing their holdings on-chain, while smaller whales could likely be propping up the market and preventing a March 2020-style cascade.Sentiment hints at “long term buying opportunity”It takes a lot of bullish price action to shift sentiment into the green in the current environment.Related: Top 5 cryptocurrencies to watch this week: BTC, ETH, XTZ, KCS, AAVEThis goes for both Bitcoin and crypto more widely, as investors have endured over six months of what has been practically unchecked downside.This remains the case this week — despite the overnight move up, sentiment remains firmly in the “extreme fear” zone across Bitcoin and altcoins.The Crypto Fear & Greed Index is at just 10/100 as of May 30, a score which has accompanied generational price bottoms in previous years.Crypto Fear & Greed Index (screenshot). Source: Alternative.meMay 2022 has been a particularly harsh period for sentiment, with Fear & Greed hitting just 8/100 earlier in the month — a level rarely seen and which last appeared in March 2020.“Fear & Greed Index back down to 10 today,” Philip Swift, creator of on-chain analytics platform LookIntoBitcoin, responded:“We have spent three weeks in Extreme Fear now with just sideways price action. Potential bottom forming?”Commentator and analyst Scott Melker, known as the Wolf of All Streets, added that regardless of what might come next, sentiment revealed a “long term buying opportunity.”“People are still becoming more fearful,” part of a Twitter post read.The views and opinions expressed here are solely those of the author and do not necessarily reflect the views of Cointelegraph.com. Every investment and trading move involves risk, you should conduct your own research when making a decision.

Čítaj viac

Získaj BONUS 8 € v Bitcoinoch

nakup bitcoin z karty

Registrácia Binance

Burza Binance

Aktuálne kurzy