Autor Cointelegraph By William Suberg

Coinbase balance drops by 30K BTC as Bitcoin price nurses 6% losses

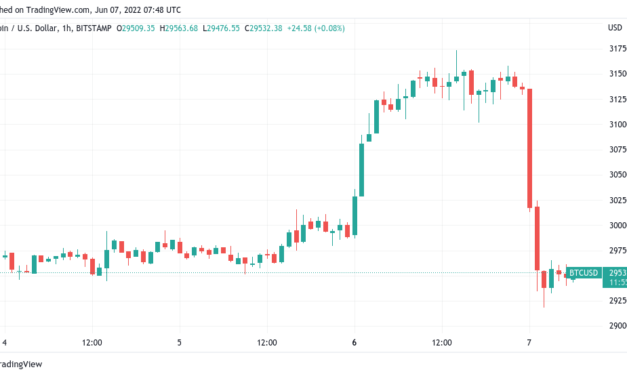
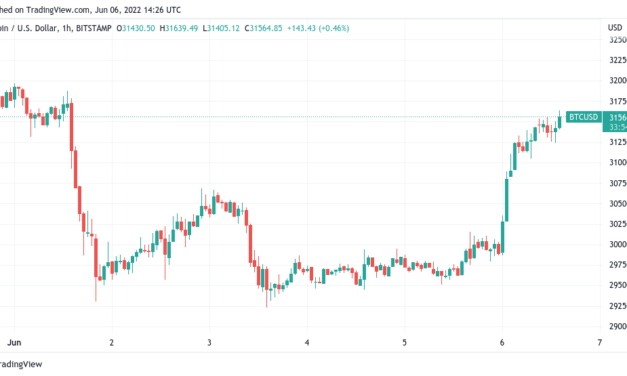
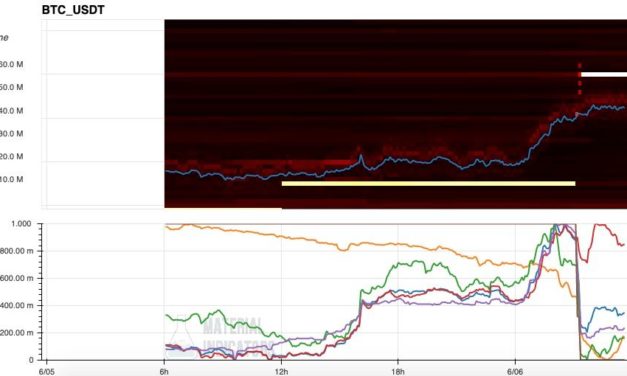
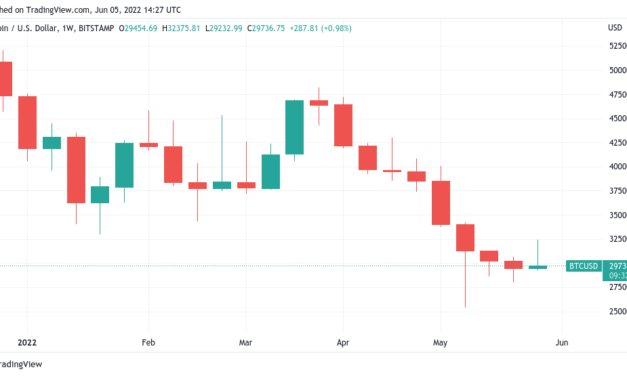
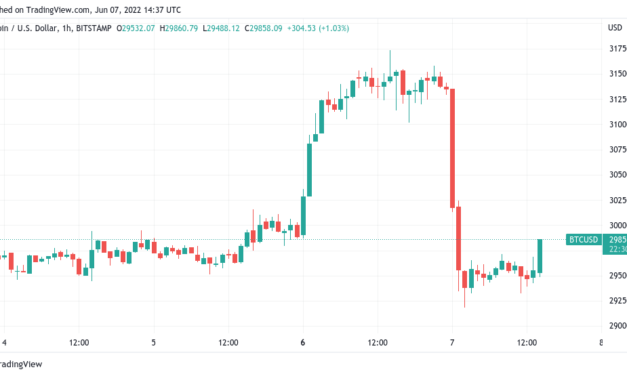
Bitcoin (BTC) held steady at the June 7 Wall Street open after a night of losses cost bulls heavily.BTC/USD 1-hour candle chart (Bitstamp). Source: TradingViewCoinbase sees conspicuous outflowsData from Cointelegraph Markets Pro and TradingView followed BTC/USD as it ranged near $30,000, still down 6% versus its prior highs.After underperforming versus United States equities on June 6, the pair nonetheless managed to avoid falling further in step with stocks. At the time of writing, the S&P 500 was down 0.6% from the open, with the Nasdaq Composite Index 0.5% lower.Analyzing order book data, on-chain analytics resource Material Indicators noted that a wall of bids from a whale “spoofing” the market in recent days had finally dissipated. Earlier, that entity had posted a support line at $29,000.“Looks like the whale we’ve been watching spoof for over a week finally unloaded some BTC,” it revealed, alongside a chart of the Binance order book. “The $60M in bids we saw pop up just above $29K was broken into smaller blocks, moved into the active trading range and appears to have been filled.”BTC/USD order book data (Binance). Source: Material Indicators/ TwitterAnother intriguing event related to buying came from Coinbase Pro, the professional trading offshoot of major U.S. exchange Coinbase, which saw what appeared to be tens of thousands of BTC in outflows over the past 24 hours.While potentially an internal transaction, an institutional client could now be in possession of around $30,000 BTC, according to data from the on-chain analytics platform Coinglass.Coinbase’s BTC balance thus returned to its lowest levels since May 16.Coinbase BTC balance chart. Source: CoinglassBitcoin dominance hits 8-month highsAmid a relative lack of volatility, attention focused on Bitcoin dominance over struggling altcoins.Related: Bitfinex Bitcoin longs hit a record-high, but does that mean BTC has bottomed?#BTC Dominance is breaking out from a macro WedgeBest case scenario for Altcoins (blue path):• Small relief – > strong decline – > future strong reliefWorst case scenario for Altcoins (orange path):• Strong valuation decline – > small relief – > more downside$BTC #Bitcoin pic.twitter.com/dK5MjfqSSk— Rekt Capital (@rektcapital) June 7, 2022That dominance stood at 46.3% of the overall crypto market cap on June 7, Bitcoin’s highest since October 2021.“Once we break out of the range high, that is when we will see capitulation begin on Altcoins and i will be looking to deploy capital on signs of a bottoming formation and accumulation,” trading account Crypto Tony told Twitter followers.The views and opinions expressed here are solely those of the author and do not necessarily reflect the views of Cointelegraph.com. Every investment and trading move involves risk, you should conduct your own research when making a decision.

Čítaj viac

Bitcoin 'Bart Simpson' returns as BTC price dives 7% in hours

Bitcoin (BTC) firmly recommitted to its trading range on June 7 after a fresh move higher was met with a swift sell-off.BTC/USD 1-hour candle chart (Bitstamp). Source: TradingView”Some of the best chop we’ve seen”Data from Cointelegraph Markets Pro and TradingView showed BTC/USD rejecting decisively at resistance it last encountered on June 1.The pair had delivered daily gains in excess of 6%, but the approach to $32,000 changed the mood and Bitcoin gave back almost $2,500 in a matter of hours.A classic “Bart Simpson” structure thus formed on hourly timeframes as frustrated traders came to terms with the existing paradigm remaining unchallenged.“Standard price action again on Bitcoin in which all the lows are swept,” Cointelegraph contributor Michaël van de Poppe wrote in a Twitter update. “If we hold around $29K, still presumably enough reason to go for a slight run. (And $29K area is still CME gap territory).”CME Bitcoin futures 4-hour candle chart with unfilled gap highlighted. Source: TradingViewIn addition to the CME futures gap providing a potential target at levels seen before the gains, on-chain analytics resource Material Indicators noted significant buyinterest already lined up at those levels. #FireCharts 2.0 (beta) shows $60M in #BTC bid liquidity popping up at $29k. Whether it gets defended, filled or spoofed determines the next trade. #crypto #tradingstrategy https://t.co/iCsO8yQgDB pic.twitter.com/Du6uXRc9U1— Material Indicators (@MI_Algos) June 7, 2022Should that not hold, targets focused on the area around $28,000 next.Not much of a reaction, melted through it, so this level is now likely to act as resistance. At this point I think we are probs headed to the lows with the red “x”. May see some relief in between. Again, all this sideways chop/ranging is part of the bottoming process imo. $BTC https://t.co/vx7qpIaUjf pic.twitter.com/x3pwqEjFeN— CrediBULL Crypto (@CredibleCrypto) June 7, 2022

“I will simply be looking for short opportunities in this range”, fellow trading account Crypto Tony continued, nodding to the overall downtrend continuing.“Either we lose the range low and will short a retest, or if we retest the EQ of the range and reject i will look for a short position. Flat until one of these triggers plays out.”One market participant not at all surprised by the short-timeframe action was Filbfilb, co-founder of trading platform Decentrader.“Some of the best chop we’ve seen tbh, high quality stuff,” he joked.“I’d say it’s always the same, people desperate not to miss the ‘bottom’ but this one is particularly funny how it’s instantly reversing. Trade chasers getting absolutely ruined.”Long traders battling volatility sparked 24-hour liquidations totalling $60 million for BTC and another $158 million on altcoins, data from analytics platform Coinglass confirmed.Crypto liquidations chart. Source: CoinglassStocks correlation blurredBitcoin altcoins thus severely underperformed compared to notionally correlated United States equities.Related: BTC price snaps its longest losing streak in history — 5 things to know in Bitcoin this weekBoth the S&P 500 and the Nasdaq Composite Index finished the June 6 trading session above the open, putting their relationship with crypto in question.Yassine Elmandjra, a crypto asset analyst at ARK Invest, nonetheless noted that Bitcoin’s overall correlation to the S&P had reached new all-time highs on a rolling 30-day basis.Bitcoin’s correlation with the S&P 500 reaches an all-time high. pic.twitter.com/jwT5KQWeIQ— Yassine Elmandjra (@yassineARK) June 3, 2022

Discussing BTC price action further, he argued that “major” trendlines remained intact on BTC/USD, even given May’s dip to $23,800. This, as Cointelegraph reported, was still ripe for a retest in the eyes of many.The views and opinions expressed here are solely those of the author and do not necessarily reflect the views of Cointelegraph.com. Every investment and trading move involves risk, you should conduct your own research when making a decision.

Čítaj viac

BTC price approaches $32K as analyst warns of 'boring' summer for Bitcoin

Bitcoin (BTC) retained new higher levels at the June 6 Wall Street open after BTC/USD snapped a nine-week losing streak.BTC/USD 1-hour candle chart (Bitstamp). Source: TradingViewStocks could take BTC as high as $37,000Data from Cointelegraph Markets Pro and TradingView followed the largest cryptocurrency as it circled $31,500 on the back of 6% daily gains.The start of Wall Street trading provided further support to bulls as United States equities headed higher. The S&P 500 traded up 1.4% at the time of writing, while the Nasdaq Composite gained close to 2%.For popular social media analyst Wolf, Bitcoin’s correlation to stocks could see further upside should the S&P 500 flip its 21-month exponential moving average (EMA) to support. “$SPX sitting on the monthly 21EMA, should it hold, we will see $BTC recover to the same band now at $36–$37K,” he summarized to Twitter followers on the day.A further post described BTC as “lagging” behind the S&P but apt to “recover pretty soon” in the event of the former holding monthly support.Cointelegraph contributor Michaël van de Poppe was also more optimistic after $30,000 held overnight on BTC/USD.”A nice move of Bitcoin overnight, as we held the area around $29.7K and continued to run,” he explained. “Resistance zone now, wouldn’t be longing around here (might even sweep above $31.8K to take the liquidity). Looking at around $30.5K for a potential new long and then targeting $32.8K.”Fellow trader Pentoshi, nonetheless retained a conservative outlook, forecasting a reversal for the S&P, which could well deflate the latest momentum in crypto markets.#SPX nailed from top down and back up from 3840Think they want to take out 4300’s before a reversal back down. Bear market rallies are brutal frens. They go higher then people think pic.twitter.com/RJVUjugtGo— Pentoshi (@Pentosh1) June 6, 2022On longer timeframes, the mood was thus subdued in the face of ongoing monetary tightening by central banks and rampant inflation.For commentator Bob Loukas, the summer looked to be uninspiring for hodlers.”Probably going to be a boring summer in Crypto. The heavy selling is done, now it’s the doldrums period where only smart money accumulates,” he acknowledged. “Once all the weak hands have turned over, higher prices will be needed, and the new cycle can begin. Still targeting late in year.”Analyst on altcoins: “Worse can get much worse” Some major altcoins, meanwhile, took the opportunity to capitalize on Bitcoin’s gains.Related: BTC price snaps its longest losing streak in history — 5 things to know in Bitcoin this weekAmong them was Ether (ETH), the largest altcoin by market cap, which saw daily gains in excess of 7% to pass $1,900.”Good momentum on $ETH here,” Van de Poppe commented in a separate update.”Approaching [the] first point of resistance, but given the HL and the current recovery on $BTC, I think we’re up for a few weeks of green in which we’ll be looking for tests around $2,300–$2,500 on $ETH too.”ETH/USD 1-hour candle chart (Binance). Source: TradingViewElsewhere in the top ten cryptocurrencies by market cap, Cardano (ADA) and Solana (SOL) both jumped an excess of 10% on the day. Out of the top fifty tokens, only one, Elrond (EGLD), traded in the red.Loukas, nonetheless, noted that Bitcoin’s market cap was apt to cost altcoins big in the coming months. “With BTC maybe 3–6 months from $USD bear lows, watch out on ALT positions. Worse can get much worse,” part of a tweet warned.The views and opinions expressed here are solely those of the author and do not necessarily reflect the views of Cointelegraph.com. Every investment and trading move involves risk, you should conduct your own research when making a decision.

Čítaj viac

BTC price snaps its longest losing streak in history — 5 things to know in Bitcoin this week

Bitcoin (BTC) starts a new week with some fresh hope for hodlers after halting what has been the longest weekly downtrend in its history.After battling for support throughout the weekend, BTC/USD ultimately found its footing to close out the week at $29,900 — $450 higher than last Sunday.The bullish momentum did not stop there, with the pair climbing through the night into June 6 to reach multi-day highs.The price action provides some long-awaited relief to bulls, but Bitcoin is far from out of the woods at the start of what promises to be an interesting trading week. The culmination will likely be United States inflation data, this itself a yardstick for the macroeconomic forces at world globally. As time goes on, the impact of anti-COVID policies, geopolitical tensions and supply shortages is becoming all the more apparent.Risk assets remain an unlikely bet for many, as central bank monetary tightening is seen to be apt to pressure stocks and crypto alike going forward.Bitcoin’s network fundamentals, meanwhile, continue to adapt to the surrounding reality and its impact on network participants.Cointelegraph takes a look at five factors to bear in mind when charting where BTC price action may be headed in the coming days.Tenth time’s the charm for BTC weeklyIt was a long time coming, but Bitcoin has finally closed out a “green” week on the weekly chart. BTC/USD had spent a record nine weeks making progressively lower weekly closes — a trend which began in late March and ended up being the longest ever in its history. On June 5, however, bears had no chance, pushing the pair to $29,900 before the new week began, this still being approximately $450 higher than the previous week’s closing price. That event sparked several hours of upside, with local highs totaling $31,327 on Bitstamp at the time of writing — Bitcoin’s best performance since June 1.On the Weekly candle close, Trend Precognition printed a Long signal on the #Bitcoin Weekly chart. Looking for a HH on the Weekly to confirm a breakout. If #BTC rallies, key MA’s should act as technical resistance. https://t.co/NPVL3D27C5 pic.twitter.com/GxwT5zI3gC— Material Indicators (@MI_Algos) June 6, 2022While some celebrated Bitcoin’s newfound strength, others remained firmly cool on the prospects of a more substantial rally. Cointelegraph contributor Michaël van de Poppe eyed the open CME futures gap from the weekend, this providing a lure for a return to $29,000.“Still expecting this to be happening on Bitcoin,” he told Twitter followers. “A drop towards the CME Gap at $29K would make a lot of sense before a short reversal towards $31.5K.”A look at order book data reinforces the friction bulls are likely to face in the event of a continued breakout. At the time of writing, the area around $32,000 had more than $60 million in sell-side liquidity lined up on Binance alone.BTC/USD order book data chart (Binance). Source: Material IndicatorsFor Il Capo of Crypto, a Twitter analytics account well known for its sobering takes on upcoming BTC price action, there was likewise little to feel confident about.In addition to this:-Price is basically ranging between 29k-31k. That’s below the main pivot (S/R flip)-Every move up is corrective and data shows that bulls are being trapped.We might see a scam pump to $30.7k-31.5k, but the bearish main targets are still very likely. https://t.co/UnmENNNK6z— il Capo Of Crypto (@CryptoCapo_) June 5, 2022

Nonetheless, the market was not without its optimism.“Having a plan is more important than guessing the correct direction,” popular Twitter account IncomeSharks argued. “I think we drop then go up, so I’ll be longing if this happens. If stocks open up green we could rally and I’ll pivot to alts to ride them up. TP level is at $34,000 for now.”Countdown to U.S. CPI readoU.S. inflation is at its highest since the early 1980s, but will it continue?The market will find out this week as June 10 sees the release of Consumer Price Index (CPI) data for May. One of the benchmarks for gauging how inflation is progressing, CPI prints have traditionally been accompanied by market volatility both within crypto and beyond.The question for many is how much higher it can go as the aftermath of the Russia-Ukraine conflict and its impact on global trade and supply chains continues to play out. In the U.S., the Federal Reserve’s interest rate hikes are also under scrutiny as a result of prices surging.The end of the “easy money” era is a difficult one for stocks and correlated crypto assets more generally, and that pain trend is expected not to end any time soon, regardless of inflation performance.“Liquidity is going out of the market and what that means is it will have an impact on the equity markets,” Charu Chanana, market strategist at Saxo Capital Markets, told Bloomberg. “We do expect that the drawdown in the equity markets still has some room to go.”Chanana was speaking as Asian markets rallied in early week’s trading, led by China loosening its latest round of COVID-19 lockdown measures.The Shanghai Composite Index was up 1.1% at the time of writing, while Hong Kong’s Hang Seng traded up more than 1.5%.Beyond the intraday data, however, the mood when it comes to macro versus crypto is very much one of cold feet.For trading firm QCP Capital, the latest contraction in U.S. M2 money supply — only its third in around twenty years — is another reason to not take any chances.“This contraction in M2 has been a result of Fed hikes and forward guidance which drove a surge in reverse repos (RRP) to all-time record levels. Banks and money market funds withdrew money from the financial system in order to park it with the Fed to take advantage of high overnight interest rates,” it wrote in the latest edition of its Crypto Circular research series.“This draining of liquidity will only be exacerbated by the upcoming QT balance sheet unwind as well, beginning 1 June. We expect these factors to weigh on crypto prices.”U.S. inflation data chart. Source: St. Louis FedMiner capitulation “very close”Despite weeks of lower prices endangering their cost basis, Bitcoin miners have so far held off from significant distribution of coins.This may soon change, new analysis argues, sparking what has historically accompanied generational BTC price bottoms.In a tweet on June 6, Charles Edwards, founder of crypto asset manager Capriole, highlighted a classic bottom signal in Bitcoin’s hash ribbons metric. Hash ribbons measures miner profitability and has been historically accurate in correlating with price phases. Currently, the “capitulation” phase similar to March 2020 is underway, he explained, but hodlers should do anything but sell as a result.“Hash Ribbon miner capitulation is very close. Bitcoin mining profit margins are getting squeezed,” Edwards commented. “Reminder: this is not a sell signal. The end of a capitulation period has historically set up some of the best long-term buys for Bitcoin.”Bitcoin hash ribbons chart. Source: Charles Edwards/ TwitterPreviously, Cointelegraph reported on miners’ ongoing challenges, which now includes a ban the practice by the State of New York this month.Fundamentals echo miner calmFluctuations in miner participation will have a palpable effect on Bitcoin’s hash rate and network difficulty. So far, hash rate has remained stable above 200 exahashes per second (EH/s), according to estimates, indicating that miners for the most part remain active and have not decreased activity over cost concerns.Data covering Bitcoin’s network difficulty likewise presents a calm short-term picture. At its upcoming automated readjustment this week, difficulty will decrease by less than 1%, again reflecting a relative lack of upheaval in the mining sphere.By contrast, the previous readjustment two weeks ago saw a 4.3% reduction, marking the biggest reversal since July 2021.Bitcoin hash rate, difficulty estimates chart. Source: BTC.comBeyond the short term, a sense of optimism prevails among some of Bitcoin’s best-known commentators.“As we see in the growth of its hash rate, today bitcoin is roughly 50% cheaper yet 20% stronger than a year ago,” podcast host Robert Breedlove noted in part of a Twitter debate on June 5, arguing that this showed “mobilization” of entrepreneurs interested in fueling Bitcoin’s growth.Megawhales show “promising sign”In terms of putting their money where their mouth is, Bitcoin’s biggest investors could be showing the way this month.Related: Top 5 cryptocurrencies to watch this week: BTC, ADA, XLM, XMR, MANAAs noted by sentiment monitoring firm Santiment, entities controlling 1,000 BTC or more now own more of the BTC supply than at any point in the past year. “The mega whale addresses of Bitcoin, comprised partially of exchange addresses, own their highest supply of $BTC in a year,” Santiment summarized on June 6. “We often analyze the 100 to 10k $BTC addresses for alpha, but accumulation from this high tier can still be a promising sign.”Bitcoin megawhale accumulation trends chart. Source: Santiment/ TwitterData from on-chain analytics firm CryptoQuant meanwhile allays fears that users are sending BTC en masse to exchanges for sale. The overall trend in decreasing exchange reserves continues, and is at levels last seen in October 2018.Bitcoin exchange reserves vs. BTC/USD chart. Source: CryptoQuantThe views and opinions expressed here are solely those of the author and do not necessarily reflect the views of Cointelegraph.com. Every investment and trading move involves risk, you should conduct your own research when making a decision.

Čítaj viac

Bitcoin price needs to close above $29,450 for its first green weekly candle since March

Bitcoin (BTC) kept traders guessing into the June 5 weekly close as BTC price action closely mimicked last weekend.BTC/USD 1-week candle chart (Bitstamp). Source: TradingViewBTC price traders $300 in the greeData from Cointelegraph Markets Pro and TradingView showed BTC/USD circling its May 30 opening level at the time of writing, just $300 higher than seven days ago.With hours to go before the weekly candle closed, the pair thus retained the threat of sealing yet another lower low. This would take Bitcoin to a new record in terms of consecutive “red” weeks.Discussing the potential outcomes, traders had mixed opinions.Very hard to tell, again all about daily trend and the recent highs put @ 32k.Gaps above big enough to be interesting to play even > 32.A close like this for the weekly would be pretty… Indecisive.For example if you see it that way.. story isn’t the same 🙂 pic.twitter.com/pYRxvEArjJ— Pierre (@pierre_crypt0) June 4, 2022″Looks like BTC will likely get a Weekly close above $28.5k, which would imply further ranging PA for the upcoming week,” popular Twitter account Crypto Santa added in comments on the day. As Cointelegraph reported, BTC/USD continued to trade in a tight range throughout the week, this in place since the recovery from May’s $23,800 lows.Crypto Santa noted that United States inflation data was due in the coming days, this taking the form of the consumer price index (CPI) readout for May which could spark volatility should inflation be shown to be running above already high expectations.”The jury is still out in terms of the inflationary trajectory,” Jeffrey Rosenberg, senior portfolio manager for systematic multi-strategy at asset management giant BlackRock, told Bloomberg. “You can’t really get the Fed out of the business of focusing on the number one priority — of getting inflation down — until you really start to see that definitively show up. Until that happens, it’s going to be a very tough time.”April’s CPI print came in at 8.3%, compounding inflation already at levels not seen since the early 1980s.Bitfinex longs raise fear of “liquidation disaster”While many predicted that Bitcoin would ultimately revisit the May lows, one cohort of traders stayed conspicuously bullish.Related: Bitcoin long-term hodlers begin ‘distribution’ which preceded BTC price bottomsOn major exchange Bitfinex, long bets on BTC kept climbing over the weekend, reaching new record highs and causing confusion from analysts.The trend accelerated markedly after the trip to $23,800, leading to concerns that a liquidation event could add to market fragility should BTC/USD reverse downhill.”This is either gonna result in a fantastic pump … or a liquidation disaster,” part of a reactionary tweet by commentator Kevin Svenson read on June 2.The views and opinions expressed here are solely those of the author and do not necessarily reflect the views of Cointelegraph.com. Every investment and trading move involves risk, you should conduct your own research when making a decision.

Čítaj viac

Získaj BONUS 8 € v Bitcoinoch

nakup bitcoin z karty

Registrácia Binance

Burza Binance

Aktuálne kurzy