Autor Cointelegraph By William Suberg

Biggest Bitcoin exchange inflows since 2018 put potential $20K bottom at risk

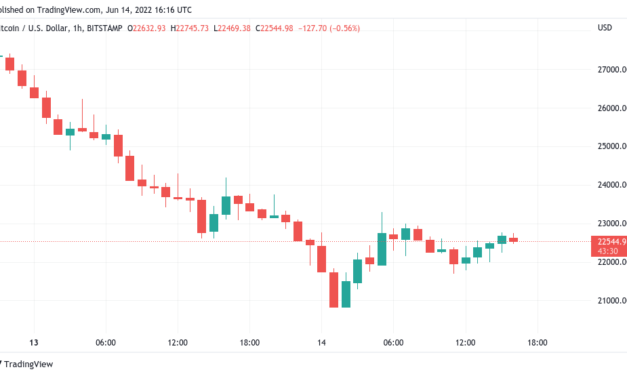
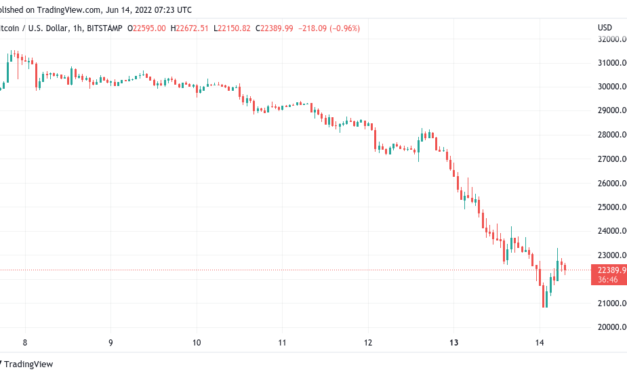
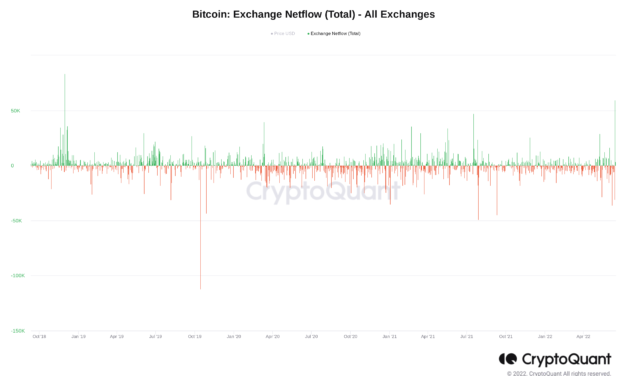
Bitcoin (BTC) could be on the verge of a retail major sell-off as exchange inflows spike to almost three-and-a-half-year highs.Data from on-chain analytics platform CryptoQuant shows users of 21 major exchanges sending coins to their wallets en masse June 14.Major exchanges finish up 83,000 BTC in a single dayAs BTC/USD fell to lows of $20,800, panic appeared to set in among traders, and despite a reversal that at one point topped $23,000, few seemed willing to trust that the worst was over.Since then, spot price action has returned to near $21,000, while 24-hour exchange inflows reached 59,376 BTC.According to CryptoQuant data, this is the largest daily inflow since November 30, 2018. On that day, exchanges recorded 83,481 BTC of net inflows. May 9, 2022 ended with 29,082 BTC in net inflows for the platforms monitored by CryptoQuant.Concerns may thus now turn to whether even more sell-side pressure will emerge in Bitcoin markets over the coming days and weeks. Around a month after the 2018 influx, BTC/USD hit its cycle bottom of $3,100, 84% below its prior all-time high of $20,000.Bitcoin exchange netflows chart. Source: CryptoQuantAs Cointelegraph reported, analysts are of mixed opinion when it comes to whether Bitcoin will repeat the trend this cycle. An 84% drawdown would mean a bottom of just $11,000.In a separate analysis of the price situation, statistician Willy Woo concluded that macro market movements would dictate Bitcoin’s bottom.”I think it’s simpler than this, IMO we’ll find a bottom when macro markets stabilise,” part of a Twitter thread contemplating various price support theories read.FTX, Binance see particularly heavy sellingAnalyzing who has been selling so far, meanwhile, CryptoQuant CEO, Ki Young Ju, pointed the finger at derivatives traders and largest global exchange Binance.Related: ‘Too early’ to say Bitcoin price has reclaimed key bear market support — AnalysisKi noted that the largest number of coin days destroyed — unmoved coins becoming active after a dormant period — came from those specific venues.“This selling pressure came from Binance and FTX,” he wrote in a Twitter thread June 13.“$BTC Exchange Inflow CDD(Coins Days Destroyed) indicates old whale deposits. Binance’s Inflow CDD reached a year-high before the drop.”Bitcoin coin days destroyed for Binance, FTX (screenshot). Source: Ki Young Ju/ TwitterKi added that this was in contrast to other whales, who have been comparatively quiet throughout the price upheaval, which began with May’s Terra LUNA implosion.Data from on-chain analytics resource Coinglass meanwhile shows the extent of downside bias on FTX especially in recent days.Bitcoin funding rates for Binance, FTX. Source: CoinglassThe views and opinions expressed here are solely those of the author and do not necessarily reflect the views of Cointelegraph.com. Every investment and trading move involves risk, you should conduct your own research when making a decision.

Čítaj viac

'Too early' to say Bitcoin price has reclaimed key bear market support — Analysis

Bitcoin (BTC) crept higher after the June 14 Wall Street open as analysts hoped that long-term support had been preserved.BTC/USD 1-hour candle chart (Bitstamp). Source: TradingViewHopes for “relief” from FOMC meetingData from Cointelegraph Markets Pro and TradingView followed BTC/USD as it traded above $22,500 at the time of writing, having hit local highs of $23,300 on the day.The pair had seen a strong bounce after nearing $20,800, with traditional markets likewise recovering after panic set in over United States inflation.Eyeing where Bitcoin could go next, on-chain analytics resource Material Indicators noted that the market had reclaimed the 200-day simple moving average (200 SMA), an important feature of Bitcoin bear markets that acted as support throughout previous price cycles.Nonetheless, it was “too early to tell” if the 200 SMA would continue to provide an attractive zone, a tweet stated, with the Federal Reserve due to provide inflation cues on June 15.#BTC just reclaimed the 200 Week MA. Some decent bid liquidity seen on #FireCharts, but too early to tell if it will hold. Expect all eyes to be on the #FOMC conference Wednesday. pic.twitter.com/OEV18iTSrD— Material Indicators (@MI_Algos) June 14, 2022Keeping the Fed in mind were most crypto social media commentators, as expectations showed that the majority now favored an outsized rate hike next — 75 basis points instead of 50.Tomorrow’s FOMC expectations are weighted heavily towards extreme 150-175 bps rate hikes pic.twitter.com/l5EW64mnvP— CRYPTO₿IRB (@crypto_birb) June 14, 2022

“Currently the market gives a 96% probability that the Fed delivers a 75bps hike on Wednesday. The market had recently been pricing in a 50bps hike but last week’s hot inflation data changed that sentiment. (This time last week a 75bps hike was given ~4% chance of occurring),” popular Twitter account @tedtalksmacro wrote in one of a series of tweets on the day.He added that a 50-point rise would mean both stocks and crypto “should rally really hard,” while volatility was slated to mimic a “sell the rumor, buy the news” event.”Maybe they provide some relief,” Decentrader co-founder Filbfilb agreed in his own post.Time to buy, says metric in green for first time since $3,600Meanwhile, excitement was brewing over an on-chain metric reaching the “buy” zone for the first time since March 2020.Related: ‘Nothing issue’ — MicroStrategy CEO plans to hodl Bitcoin ‘through adversity’The MVRV-Z score, an expression of how many standard deviations spot price is away from realized price, returned to negative territory as BTC/USD dived under $23,400.MVRV-Z has historically caught the generation price bottoms of Bitcoin, and buying in its green zone has thus resulted in significant returns.Cointelegraph reported on the significance of Bitcoin’s realized price earlier in the week.Bitcoin MVRV-Z score chart. Source: GlassnodeThe views and opinions expressed here are solely those of the author and do not necessarily reflect the views of Cointelegraph.com. Every investment and trading move involves risk, you should conduct your own research when making a decision.

Čítaj viac

'Nothing issue' — MicroStrategy CEO plans to hodl Bitcoin 'through adversity'

Bitcoin (BTC) megahodler MicroStrategy can ride out further BTC price declines, even if it falls to just $3,500, its CEO confirms.In a tweet on June 14, Michael Saylor sought to allay fears that his firm’s BTC exposure may be about to cost it dearly.Saylor stays calm as MSTR dips furtherWith the largest corporate Bitcoin treasury, MicroStrategy has felt the pain of this year’s BTC price declines — at least on paper.According to the monitoring resource Bitcoin Treasuries, the firm’s 129,218 BTC stack is currently being held at a net loss of $1.06 billion — around two-thirds of its total market cap.This week, rumors over a potential default on a $205 million used to purchase those reserves intensified. Specifically, BTC/USD dropping below $21,000 would trigger a margin call, potentially losing MicroStrategy its position if it did not respond with extra capital.In the event, BTC/USD fell to lows around $20,800, but the company did not flinch, and Saylor appears as cool as ever — even bullish — on its Bitcoin approach.”When MicroStrategy adopted a Bitcoin Strategy, it anticipated volatility and structured its balance sheet so that it could continue to HODL through adversity,” he declared to Twitter followers.Saylor linked to a previous tweet from just after May’s drop to $23,800, which at the time was a ten-month low. In it, he outlined contingency plans, noting that even if all the available BTC were to be posted as collateral for the loan — implying a BTC price of under $3,600, the March 2020 bottom — the pool of available cash would not end there.”That’s all FUD,” he told mainstream media in a subsequent interview about the issue.”We started with $5 billion of unpledged collateral, we borrowed $200 million against it, so that’s a loan-to-value ratio of 4%. If Bitcoin fell 95% from that number the we’d have to post additional collateral.”He additionally called the margin call question a “nothing issue.”Nonetheless, not every market participant is so optimistic. A look at MicroStrategy’s share price this week shows the pitfalls of Bitcoin exposure from the perspective of legacy markets, MSTR now trading down 26.5% in a month and 73.4% year-to-date, according to data from TradingView.MSTR/USD 1-day candle chart. Source: TradingViewBitcoin corporate pioneers grin and bear itIt is not just MicroStrategy struggling with the numbers as Bitcoin heads to eighteen-month lows. Related: In this together: Musk and Saylor down a combined $1.5B on Bitcoin buysBitcoin Treasuries data shows that Tesla, which owns the second-largest BTC treasury, is now nursing an unrealized loss of $535 million on its initial $1.5 billion investment.Payment network Square’s $220 million stash is underwater by $40.8 million, while North American mining giant Marathon is now at a loss on its 8,133 BTC allocation.Tesla CEO Elon Musk, known for his crypto soundbites, has yet to break silence on his view of the market.Tesla stock has lost around 11% over the past month, including 1% on the June 14 Wall Street open.TSLA/USD 1-day candle chart. Source: TradingViewThe views and opinions expressed here are solely those of the author and do not necessarily reflect the views of Cointelegraph.com. Every investment and trading move involves risk, you should conduct your own research when making a decision.

Čítaj viac

BTC price crashes to $20.8K as ‘deadly’ candles liquidate $1.2 billion

Bitcoin (BTC) came within $1,000 of its previous cycle all-time highs on June 14 as liquidations mounted across crypto markets. BTC/USD 1-hour candle chart (Bitstamp). Source: TradingViewBitcoin price hits 18-month lowsData from Cointelegraph Markets Pro and TradingView showed BTC/USD hitting $20,816, on Bitstamp, its lowest since the week of December 14, 2020.A sell-off that began before the weekend intensified after the June 13 Wall Street opening bell, with Bitcoin and altcoins falling in step with United States equities.The S&P 500 finished the day down 3.9%, while the Nasdaq Composite Index shed 4.7% ahead of key comments from the U.S. Federal Reserve on its anti-inflation policy.The worst of the rout was reserved for crypto, however, and with that, BTC/USD lost 22.4% from the start of the week to the time of writing.The pair was also “uncomfortably close” to crossing the $20,000 mark, trading firm QCP Capital noted, this representing the all-time high from its previous halving cycle, something which had never happened before.In a circular to Telegram channel subscribers, QCP flagged both the inflation topic and potential insolvency at fintech protocol Celsius as driving the sell-off.“We have been expressing concern about the collapse of a significant credit player since the LUNA blowup. The market is now panicking about the impact and contagion if Celsius becomes insolvent,” it explained:“Some key liquidation levels that the market is looking out for are 1,150 in ETH, 0.8 in stETH/ETH and 20,000 in BTC. We are getting uncomfortably close.”For other analysts, all bets were off when it came to guessing the BTC price floor or whether key trendlines would hold as support.Deadly red candle, deadly green candle.— Michaël van de Poppe (@CryptoMichNL) June 13, 2022Rekt Capital warned that the 200-week simple moving average (SMA) at $22,400 had not been accompanied by significant volume interest, leaving the door open for a test of lower levels.“BTC has reached the 200-week MA but the volume influx isn’t as strong as in previous Bear Market Bottoms formed at the 200 MA,” he told Twitter followers:“But downside wicking below the 200 MA occurs & perhaps this wicking needs to occur this time to inspire a strong influx of volume.”At the time of writing, the 200 SMA appeared to be acting more like resistance than support on low timeframes.BTC/USD 1-week candle chart (Bitstamp) with 200 SMA. Source: TradingViewAltcoin futures index shows full force of retracementOn altcoins, Ether (ETH) fell to 40% below the previous week’s high to near the $1,000 mark.Related: Lowest weekly close since December 2020 — 5 things to know in Bitcoin this weekShould that break, it would be the first time that ETH/USD had traded at three-digit prices since January 2021. As Cointelegraph reported, the pair had already crossed its $1,530 peak from Bitcoin’s previous halving cycle.Across altcoins, there was little cause for celebration in this downtrend, Rekt Capital argued, highlighting flagging alt presence versus Bitcoin.Indeed the green HTF support that was lost in May has since turned into new resistanceAltcoin Index has fallen -50% sinceThe Index has since reached a new Monthly level (orange) which may be showing weakness alreadyStrongest support is at green down below#Ethereum #Crypto pic.twitter.com/cJlra7EkIq— Rekt Capital (@rektcapital) June 13, 2022

In a sign of the pain affecting all crypto traders, meanwhile, data from on-chain monitoring resource Coinglass confirmed cross-market liquidations passing $1.2 billion in just 24 hours.Crypto liquidations chart. Source: CoinglassThe views and opinions expressed here are solely those of the author and do not necessarily reflect the views of Cointelegraph.com. Every investment and trading move involves risk, you should conduct your own research when making a decision.

Čítaj viac

Bitcoin analysts are watching these BTC price levels as key trendline looms

Bitcoin (BTC) is trading at its lowest since mid-December 2020 on June 13, but the bottom could be anywhere.As the weekend sell-off intensifies, BTC/USD has now broken below its realized price for the first time since March 2020, data from Cointelegraph Markets Pro and TradingView confirms.Bitcoin clings to realized priceAt around $23,400, the realized price — the average price at which each BTC last moved — is acting as the first solid support so far on lower timeframes.Bitcoin realized price vs. BTC/USD chart. Source: GlassnodePrevious levels, including those highlighted as potential bottoms, have failed to hold, and sentiment continues to favor further sell-side pressure thanks to the Celsius aftermath, inflation and forthcoming actions by the United States Federal Reserve.Where BTC/USD could put in a final macro floor, meanwhile, is now a topic of heated debate.The first port of call for a significant drawdown is the 200-week simple moving average (200 SMA), traders and analysts agree.At $22,370 as of June 13, the 200 SMA has acted as key support throughout Bitcoin’s lifetime, with only brief wicks below it marking generational spot price bottoms. The 200 SMA has never broken its own uptrend, and the hope is that reaching it will allow bulls a period of respite.BTC/USD 1-week candle chart (Bitstamp) with 200 SMA. Source: TradingView”People are looking to buy there, it’s going to bounce more than likely at that area,” Josh Rager argued in a dedicated video update on the day.While describing the bounce at the 200 SMA as a “self-fulfilling prophecy,” thanks to the scope of interest in it, he warned that there was a guarantee that BTC/USD would not continue south this time around.This is thanks to historical precedent, which shows Bitcoin bottoming out up to 84% below its latest all-time high. At $69,000, such a bottom would thus lie at just $11,000.”That would be detrimental; I don’t think the price drops that low, I mean you’re basically looking at a full retrace of the entire bull market and we have never seen that,” Rager continued.Instead, areas of interest are the 2017 all-time high around $20,000, as well as the area immediately below, extending to $17,000. Also worth paying attention to is $14,000, equating to an 80% retracement from the current all-time highs, he added.As Cointelegraph reported, several of those levels have already been underscored by others as potential bottoms, among them by trader and analyst Rekt Capital.In a series of tweets on June 13, the significance of the 200 SMA again came into play. Historically, #BTC tends to wick -14% to -28% below the 200-week MAA -14% wick this time around would translate to a ~$19000 $BTCA -28% wick would mean BTC could reach as low as ~$15500 before reversing to the upside#Crypto #Bitcoin pic.twitter.com/j9tal7ZSt0— Rekt Capital (@rektcapital) June 13, 2022Fed becomes bulls’ last chance saloonAt the time of writing, meanwhile, BTC/USD had managed to avoid a fresh dive in line with U.S. equities markets.Related: Lowest weekly close since December 2020 — 5 things to know in Bitcoin this weekThe S&P 500, by contrast, lost down 3% within the first hour of trading, while the Nasdaq Composite Index shed 3.6%.To halt crypto’s decline, some claim only the Fed can step in, reversing monetary tightening as rising interest rates throttle growth.”Realize how little this crypto dump has to do with Celsius and the stETH drama and all to do with the widespread panic in risk assets (equities and crypto alike) and broken charts,” economist, trader and entrepreneur Alex Krueger told Twitter followers on the day, brushing aside the Celsius news.A further post read:”This is just my opinion, I’m often wrong. My guesstimate is Celsius added 1.2x to the fuel. Everybody making it about Celsius. Watch the media tomorrow. But without Friday’s CPI numbers and equities collapsing this would not have happened.”Nonetheless, illusions were few and far between for longtime Bitcoin market participants. Should BTC/USD drop below $20,000, it would be the first time ever that a previous halving cycle’s all-time high would be crossed.#Fed FOMC starts tomorrow. Chances of 50 bps vs 75 bps hike. pic.twitter.com/ftdQ9ZpmcL— Ansel Lindner (@AnselLindner) June 13, 2022

“Without a Fed pivot, I expect this will be the first cycle Bitcoin drops below the prior cycles’ all-time high,” Charles Edwards, CEO of asset manager Capriole, concluded.The views and opinions expressed here are solely those of the author and do not necessarily reflect the views of Cointelegraph.com. Every investment and trading move involves risk, you should conduct your own research when making a decision.

Čítaj viac

Získaj BONUS 8 € v Bitcoinoch

nakup bitcoin z karty

Registrácia Binance

Burza Binance

Aktuálne kurzy