Autor Cointelegraph By William Suberg

Bitcoin whale support lines up as trader says $14K 'most bearish' BTC price target

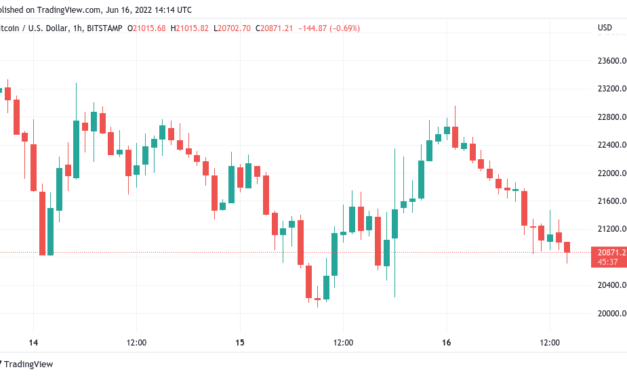
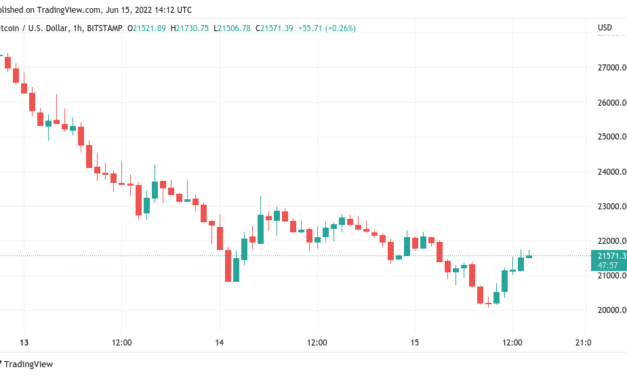
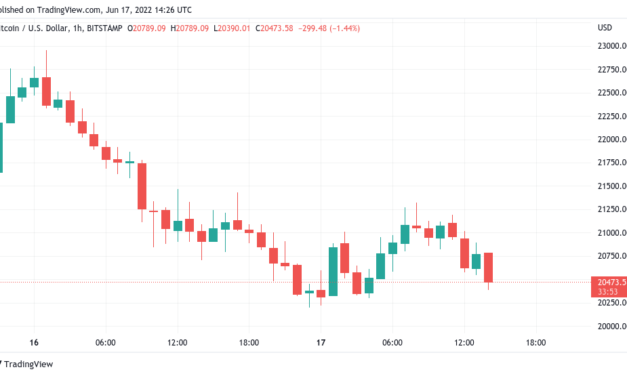
Bitcoin (BTC) survived another night without breaking $20,000 on June 17 as $14,000 cemented itself as a likely bottom level.BTC/USD 1-hour candle chart (Bitstamp). Source: TradingViewTrader plans to go “all in” on BTC at $14,000Data from Cointelegraph Markets Pro and TradingView showed BTC/USD dipping to $20,220 on Bitstamp overnight before rebounding up to $1,200 higher.The pair remained skittish but within a narrow range as market participants waited to see how long $20,000 would hold. The picture was complicated by increasing concerns over investment fund Three Arrows Capital and others, as rumors claimed the former was seeking a bailout after it failed to meet margin call obligations. As Cointelegraph reported, contagion expressed itself across institutional investment products including the Grayscale Bitcoin Trust (GBTC).Analyzing the “worst-case scenario,” meanwhile, popular analyst Venturefounder began to put more faith in $14,000 — an 80% drawdown from current $69,000 all-time highs.”Worst case scenario, imo, $20k BTC is the new $30K,” one of two tweets on the topic stated. “The speed of the $20k capitulation surprised me a little, thought it would have taken longer to happen. But knowing the macro narrative (stocks sell-off, QT taking away liquidity, huge players like 3ac dumping), it makes sense.”A second post concluded:”That being said, I hold my most bearish BTC downside target to be $14k, even if it goes lower, I don’t think it would stay lower for any meaningful period of time. I’m buying on the way down, but $14k = ALL IN Bitcoin for me, I will sell everything I own and put into BTC.”Between current spot price and that target lay areas where whales had purchased significant amounts of BTC in the period immediately after the March 2020 COVID-19 market crash.As on-chain monitoring resource Whalemap noted, these potential “bubbles” of support lay at $19,000, $16,000 and $14,000, respectively.3 bubbles 3 supports pic.twitter.com/Gd94C3nq9n— whalemap (@whale_map) June 16, 2022As Cointelegraph reported, other BTC price bottom predictions run as low as $11,000.DXY weakness could send Bitcoin to $23,000On macro, modest gains for United States equities at the Wall Street open took a back seat to an unwelcome rebound in U.S. dollar strength.Related: These 3 metrics suggest the Bitcoin price crash is not overThe U.S. dollar index (DXY), having come off its latest two-decade highs, returned with a vengeance to offer no respite to risk assets on the day. At the time of writing, DXY traded near 105 while continuing to rise, up from intraday lows of 103.5.U.S. dollar index (DXY) 1-hour candle chart. Source: TradingViewNonetheless, popular trader Crypto Ed still expected the week’s highs to remained unchallenged and for DXY to head lower once again. This, he told Twitter followers, should allow BTC/USD another shot at $23,000.That was close, now expecting another leg lower for $DXY which should be fueling #BTC to 23k pic.twitter.com/6Mt8UNywpS— Ed_NL (@Crypto_Ed_NL) June 17, 2022

The views and opinions expressed here are solely those of the author and do not necessarily reflect the views of Cointelegraph.com. Every investment and trading move involves risk, you should conduct your own research when making a decision.

Čítaj viac

GBTC premium hits -34% all-time low as crypto funds ‘puke out’ tokens

The largest Bitcoin investment vehicle, the Grayscale Bitcoin Trust (GBTC), is now trading at its biggest ever discount to the spot market.Data from on-chain analytics resource Coinglass shows GBTC shares down 34% versus BTC/USD on major exchanges as of June 17.GBTC suffers in market downturnAmid continued turmoil in DeFi spilling over to infect the crypto market, conditions have deteriorated for investors big and small.The latest figures now show that institutions have definitively failed to avoid the contagion, and the already underperforming GBTC has hit new lows.The GBTC premium, long a misnomer due to the fund’s shares in fact costing less than Bitcoin itself, is circling its lowest values in history. On June 17, these traded at 34.2% cheaper than the Bitcoin spot price (also known as net asset value or NAV).A sharp downturn accompanied a similar dip on spot markets as BTC/USD retested $20,000 twice.GBTC premium vs. asset holdings vs. BTC/USD chart. Source: CoinglassAs Grayscale pursues United States regulators for permission to convert GBTC to a Bitcoin spot price exchange-traded fund (ETF), conditions continue to look unfavorable for crypto institutional products amid heightened government attention in the wake of the Terra and Celsius meltdowns.While the firm remains buoyant on the outlook, GBTC’s performance has not escaped commentators, who point the finger at regulators for what they see as inaccurate risk assessment. Bitcoin spot ETFs remain outlawed in the U.S. due to investor protection concerns, allowing countries such as Canada and Australia to gain first-mover advantage.Shares of $GBTC are now 66.9% lower than they were at the peak of 2017 despite $BTC trading 5% higher. Make sure to thank Mr. Gensler for the protection everyone. pic.twitter.com/Q1cAw8hBtR— Dylan LeClair (@DylanLeClair_) June 16, 2022“Without ETF approval GBTC may go to -100% premium to NAV,” Vijay Boyapati joked this week. Hayes names D-Day for crypto market bottomThis situation has not been helped by reported liquidity problems at multiple crypto funds with exposure to those already facing severe losses. Embattled Three Arrows Capital (known as 3AC), for example, is the largest GBTC holder with over 38.8 million shares.Related: These 3 metrics suggest the Bitcoin price crash is not overAs 3AC fails to meet margin call requirements this week, a marked gap is opening between GBTC and its competition. The ProShares Bitcoin Strategy ETF (BITO), the first U.S. approved ETF based on Bitcoin futures, has even added BTC to its assets under management in recent days.For Arthur Hayes, former head of derivatives giant BitMEX, some of the biggest names in crypto institutional investing are thus facing a “River Styx” moment.In his latest blog post on June 17, Hayes delivered a fresh blow to the fate of embattled projects Celsius, Terra and more.“As this cohort of firms is forced to puke out any asset that is not locked in some long-term yield strategy, look out below,” he predicted.“More indiscriminate selling of all liquid assets on their loan books will occur so these lending firms may return assets to their retail depositors.”Having previously called a bottom of $1,000 for Ether (ETH) and $25,000 for Bitcoin, Hayes acknowledged that the reality had been much worse.The upcoming July 4 holiday weekend, he added, should provide ideal conditions for a macro bottom, particularly as Q2 comes to a close.“June 30 to July 5 is going to be a wild ride to the downside,” the blog post continues.“My $25,000 to $27,000 Bitcoin and $1,700 to $1,800 Ether bottom levels lay in tatters. How low can we go? I believe we’ll find out on this fateful weekend.”The views and opinions expressed here are solely those of the author and do not necessarily reflect the views of Cointelegraph.com. Every investment and trading move involves risk, you should conduct your own research when making a decision.

Čítaj viac

BTC price rejects at $23K as US dollar declines from fresh 20-year highs

Bitcoin (BTC) ran out of steam near $23,000 on June 16 after the biggest United States key rate hike in nearly thirty years.BTC/USD 1-hour candle chart (Bitstamp). Source: TradingViewDollar strength wobbles after rate hike newsData from Cointelegraph Markets Pro and TradingView showed BTC/USD reaching highs of $22,957 on Bitstamp after the Federal Reserve confirmed a 0.75% hike in June — its largest since 1994.Momentum did not last long, however, and at the time of writing, the pair had shed $2,000 to return to $21,000 at the new Wall Street open.$BTC Did indeed fail to hold the mid range and fell back to the range low which it has held so far.This range low is my line in the sand if BTC doesn’t want to revisit the lows and possibly test sub $20K levels.Holding here and we can target the mid range (and higher) again. https://t.co/mFDHX0B57x pic.twitter.com/mEqOoGA9gK— Daan Crypto Trades (@DaanCrypto) June 16, 2022Popular trader Crypto Tony eyed the U.S. dollar on the back of the Fed’s decision, with an about turn in USD strength key to a possible Bitcoin bottom.The U.S. dollar index (DXY), after spiking to twenty-year highs again after the announcement, began retracing through June 16.”Coming up to a big resistance zone on the dollar, which if we can reject from here and dump. The Bitcoin bottom may be in soon,” he told Twitter followers. “However i am looking for another tap up before the drop, which coincides with another leg down on $BTC so keep an eye on this.”U.S. dollar index (DXY) 1-day candle chart. Source: TradingViewVeteran trader Peter Brandt, well known for his Bitcoin bottom calls, meanwhile said that a retest of $20,000 would spark not a genuine recovery but a “relief rally.””Basically the bear market is no where close to over for crypto. Was hoping for a nice rally here but the market may need some more time,” commentator Josh Rager added in part of a tweet. EU, Japan cracks showAs U.S. equities opened down after rebounding on the Fed news, concerns around other world economies were just as fresh in the minds of many traders.Related: These 3 metrics suggest the Bitcoin price crash is not overThe European Union was dealing with a blowout in Italian bonds, while in Japan, currency weakness in the yen was becoming increasingly unnerving.The idea of yield curve control needs to be retired. #Japan is breaking. pic.twitter.com/P4YL3kBLzS— Ansel Lindner (@AnselLindner) June 16, 2022

Due to a combination of a strong dollar and ongoing quantitative easing — not tightening — USD/JPY hit its highest since the late 1990s this week.Both economies’ struggles were covered by Arthur Hayes, former CEO of derivatives platform BitMEX, in blog posts on Bitcoin’s future in recent months. For Hayes, the macro turmoil, which would ultimately cement Bitcoin’s status was already playing out, but pain would precede any form of relief for the largest cryptocurrency and its investors.USD/JPY 1-month candle chart. Source: TradingViewThe views and opinions expressed here are solely those of the author and do not necessarily reflect the views of Cointelegraph.com. Every investment and trading move involves risk, you should conduct your own research when making a decision.

Čítaj viac

These 3 metrics suggest the Bitcoin price crash is not over

Bitcoin (BTC) near $20,000 is worrying the market, but after narrowly avoiding breaking support, is the worst really over?According to multiple on-chain indicators, it seems that max pain has yet to arrive this cycle.The stakes are high for many hodlers this week — almost 50% of the supply is being held at a loss and miners are upping their shipments of BTC to exchanges.Even some of Bitcoin’s biggest investors, notably MicroStrategy, are having to defend their conviction on BTC as price action tumbles.With targets ranging as low as $11,000, Cointelegraph takes a look at how much further the market technically needs to drop to match historical bottom zones.Weak hodlers still to be flushed outDespite the drop to eighteen-month lows, Bitcoin price action has not yet shaken out all its speculators. According to the RHODL Ratio from Philip Swift, creator of on-chain analytics resource LookIntoBitcoin, more capitulation should be on the way.This is because historically, the ratio between short-term and long-term hodlers has been more in favor of the latter at macro price bottoms.RHODL specifically takes the ratio between the 1-week and the 1-2 year cohorts of the Realized Cap HODL Waves metric, which divides coins by when they last moved (weighted by realized price).Essentially, once RHODL’s green zone is it, it suggests that capitulation is at its peak and that a price floor is imminent or already being set. So far, RHODL has yet to enter its green zone, data from on-chain analytics firm Glassnode shows.Bitcoin RHODL Ratio chart. Source: GlassnodeNot enough hodlers are underwaterIt may feel like the entire Bitcoin market is at a loss, but above $20,000, many are still holding onto what are likely meagre gains, hoping for a rebound.Fellow on-chain analytics platform CryptoQuant reveals that as of June 16, just 46% of the total BTC supply is being held at a loss.This is impressive as a statistic in itself, but not enough to call a macro capitulation event if historical patterns are taken into account.According to CryptoQuant data, at least 60% of the supply needs to generate unrealized losses before it can be called capitulation — as was the case in March 2020, late 2018 and earlier.Bitcoin percentage of supply in loss chart. Source: CryptoQuantCryptoQuant CEO, Ki Young Ju, noted the significance of BTC/USD returning to its realized price last week. This event, two years in the making, signifies spot price going under the average price at which all coins last moved.”Been waiting for this moment for 2 years since the great sell-off in March 2020,” he commented at the time.No surrender for miners despite “impressive” exchange flowsDespite their production cost likely being closer to $30,000 than $20,000, Bitcoin miners have yet to start covering expenses with sales of hoarded BTC. Coins are moving to exchanges, however, at the highest rate in seven months, Cointelegraph reported.Related: $30K BTC price has ‘severe impact’ on Bitcoin miner profitsAs such, Bitcoin’s network hash rate has not taken a serious dive yet, something common during periods of significant price pressure. The Hash Ribbons metric, created by asset manager Capriole CEO, Charles Edwards, confirms the lack of trend.Hash Ribbons use the 30-day and 60-day moving average of hash rate to determine when miner capitulation is occurring. Once the rising 30-day crosses above the 60-day, it can be assumed that the “worst” is over as miners return to work.So far, that crossover is yet to happen, and historically, this means that max pain could lie ahead.Bitcoin Hash Ribbons chart. Source: Glassnode”Impressive bitcoin miner exchange flows,” economist, trader and entrepreneur, Max Krueger, meanwhile commented about miner activity this week. “Many miners would be in deep trouble with $BTC in the teens, panicking yesterday in anticipation of 20k breaking makes sense.”The views and opinions expressed here are solely those of the author and do not necessarily reflect the views of Cointelegraph.com. Every investment and trading move involves risk, you should conduct your own research when making a decision.

Čítaj viac

Bitcoin bounces 8% from lows amid warning BTC price bottom 'shouldn't be like that'

Bitcoin (BTC) spared hodlers the pain of losing $20,000 on June 15 after BTC/USD came dangerously close to last cycle’s high.BTC/USD 1-hour candle chart (Bitstamp). Source: TradingViewBitcoin “bottom” fools nobodyData from Cointelegraph Markets Pro and TradingView showed BTC/USD surging higher after reaching $20,079 on Bitstamp.In a pause from its sell-off, the pair followed United States equities higher on the Wall Street open, hitting $21,700. The S&P 500 gained 1.4% after the opening bell, while the Nasdaq Composite Index managed 1.6%.The renewed market strength, commentators said, was thanks to the majority already pricing in outsized key rate hikes by the Federal Reserve, due to be confirmed on the day.Nonetheless, it was crypto taking the worst hit in the inflationary environment, Bloomberg chief commodity strategist Mike McGlone noted. In a tweet, he contrasted Bitcoin and altcoin performance with skyrocketing commodities, notably WTI crude oil, futures of which now traded at almost double their 200-week moving average.”Unprecedented Crude Spike vs. Bottoms in Bitcoin, Bonds, Gold — Crude oil futures’ historically extreme stretch above its 200-week mean is ample fuel for inflation to spike, consumer sentiment to plunge, Federal Reserve rate hikes to accelerate and an enduring hangover,” he argued.WTI crude oil futures 1-week candle chart with 200-day moving average. Source: TradingViewDespite suppressed price action, many were unconvinced that Bitcoin could meanwhile sustain even the low $20,000 zone much longer.”We have yet to see capitulation in the Crypto markets,” popular trader Crypto Tony told Twitter followers. “It is close, but doesn’t feel like it yet. Every bounce is filled with optimism and it shouldn’t be like that.”Fellow trader and analyst Rekt Capital agreed, saying that the sell-off had not been accompanied by suitable volume.”Strong market-wide selling is going on for BTC,” he wrote on the day. “Undoubtedly, Seller Exhaustion lies ahead. Watch for high sellside volume bars. These tend to signal bottoming out after constant selling & precede an entire trend reversal over time.”As Cointelegraph reported, Bitcoin’s own 200-week moving average lay at $22,400, Rekt Capital warning that the level could now form a price magnet for weeks or even months.Losses still do not equal “capitulation” — dataData meanwhile showed the extent to which panic selling had been taking place in the short term.Related: Bitcoin miners’ exchange flow reaches 7-month high as BTC price tanks below $21KWeekly realized losses reached 2.6% of Bitcoin’s realized cap, the highest ever, according to figures from on-chain analytics firm Glassnode illustrated by CryptoVizArt.The cumulative weekly realized loss currently is = 2.6% of the #BTC realized cap. The comparable historical events where this ratio >2.5% are illustrated by . pic.twitter.com/jbl3aD5WmJ— CryptoVizArt.btc ∞/21M – LOST #BTC (@CryptoVizArt) June 15, 2022Bitcoin’s net unrealized profit/loss (NUPL) metric, covering coins not physically sold, also demonstrated a significant proportion of the hodled supply being underwater — the most, in fact, since March 2020. According to its accompanying scale, the metric has turning red after falling below zero, i.e., the historical “capitulation” zone.Bitcoin NUPL vs. BTC/USD chart. Source: TradingViewThe views and opinions expressed here are solely those of the author and do not necessarily reflect the views of Cointelegraph.com. Every investment and trading move involves risk, you should conduct your own research when making a decision.

Čítaj viac

Získaj BONUS 8 € v Bitcoinoch

nakup bitcoin z karty

Registrácia Binance

Burza Binance

Aktuálne kurzy