Autor Cointelegraph By William Suberg

That’s not hodling! Over 50% of Bitcoin addresses still in profit

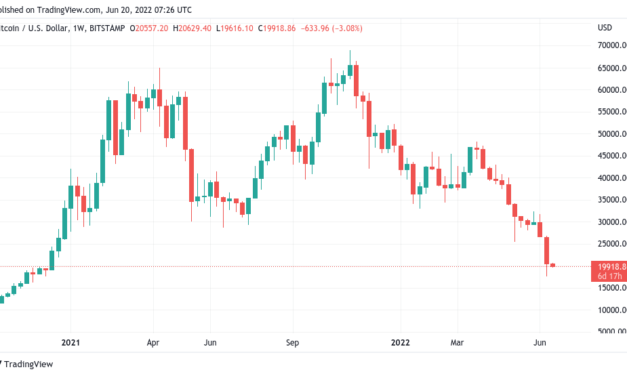
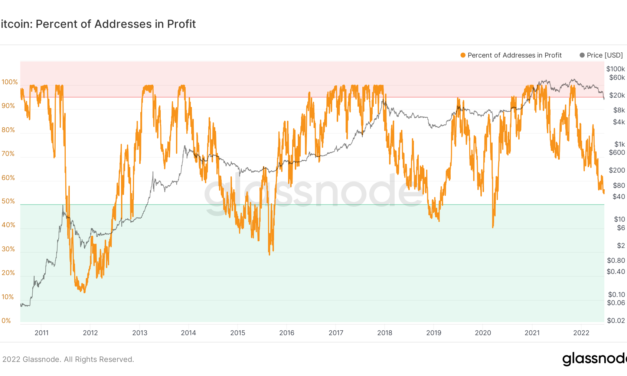
More than half of Bitcoin (BTC) addresses are still in profit, raising questions about the severity of the current “bear market.”Data from on-chain analytics firm Glassnode confirms that as of June 20, 56.2% of addresses were still worth more in U.S. dollar terms than when their coins entered them.Profitability fails to match previous market bottomsAs BTC/USD fell to 19-month lows of $17,600 over the weekend, analysts braced for what they assume will turn out to be a retracement of up to 84.5% from all-time highs.A sense of confusion reigns this year thanks to those highs not being “high enough” compared to historical bull market tops. The subsequent drawdown has thus taken many by surprise, despite so far not matching previous bear markets. The Glassnode figures support that idea. BTC price bottoms have tended to coincide with less than half of addresses remaining in profit, and as such, the current downtrend still has a way to go if it is to fit in with historical patterns.In March 2020, for instance, profitable addresses dropped to 41%, and before that, the 2018 bear market also saw a drop below the 50% mark.Bitcoin percent of addresses in profit chart. Source: GlassnodePanic, however, may already be setting in. As Cointelegraph reported, realized losses have been mounting among hodlers too uneasy about babysitting their funds any longer.June 13 saw the largest on-chain realized losses in BItcoin’s history, these hitting $4.76 billion in a single 24-hour period.Bitcoin realized losses chart. Source: GlassnodeMarket “getting closer” to the big shortOn the topic of how much selling needs to take place before the market reverses, Dylan LeClair, senior analyst at UTXO Management, eyed a split between retail and derivatives traders.Related: BTC price recovers to 3-day highs as new whale support forms at $19.2KIn times gone by, he argued this week, retail has sold first, and speculators come in to finish the process by shorting BTC to unnaturally low levels.“Getting closer,” part of a tweet summarized alongside a chart showing the costs to shorters increasing as price action waned in recent days.Bottom is in when the derivatives market is shorting $BTC into the dirt after the brunt of the spot selling has taken place. Getting closer… pic.twitter.com/HfDDflu06D— Dylan LeClair (@DylanLeClair_) June 20, 2022LeClair added that more liquidations are likely necessary in the DeFi space before a definitive bottom can be put in.The views and opinions expressed here are solely those of the author and do not necessarily reflect the views of Cointelegraph.com. Every investment and trading move involves risk, you should conduct your own research when making a decision.

Čítaj viac

BTC price recovers to 3-day highs as new whale support forms at $19.2K

Bitcoin (BTC) held steady at the June 20 Wall Street open as nervous traders waited for a short-term trend decision.BTC/USD 1-hour candle chart (Bitstamp). Source: TradingViewTrader flags Bitcoin “macro bottoming period”Data from Cointelegraph Markets Pro and TradingView showed BTC/USD climbing to just shy of $21,000 at the time of writing, a three-day high.The weekend had spooked the majority of the market and liquidated speculators with a trip to $17,600, marking Bitcoin’s lowest levels since November 2020. Now, with United States equities cool at the start of the week, comparative calm characterized the largest cryptocurrency.“Nice reaction off of the bottom of our 16-20k demand zone,” popular trading account Credible Crypto commented on the weekend’s price action. “12 hours of bleeding erased in 2. No confirmation this is the reversal yet though. Focus on key HTF levels and don’t get too caught up staring at the red 5 minute candles- they can be erased in an instant.”When in doubt, zoom out — Crypto Tony (@CryptoTony__) June 20, 2022The idea of focusing on HTF, or higher timeframe price structures was shared by various commentators as the week began.“BTC is in a macro bottoming period for this cycle,” fellow trader and analyst Rekt Capital continued. “Over the next years, investors will be rewarded for buying here. Yet, many still wait for $BTC to go even lower to buy. It’s like waiting for Summer to come, and finally it’s 33C outside but now we hope for 35C.”Rekt Capital additionally described a $20,000 BTC price as a “gift” to buyers.“BTC data science shows that anything below $35,000 is an area that has historically yielded outsized ROI for long-term Bitcoin investors,” part of a tweet on the day read.On-chain analytics resource Whalemap meanwhile highlighted dip-buying by major investors at levels below the seminal $20,000.New whale level has formed over the weekend’s dump.The accumulation is quite large, >100k BTC, and happened on the 18th of June. Prior to that, a large portion of Dec 2018 Bitcoins have moved from the previous 4k bottom… Could be OTCLooks like a great short-term support pic.twitter.com/rJbV26ZifG— whalemap (@whale_map) June 20, 2022

PlanB: Bitcoin is simply “oversold”Bitcoin heading below its prior halving cycle all-time high meanwhile increased pressure on the popular Stock-to-Flow BTC price models — and criticism of them.Related: ‘Worst quarter ever’ for stocks — 5 things to know in Bitcoin this weekAs market analyst Zack Voell openly called S2F a “scam” on social media, quant analyst PlanB, its creator, maintained that the theory behind it remained sound.”Most indicators (S2F, RSI,200WMA, Realized etc) are at extreme levels,” he explained in part of a Twitter post on June 18. “Does that mean that all indicators are ‘invalidated’ ‘debunked’? No. Investing is a game of probabilities and indicators give situational awareness: BTC is oversold.”Voell’s comments had come after BTC/USD dipped below the second standard deviation band relative to the S2F predicted price for the first time.Bitcoin isn’t dead.But the Stock-to-Flow scam absolutely is. pic.twitter.com/ZYZ0NR8n92— Zack Voell (@zackvoell) June 19, 2022

As PlanB noted, Bitcoin’s relative strength index, or RSI, was at its lowest levels in history over the weekend. A classic overbought vs. oversold indicator, RSI essentially suggests that BTC/USD is trading much lower than its fundamentals warrant, based on historical context.BTC/USD 1-week candle chart (Bitstamp) with RSI. Source: TradingViewThe views and opinions expressed here are solely those of the author and do not necessarily reflect the views of Cointelegraph.com. Every investment and trading move involves risk, you should conduct your own research when making a decision.

Čítaj viac

'Worst quarter ever' for stocks — 5 things to know in Bitcoin this week

Bitcoin (BTC) starts a new week still battling for $20,000 support as the market takes in a week of severe losses.What felt all but impossible just weeks ago is now reality as $20,000 — the all-time high from 2017-2020 — returns to give investors a grim sense of deja vu.Bitcoin dipped as low as $17,600 over the weekend, and tensions are running high ahead of the June 20 Wall Street open.While BTC price losses have statistically been here before — and even lower — concerns are mounting for network stability at current levels, with attention particularly focused on miners.Add to that the consensus that macro markets have likely not bottomed and it becomes understandable why sentiment around Bitcoin and crypto is at record low levels.Cointelegraph takes a look at some major areas of interest for hodlers when it comes to Bitcoin price action in the coming days. Bitcoin rescues $20,000 on weekly chartAt $20,580, Bitcoin’s latest weekly close could have been worse — the largest cryptocurrency managed to retain a key support level at least on weekly timeframes.The wick below stretched $2,400, however, and a repeat performance could heighten the pain for those betting on $20,000 forming a significant price level.Overnight, BTC/USD reached highs of $20,629 on Bitstamp before returning to consolidate immediately below the $20,000 mark, indicating that on lower timeframes, the situation remains precarious. Think prices should run up a lot now, punishing panic sellers and forced sellers. Recovering at least half the drop from two Fridays ago (CPI day). I want to see a fast reaction up from here next couple of days. The best rallies are those that don’t give laggards an entry.— Alex Krüger (@krugermacro) June 19, 2022While some call for a snap recovery, the overall mood among commentators remains one of more cautious optimism.“Over the weekend, while the fiat rails are closed, $BTC dropped to a low of $17,600 down almost 20% from Friday on good volume. Smells like a forced seller triggered a run on stops,” Arthur Hayes, ex-CEO of derivatives trading platform BitMEX, argued in a Twitter thread on the day.Hayes postulated that the recovery came as soon as those forced sales ended, but more sell-side pressure may still come.“Is it over yet … idk,” another post read. “But for those skilled knife catchers, there may yet be additional opportunities to buy coin from those who must whack every bid no matter the price.”The role of crypto hedge funds and related investment vehicles in exacerbating BTC price weakness has become a key topic of debate since the May Terra LUNA implosion. With Celsius, Three Arrows Capital and others now joining the chaos, forced liquidations resulting from multi-year lows may be what is required to stabilize the market long term.“Bitcoin is not done liquidating large players,” investor Mike Alfred argued over the weekend. “They will take it down to a level that will cause the maximum damage to the most overexposed players like Celsius and then suddenly it will bounce and go higher once those firms are completely obliterated. A story as old as time.”Elsewhere, $16,000 is still a popular target, this in itself only equating to a 76% drawdown from Bitcoin’s November 2021 all-time highs. As Cointelegraph reported, estimates currently run as low as $11,000 — 84.5%.“$31k-32k was broken and used as resistance. Same is happening with $20k-21k. Main target: $16k-17k, especially $16,000-16,250,” popular Twitter account Il Capo of Crypto summarized.It additionally described $16,000 as a “strong magnet.”BTC/USD 1-week candle chart (Bitstamp). Source: TradingViewStocks and bonds have “nowhere to hide”A limp outlook for equities prior to the Wall Street open meanwhile provides little by way of upside prospects for BTC on June 20.As noted by analyst and commentator Josh Rager, the correlation between Bitcoin and stocks remains in full force.Equity futures are downTherefore $BTC follows https://t.co/pXih3MdbzZ— Rager (@Rager) June 20, 2022

The stars seem to be aligning for shorters — globally, stocks are lining up their “worst quarter ever,” according to data current as of June 18, with crypto markets giving investors a taste of reality months in advance.Nowhere to hide: Stocks and bonds together are on track for their worst quarter ever. Meanwhile, credit markets have also taken a battering. #Bitcoin has lost over two-thirds of its value since it touched a high of nearly $70,000 in Nov. (via BBG) pic.twitter.com/CP3zmzhVTl— Holger Zschaepitz (@Schuldensuehner) June 18, 2022

As such, it seems that the only market player able to turn the tide is the central bank, and notably the Federal Reserve.Monetary tightening, some now claim, cannot last long, as its negative impact will force the Fed to start expanding the U.S. dollar supply once again. This in turn would see cash flow back into risk assets.This is a perspective even shared by the Fed itself in the event that the U.S. encounters a recession — something with a high chance of happening, depending on the interpretation of recent Fed comments.Referring to the accommodative environment with ultra-low rates, Fed governor Christopher J. Waller said in a speech June 18:“I hope we never have another two years like 2020 and 2021, but because of the low-interest-rate environment we now face, I believe that even in a typical recession there is a decent chance that we will be considering policy decisions in the future similar to those we made over the past two years.” For the meantime, however, policy dictates increased rate hikes, these being the direct trigger for increased risk-asset losses when announced by the Fed earlier in the month.Miners in no mood for capitulationWho is selling BTC at the lowest levels since November 2020? On-chain data has been tracking the investor cohorts contributing to selling pressure — some forced, some voluntarily.Miners, who may already be underwater when it comes to participating in finding blocks, have gone from buyers to sellers, halting a multi-year trend of accumulation.“Miners have spent around 9k $BTC from their treasuries this week, and still hold around 50k $BTC,” on-chain analytics firm Glassnode confirmed over the weekend.Miner production cost, however, is difficult to calculate exactly, and different setups face drastically different mining conditions and expenses. As such, many may still be profitable even at current prices.Bitcoin is not below electrical cost, especially large scale miners where marginal costs are closer to 10k than 20k. From @GalaxyDigitalHQ: pic.twitter.com/8iSvzZqCtT— MAGS ⛏️ (@Crypto_Mags) June 18, 2022

Data from BTC.com meanwhile delivers surprising news. Bitcoin’s network difficulty is not about to drop to reflect a miner exodus; instead, it is due to adjust upward this week.Difficulty allows the Bitcoin network to adjust to changing economic conditions and is the backbone of its uniquely successful Proof-of-Work algorithm. If miners quit due to a lack of profitability, difficulty automatically decreases to lower costs and make mining more attractive.So far, however, miners remain on board.Likewise, hash rate, while coming off record highs, remains above an estimated 200 exahashes per second (EH/s). Hardware power dedicated to mining is thus at similar levels to before. Bitcoin network fundamentals overview (screenshot). Source: BTC.comSeller or hodler, Bitcoiners see “massive” lossesOverall, however, both big and small hodlers who could not ride out the storm faced “massive” losses when they sold, Glassnode says.“If we assess the damage, we can see that almost all wallet cohorts, from Shrimp to Whales, now hold massive unrealized losses, worse than March 2020,” researchers noted alongside a chart showing just how far BTC holdings had fallen versus cost basis.“The least profitable wallet cohort hold 1-100 $BTC, and have unrealized losses equal to 30% of the Market Cap.”Bitcoin net unrealized profit/loss (NUPL) annotated chart. Source: Glassnode/ TwitterThe figures point to a state of panic among even seasoned investors, arguably a surprising phenomenon given Bitcoin’s history of volatility.A look at the HODL Waves indicator, which groups coins by how long ago they last moved, meanwhile captures on record those selling and those buying the dip. Between June 13 and June 19, the percentage of the overall BTC supply that last moved between a day and a week prior rose from 1.65% to nearly 6%.Bitcoin HODL Waves chart (screenshot). Source: Unchained CapitalSentiment almost hits historic lowsIt was already “comparable to a funeral” in December 2021, but crypto market sentiment has outdone itself.Related: Top 5 cryptocurrencies to watch this week: BTC, SOL, LTC, LINK, BSVAccording to monitoring resource the Crypto Fear & Greed Index, the average investor is now more fearful than at almost any time in the history of the industry.On June 19, the Index, which uses a basket of factors to calculate overall sentiment, fell to near record lows of just 6/100 — deep within its “extreme fear” category. The weekly close only marginally improved the situation, with the Index adding 3 points to still linger at levels that have historically marked bear market lows for Bitcoin.Only in August 2019 did Fear & Greed clock a lower score.Crypto Fear & Greed Index (screenshot). Source: Alternative.meThe views and opinions expressed here are solely those of the author and do not necessarily reflect the views of Cointelegraph.com. Every investment and trading move involves risk, you should conduct your own research when making a decision.

Čítaj viac

Bitcoin heads for dismal weekly close as BTC price rejects at $20K

Bitcoin (BTC) attempted to reclaim $20,000 as support on June 19 as bulls faced a $7,000 weekly red candle.BTC/USD 1-hour candle chart (Bitstamp). Source: TradingView$16,000 eyed for possible next moveData from Cointelegraph Markets Pro and TradingView showed BTC/USD rising from lows of $17,592 on Bitstamp before being firmly rejected at $20,000.Low-liquidity trading conditions had made for a grim weekend for hodlers as the largest cryptocurrency fell to levels not seen since November 2020.While recovering some losses, a sense of deja vu pervaded the market on the day. $20,000 had returned as resistance, this having formed an all-time high for Bitcoin for three years from December 2017 to December 2020.It was also the first time that BTC/USD had retreated under a previous halving cycle’s all-time high.There’s a first first everything. This is the first time Bitcoin has traded below prior cycle highs. I think it’s fair to say things are different now.— Charles Edwards (@caprioleio) June 18, 2022While some panicked, however, seasoned market participants remained broadly understanding of recent price action, which still corresponded with historical bear market patterns.”To put things into perspective: A Bitcoin crash of 74% as at present is nothing unusual,” markets commentator Holger Zschaepitz acknowledged. “In history, there have already been 4 collapses in which the leading cryptocurrency went from peak to trough by >80%.”In terms of what could like ahead, attention focused on $17,000 as a potential short-term target. A short squeeze higher, as popular Twitter account Credible Crypto noted, was not on the menu.Looks like no squeeze first. Well then, let’s rip the bandaid off and get this over with! https://t.co/xliurgtPrO— CrediBULL Crypto (@CredibleCrypto) June 18, 2022

Fellow trader and analyst Rekt Capital meanwhile added that Bitcoin’s 200-week moving average (MA), a key support line in bear markets, was still functioning as before.No matter how much of an extreme time this seems to be for #BTC Historically $BTC tends to wick between -14% to -28% below the 200-week MABTC has wicked -21% below the 200 MA so far, still within the historical range & not out of the ordinary in that respect#Crypto #Bitcoin pic.twitter.com/cJm5A9yYYO— Rekt Capital (@rektcapital) June 19, 2022

Sellers offload coins at a record lossAt around $7,000, however, the week’s red candle was set to be the one of the largest in Bitcoin’s history in dollar terms.Related: GBTC premium hits -34% all-time low as crypto funds ‘puke out’ tokensBTC/USD monthly returns chart. Source: CoinglassData from on-chain analytics platform Coinglass added that June 2022 was shaping up to be the worst on record, beating even 2013 in terms of losses.The last three consecutive days have been the largest USD denominated Realized Loss in #Bitcoin history.Over $7.325B in $BTC losses have been locked in by investors spending coins that were accumulated at higher prices.A thread exploring this in more detail 1/9 pic.twitter.com/O7DjSK2rEQ— glassnode (@glassnode) June 19, 2022

As a sign of investor pressure resulting from spot price performance, more BTC was sold at a loss in the three days to June 19 than at any other time, according to figures from on-chain analytics firm Glassnode.Additional concerns focused on the financial buoyancy of Bitcoin miners. Not everyone, however, agreed that network participants were feeling the pinch to the extent that capitulation would result.The views and opinions expressed here are solely those of the author and do not necessarily reflect the views of Cointelegraph.com. Every investment and trading move involves risk, you should conduct your own research when making a decision.

Čítaj viac

Bitcoin price falls below $20K for first time since 2020, Ethereum dips under $1K

Bitcoin (BTC) achieved a bear market first on June 18 as BTC price action gave up $20,000 support.BTC/USD 1-hour candle chart (Bitstamp). Source: TradingViewBTC price crosses under 2017 all-time highData from Cointelegraph Markets Pro and TradingView confirmed BTC/USD sliding under $20,000 for the first time since December 2020, reaching press-time lows of $19,066.As nerves heightened after the United States Federal Reserve’s comments on the inflation outlook, crypto markets bore the brunt of a sell-off, which began after shock Consumer Price Index (CPI) figures last week.Losing the psychologically significant $20,000 mark, Bitcoin also achieved a lifetime first — dropping below its previous halving cycle’s high for the first time in its history.There’s a first time for everything https://t.co/1qLdb67aHR— cevo (@cryptocevo) June 18, 2022The largest cryptocurrency had until now avoided such a move, this being reserved for altcoins, notably Ether (ETH) earlier in the week, which has also now slipped below the $1,000 mark for the first time since January 2021.Reacting, commentators attributed the latest weakness to liquidity problems at investment fund Three Arrows Capital (commonly known as 3AC) in addition to existing troubles tied to FinTech protocol Celsius and the overall macro environment.Luna, Celcius, 3AC = Contagion Those will lead to more blowups that we are yet to hear of Things likely get worse before they better. Until you start hearing about how all of these are intertwined and cause other funds to unwind becoming forced sellers https://t.co/oju42hSCNw— Pentoshi Powell Jr (@Pentosh1) June 15, 2022

Three Arrows co-founder Zhu Su said that the firm was “in the process of communicating with relevant parties and fully committed to working this out,” without confirming specific problems.The abrupt dip below $20,000 came during weekend trading where thin order book liquidity amplified volatility.A bear year unlike any other?BTC/USD thus sealed 37% losses for the first two weeks of the month, making June 2022 the worst month of June on record, according to data from on-chain monitoring resource Coinglass.Related: ‘Nothing issue’ — MicroStrategy CEO plans to hodl Bitcoin ‘through adversity’Year-to-date, the pair traded down almost 60% at the time of writing, over 70% below last November’s all-time highs of $69,000.As Cointelegraph reported, historical trends suggest that 80-84.5% is the classic drawdown target for bear markets, this putting BTC/USD at between $11,000 and $14,000.Bitcoin monthly price performance. Source: Coinglass.com”BTC still needs more volume & volatility than at present to match volume levels at previous Bear Market Bottoms at the 200 MA,” popular trader and analyst Rekt Capital tweeted, continuing analysis of Bitcoin’s 200-week moving average, a key lifelong support line. “Promising sign is that seller volume is above-average for the 1st time this week but much more is needed for final capitulation.”Bitcoin/USD 1-week candle chart. Source: Tradingview.comThe views and opinions expressed here are solely those of the author and do not necessarily reflect the views of Cointelegraph.com. Every investment and trading move involves risk, you should conduct your own research when making a decision.

Čítaj viac

Získaj BONUS 8 € v Bitcoinoch

nakup bitcoin z karty

Registrácia Binance

Burza Binance

Aktuálne kurzy