Autor Cointelegraph By William Suberg

First bear-market trend line reclaim since 2025: Five things to know in Bitcoin this week

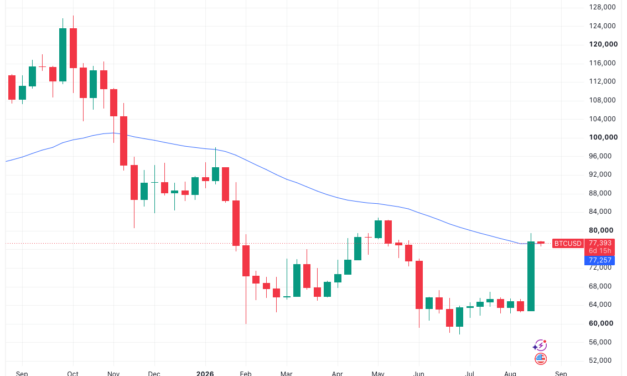
Bitcoin (BTC) starts the final week of August near its highest levels since mid-May as its bear-market recovery reaches a critical stage.Key points:Bitcoin sees a weekly candle close above its 50-week exponential moving average (EMA) for the first time since November 2025.Amid its best August gains in almost a decade, BTC/USD returns investor cohorts to net profit, while new money enters at $73,000.Fed chair Kevin Warsh is in the spotlight ahead of the Jackson Hole symposium.US PCE data will be released on Wednesday as markets continue to respond to last week’s US Treasury debt buyback.Investor capital returns to exchange-traded products as Bitcoin ETF netflows hit $1.9 billion last week.Bitcoin scrapes weekly close above key resistanceBitcoin reached $79,550 last week, its highest levels since early May as a five-day rally brought gains of up to 27%. BTC/USD closed last week at $77,727 on Bitstamp, per data from TradingView. This signified a reclaim of its 50-week exponential moving average (EMA), a key resistance trendline that currently sits at $77,752.The 50-week EMA is commonly brought into focus by traders during Bitcoin bear markets. The last candle close above this crucial line of resistance was in early November 2025. In prior bear markets, BTC has retested the 50-week EMA before capitulating into its ultimate macro lows. This has meant some traders remain unconvinced by last week’s strong price action.BTC/USD one-week chart with 50 EMA. Source: Cointelegraph/TradingViewPrior to the close, crypto trader and analyst Rekt Capital warned that not only the 50-week EMA but the entire area around $80,000 figured as resistance for bulls to overcome, while price so far has topped out lower.“Each Bear Market Relief Rally thus far would retrace sharply in the week following a strong breakout rally,” he wrote in ongoing X analysis. “Next weeks will be crucial. But maybe even already next week we’ll know whether Bitcoin can sustain these highs or not.”An accompanying chart showed what Rekt Capital subsequently called a series of macro lower highs, potentially reinforcing the bear market despite recent strength.BTC/USD one-week chart. Source: Rekt Capital on X.comEarlier, Cointelegraph reported on traders’ expectations of 2026 playing out in a similar manner to previous bear markets, with 2022 showing the most similarities in terms of timing. “If history repeats, Bitcoin will try to get as close as possible to ~$93,000 in 2027. But first, Bitcoin needs to fully confirm its Bear Market bottom and fully confirm a break of the Macro Downtrend,” Rekt Capital added.BTC price on track for best August in nine yearsBitcoin consolidated over the weekend, with price circling $77,500 at the time of writing, still up 22% month-to-date in its best performing August since 2017, per data from CoinGlass.BTC/USD monthly returns (screenshot). Source: CoinGlassThe run-up saw the weekly candle reclaim several key price points, including the aggregate cost basis for short-term holders (STHs) — wallets holding a UTXO for less than 155 days — at $68,700. Onchain analytics platform CryptoQuant thus calculated STH net profitability at just over 11%.“At the same time, Long-Term Holder profitability moved from approximately breakeven to +18.5%, while New Money profitability rose from -1.4% to +12.7%,” it reported on Monday.Examining the cost basis of UTXOs as a whole, CryptoQuant noted that so-called “new money” now has a breakeven point at $73,000, above both the STH and LTH cost basis, leaving less margin for downside protection should BTC/USD reverse to attempt to find new support lower.“That makes the 68K-73K region the key area to watch. Holding above it would suggest that the profitability reset is becoming structurally durable. Losing it would quickly push a large portion of recent buyers back into loss,” it added.Bitcoin UTXO distribution by cohort age (screenshot). Source: CryptoQuantFed’s Warsh faces the music at Jackson HoleAll eyes are on the Federal Reserve and chair Kevin Warsh this week as the annual Jackson Hole economic symposium gets underway. The event, which will feature central bankers from over 70 countries, sees Warsh’s first keynote speech as Fed chair and his first public speaking appearance since the press conference that followed the July Federal Open Market Committee (FOMC) meeting.Warsh has maintained a tight-lipped stance on financial policy, especially when it comes to future interest-rate changes — a topic to which crypto and risk assets are sensitive. Recent inflation data has supported a softening of policy going forward, but the ever-present threat of oil-price spikes from the US-Iran war has kept markets wary. The latest data from CME Group’s FedWatch Tool shows 63.1% odds of rates remaining at their current 3.50-3.75% level after the September FOMC meeting.Fed target-rate probability comparison for September FOMC meeting (screenshot). Source: CME GroupSpeaking to CNBC last week, Thierry Wizman, global foreign exchange and rates strategist at Macquarie Group, warned that Warsh now had to juggle the influence of the Treasury with his plan to reduce the market involvement of the Fed.Wizman told the network that “were Warsh to signal that he would stay ‘dovish’ indefinitely, it could be self-defeating for him and the Treasury, since inflation breakevens would rise further, perhaps undoing the stability in the nominal long-term yields that [Treasury Secretary] Scott Bessent is trying to achieve.”A survey of fund managers by Bank of America, quoted by Barchart and others, produced 72% odds of no rate hikes occurring before the US midterm elections in November. On policy, consensus coalesced around a “no landing” scenario over the next 12 months — where the economy avoids recession amid strong growth and low unemployment. Yield curve control talk returns after Treasury debt moveBeyond geopolitics, a move by the US Treasury last week to at least double the size of its debt buyback purchases to $4 billion per operation was the key market mover last week. The announcement sparked a Bitcoin short squeeze that went on to wipe out a record $3.1 billion of crypto short positions over two days.The extent of the reaction sparked suggestions that Bitcoin was once again anticipating global liquidity-regime changes amid the rising cost of government debt financing worldwide.“The intervention ignited a move in assets sensitive to the outlook for liquidity, including gold and Bitcoin. That hints at market concerns over currency debasement should measures like quantitative easing make a return to contain interest rates,” trading resource Mosaic Asset Company wrote in the latest edition of its regular newsletter, The Market Mosaic.Mosaic argued that the intervention represented not a mere liquidity move but a form of yield curve control (YCC), with short-term bonds issued to cover the cost of the added buybacks. Crypto commentators have long expected YCC to be all but guaranteed to prevent government bankruptcy.“YCC is the end game. When it is finally implicitly or explicitly declared, it’s game over for the value of the USD vs. gold and more importantly Bitcoin,” Arthur Hayes, former CEO of crypto exchange BitMEX, forecast in a 2022 blog post. “YCC is how we get to $1 million Bitcoin and $10,000 to $20,000 gold.”The day prior to Warsh’s appearance, meanwhile, brings a crucial piece of US macroeconomic data that could skew the mood for markets. The July print of the Personal Consumption Expenditures (PCE) index, due for release on Wednesday, is known to be the Fed’s “preferred” inflation gauge. In June it saw its first month-on-month drop since 2020.Consensus around the upcoming print is for a 0.1% monthly increase, with the year-on-year increase cooling further to 3.6% versus 3.7% in June. PCE index one-month % change (screenshot). Source: US Bureau of Economic AnalysisBitcoin ETFs see strongest inflows in 10 monthsCrypto fund inflows remain highly reactive to price volatility, with last week’s inflows to the US spot Bitcoin exchange-traded funds (ETFs) breaking records.Related: Bitcoin has ‘largely purged’ froth that preceded 50% drop from $126K: BlackRockData from UK-based investment company Farside Investors shows the ETF cohort taking in $1.9 billion over the week’s five trading days — the strongest weekly tally since October 2025, when Bitcoin hit its latest all-time highs of $126,200.Thursday saw particularly strong performance as BTC/USD extended gains beyond $70,000, with BlackRock’s ETF, the iShares Bitcoin Trust (IBIT), seeing net inflows of more than half a billion dollars.“We saw net inflows on every trading day last week, which suggests renewed investor interest in Bitcoin,” Gracie Lin, chief executive officer of crypto exchange OKX SG, told Bloomberg. “The question now is whether that momentum will hold. After such a strong move in Bitcoin, some profit-taking wouldn’t be surprising.”US spot Bitcoin ETF netflows (screenshot). Source: Farside InvestorsThe results heavily contrast with activity just two months ago, with June seeing unprecedented net outflows of more than $4.5 billion. At the end of last week, total August inflows stood at $2.38 billion, a new year-to-date record.

Čítaj viac
Bitcoin seeks support near $77K as BTC, gold near 100-day highs

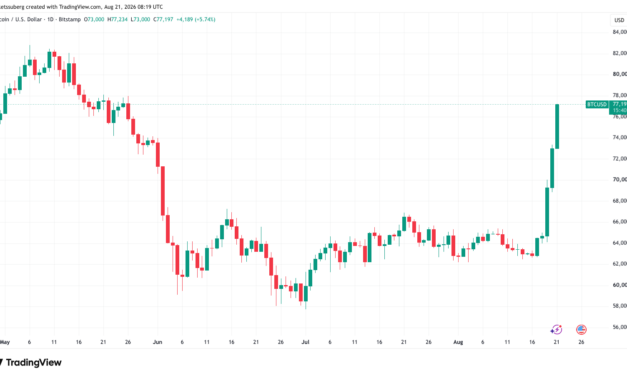
Bitcoin (BTC) consolidated above $77,000 after Friday’s Wall Street open as gold joined the crypto rally to hit 14-week highs.Key points:Bitcoin and gold both hit their highest levels since May 15 against the US dollar.Analysis ties the strong performance firmly to US government debt policy.Polymarket odds of Bitcoin reaching $90,000 before 2027 reach 48%.Analysis: Bitcoin and gold gains not “surprise”Data from TradingView showed BTC/USD cooling after reaching its highest levels since May 15, still up nearly 6% on the day.BTC/USD one-hour chart. Source: Cointelegraph/TradingViewGold echoed the move, reaching multi-month highs of $4,632 per ounce, up 2.2% on the day at the time of writing. On a monthly basis, BTC/USD and XAU/USD were up 13% and 16%, respectively.BTC/USD vs. XAU/USD one-day chart. Source: Cointelegraph/TradingView“What’s happening now in gold and crypto should not come as a surprise,” market commentary The Kobeissi Letter wrote in a response on X.Kobeissi attributed the rapid gains in precious metals and crypto to a combination of inflation, deficit spending and US Treasury policy. Record government deficit spending and the Treasury Department’s pledge to at least double the size of certain debt buyback operations to $4 billion helped drive the rally in both asset classes, Kobeissi argued.Discussing Bitcoin’s reaction to the current macro landscape, trading company QCP Capital noted that the financial stress signals went beyond the US, highlighting surging Japanese government bond yields after a rare joint currency intervention in the yen earlier this month.“The most notable cross-asset signal this week has been the divergence after Treasury’s announcement. Treasuries initially rallied before giving back much of the move. BTC and gold did not retrace to the same extent,” it wrote in its latest Market Color analysis, adding:“That does not establish a new liquidity or monetary regime, but it does highlight the sensitivity of alternative assets to changes in long-end rates and the dollar.”Polymarket 2026 odds of $90,000 BTC near 50%As BTC price upside passed 20% over two days, consensus over potential targets through year-end began to improve. Data from prediction service Polymarket put the odds of BTC/USD hitting $90,000 before 2027 at 48% at the time of writing, up sharply since the start of the week. Odds of BTC/USD hitting $90,000 by Jan. 1, 2027 (screenshot). Source: PolymarketRelated: Strategy Bitcoin treasury hits breakeven point as BTC price passes $77KSome market participants, however, remained skeptical. Trader and analyst Rekt Capital stressed that Bitcoin needed to reclaim its 50-week exponential moving average (EMA) at $77,232, a trend line it rejected in January.“Break the Downtrend and Bitcoin will confirm entry into a new technical Macro Uptrend. Reject from here however and price will maintain its series of Lower Highs,” he told X followers. “History suggests there’s still time for price to continue its Downtrend.”BTC/USD one-month chart. Source: Rekt Capital on X.com

Čítaj viac

Strategy Bitcoin treasury hits breakeven point as BTC price passes $77K

Bitcoin (BTC) hit $77,000 on Friday as business intelligence company Strategy’s corporate treasury returned to profit.Key points:Bitcoin reaches its highest level since May 26 as it revisits $77,000.Price returns above the cost basis for Strategy’s BTC corporate treasury at $75,385.Around 11% of the BTC supply constitutes a new band of support below $68,000.Strategy out of the red with Bitcoin at highest since MayData from TradingView showed new local highs above $77,400 prior to the week’s final Wall Street open.BTC/USD one-day chart. Source: Cointelegraph/TradingViewNow up around 20% in 48 hours, BTC/USD saw little by way of consolidation as it reclaimed a key level for Strategy, the world’s largest corporate Bitcoin treasury company. Data from monitoring resource BitcoinTreasuries puts the cost basis for Strategy’s holdings of 840,447 BTC at $75,385, currently with a year-to-date gain of approximately $450 million.Strategy Bitcoin treasury cost basis data. Source: BitcoinTreasuriesAs Cointelegraph reported, between Aug. 3 and Aug. 9, Strategy opted to sell a small portion of its treasury worth 1,690 BTC to repurchase 1.15 million shares of its STRC preferred stock for $108.6 million. The move represented the company’s fourth Bitcoin sale of 2026.Concerns over the long-term viability of the company’s Bitcoin investment thesis accompanied the sales, something that the subsequent BTC price run-up should help alleviate, independent crypto analyst William Clemente suggested.“Not only should Saylor/Strategy fears have been abated for a while once he showed that he was willing to sell BTC to rebuy STRC, but now after this price impulse they are even more over-collateralized by their BTC holdings,” he wrote on X, referring to former CEO Michael Saylor.In an interview with Fox News earlier in August, current CEO Phong Le stated that Strategy would return to buying Bitcoin before the end of the year.New BTC buy wall sits below $68,000Amid misgivings over the durability of Bitcoin’s volatile upside move, analysis from onchain analytics platform Glassnode revealed a new safety net forming below $70,000.Related: Bitcoin has ‘largely purged’ froth that preceded 50% drop from $126K: BlackRockSome 3.44 million BTC now have an onchain cost basis, also known as realized price, between $58,000 and $67,000. Of this, 2.23 million BTC — equal to around 11% of the total supply — was added over the past 11 weeks.“It’s the densest cost-basis cluster below spot — a key potential support zone on any retracement,” Glassnode cofounder Rafael Schultze-Kraft commented on X.Bitcoin UTXO realized price distribution data. Source: Rafael Schultze-Kraft on X.comBTC/USD broke through several key resistance levels this week, including its 200-day simple moving average (SMA) at $68,967, a key target to reclaim to end the long-term BTC price downtrend.

Čítaj viac

Bitcoin price reaches $72.5K as US issues ‘Economic D-Day’ threat to Iran

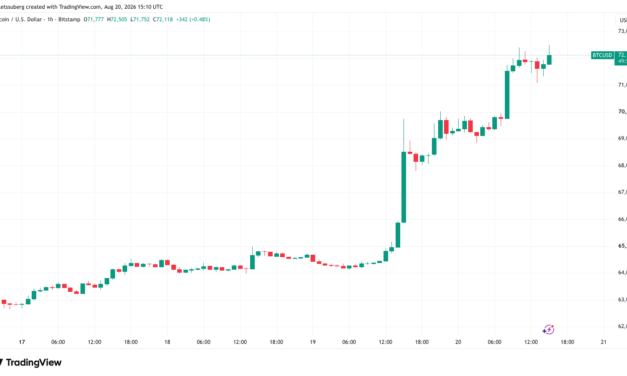
Bitcoin (BTC) saw multimonth highs after Thursday’s Wall Street open while stocks dipped and bond yields rebounded on US-Iran war nerves.Key points:Bitcoin builds on its highest levels in 11 weeks to hit $72,500 on Bitstamp.US bond yields see volatility after president Donald Trump threatens “economic warfare” with Iran.Bitcoin market participants question whether the rally has staying power.US bond yields reverse higher after Trump pledges “economic warfare” with IranData from TradingView showed BTC/USD retesting $71,000 before hitting new 11-week high of $72,505 on Bitstamp, up by more than 4% on the day.BTC/USD one-day chart. Source: Cointelegraph/TradingViewUS equities opened lower after US president Donald Trump threatened Iran with the “most crushing economic operation ever taken against any country,” calling it “Economic D-Day.”“This will be economic warfare and isolation on an unprecedented scale,” he wrote in a post on Truth Social amid frustration over the lack of a deal with the US on the Strait of Hormuz oil route.WTI crude oil reached $87.69 per barrel on the day, its highest since July 24.CFDs on WTI crude oil one-day chart. Source: Cointelegraph/TradingViewThe comments further appeared to cause a rebound in US government bond yields, which had fallen sharply the day prior after the US Treasury announced that it would at least double the size of its bond-market liquidity interventions from September.The 30-year yield traded as low as 5.179% on the day before rebounding to 5.266% — an increase of 9 bps, which nearly erased the previous downside. The 10-year bond yield also reversed the previous day’s drop.US 30-year bond yields one-day chart. Source: Cointelegraph/TradingViewThe Kobeissi Letter cast doubt on whether the intervention would be sufficient to calm markets. “It’s going to take a lot more intervention to tame this beast,” it wrote in a post on X. The Treasury confirmed in its announcement that it would revisit the size of debt buyback operations on Nov. 4.US 10-year bond yields chart. Source: The Kobeissi Letter on X.comAnalysis: Too early to call Bitcoin bull-market comebackAfter gaining nearly $10,000 over four days, Bitcoin left market participants skeptical about the durability of its newfound strength.Related: Bitcoin has ‘largely purged’ froth that preceded 50% drop from $126K: BlackRockIn ongoing X coverage, trader and analyst Rekt Capital argued that BTC/USD would need to sustain its gains to challenge the grip of the bear market.“Bitcoin will need to rally a lot more than what it has produced thus far if price is to invalidate the ‘weakening support’ idea. At the moment, technicals are pointing to $60k as a weakening macro support,” he wrote on Thursday.A further post noted that four-year BTC price cycle patterns would allow for a new macro BTC price low until the end of 2026.BTC/USD one-month chart. Source: Rekt Capital on X.comContinuing, Ki Young Ju, CEO of onchain analytics platform CryptoQuant, flagged the return of positive demand for Bitcoin on both spot and derivatives markets — a phenomenon not seen since October 2025, when BTC/USD saw its most recent all-time high of $126,200.“The scale remains modest, but if this holds for another month, it would be reasonable to conclude that the bear market is over and a new bull cycle has begun,” he told X followers.Previously, Cointelegraph reported on the lack of spot demand as a key missing catalyst for a sustainable crypto market reversal.Bitcoin demand growth data. Source: Ki Young Ju on X.com

Čítaj viac

Crypto short liquidations pass $3B mark as Bitcoin price nears $72K

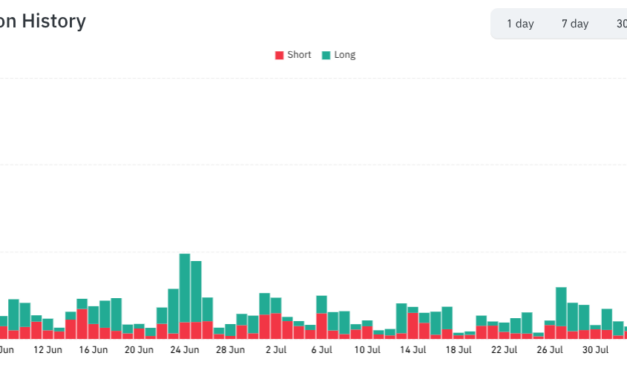
Bitcoin (BTC) and altcoins are breaking records as short position liquidations pass $3 billion over two days.Key points:Crypto short liquidations since Thursday are in excess of $3.1 billion, per CoinGlass data.Bitcoin continues its upside reaction to a US Treasury liquidity intervention, approaching $72,000.Bitcoin short-term holders take profit on previously underwater positions and move 43,300 BTC.Two-day crypto short liquidations hit $3.1 billionData from CoinGlass shows ongoing crypto short liquidations at $3.1 billion for Aug. 19-20. Thursday’s tally was largest single-day wipeout of shorts ever recorded.Crypto liquidations history (screenshot). Source: CoinGlassOn Wednesday, BTC/USD led the charge by reacting to a liquidity intervention by the US Treasury with a price spike to the highest levels seen since the start of June. At the time of writing, upside continues, with the pair reaching local highs of $71,992 on Bitstamp, per data from TradingView.BTC/USD one-day chart. Source: Cointelegraph/TradingViewCoinGlass shows Bitcoin accounting for just over half of the total short liquidations at $1.65 billion.The numbers do not represent the largest crypto liquidation event if long positions are included. It is dwarfed by the $20 billion long liquidation cascade that followed Bitcoin’s reversal from the most recent all-time high of $126,200 in October 2025.In US dollar terms, data from CoinMarketCap puts Thursday’s total liquidations in seventh place historically, calculating the day’s long and short liquidations as $3.25 billion.Bitcoin speculators take profit as cost basis returnsBitcoin investors, meanwhile, capitalized on positions that were previously held at an unrealized loss.Related: HYPE jumps 20% as Trump signals legal US path for HyperliquidShort-term holders — wallets holding a UTXO for less than 155 days — sent a record 43,300 BTC in profit to exchanges in their largest profit-taking move of 2026, per onchain analytics platform CryptoQuant.Bitcoin STH profit and loss to exchanges (screenshot). Source: CryptoQuantAs of Thursday, the spent output profit ratio (SOPR) metric for the short-term holder (STH) cohort stood at 1.01, its highest since April. This reflects that the majority of coins in UTXOs from STH wallets moved at a higher price than in their previous transaction.Bitcoin STH-SOPR data. Source: CryptoQuantPreviously, Cointelegraph reported that the STH cohort’s aggregate cost basis, also known as the STH realized price, stood at $68,700. At the time, analysis warned that any price upside could be stifled by the urge of investors in this cohort to exit underwater positions.

Čítaj viac

Získaj BONUS 8 € v Bitcoinoch

nakup bitcoin z karty

Registrácia Binance

Burza Binance

Aktuálne kurzy